
Abstract
Kraków, Poland, is a city with poor air quality, located in the large Wisła (Vistula) valley, and affected by a foehn wind from the Tatra Mountains. We analyzed 14 long episodes of the foehn from the periods Sep 2017 - Apr 2018 and Sep 2018 - Apr 2019. Data used included measurements of PM10 (i.e. particulate matter with an aerodynamic diameter up to 10 µm) concentrations) concentrations, air temperature and relative humidity, wind speed and direction from ground stations and mast measurements up to 100 m a.g.l., along with model analysis results. A non-operational configuration of the AROME CMC (the Application of Research to Operations at Mesoscale canonical model configuration) 1 km x 1 km was applied. A conceptual model concerning the impact of a foehn on urban air pollution was developed. The occurrence of a particular effect of a foehn on the PM10 spatial-temporal pattern depends on its mode of transfer through the city: a. a foehn flows above the valley where a strong cold air pool and a return flow can be found; b. a foehn enters the valley from the eastern, wider part or from the valley top and destroys the cold air pool; c. gravity waves generated by a foehn are strong enough to enter the western narrower part of the valley and cause large spatial differences in turbulence parameters within the city. The first transfer mode worsens air pollution dispersion conditions throughout the city and leads to large increases in PM10 levels (from below 50 to 150-200 µg⋅m−3), the second mode improves dispersion and leads to large decreases in PM10 levels (from 150-200 to below 50 µg⋅m−3) throughout the city, and the third generates large spatial differences in PM10 levels (50-70 µg⋅m−3) within the city. There is no single effect of a foehn on air pollution dispersion conditions.
1. Introduction
Abundant air pollution with particulate matter (PM) is still a serious environmental and social problem in many cities all over the world, for instance Santiago (Muñoz and Corral Citation2017), Beijing (Liu et al. Citation2019), Grenoble (Largeron and Staquet Citation2016) and Los Angeles (Wang et al. Citation2017), and PM is currently considered the best indicator for the health effects of ambient air pollution (Burnett et al. Citation2014; WHO Citation2016). High PM concentrations are caused by emissions from various stationary and mobile sources, and from chemical reactions between primary and secondary pollutants, but atmospheric conditions are equally important and can significantly modify air pollution dispersion and/or removal (e.g. Seinfeld and Pandis Citation1998; Prtenjak et al. Citation2009; Toro A et al. Citation2019). For example, precipitation has a great impact on concentrations of particulate matter, but it mainly washes out coarse particles while having little effect on fine particles (Li Y. et al., 2015). Foehns are among weather phenomena with great potential for modifying the urban boundary layer (UBL) and thus the atmospheric conditions for air pollution dispersion.
The impact of foehns on concentrations of air pollution has been studied mainly at a regional scale (e.g. Mira-Salama et al. Citation2008; Turton et al. Citation2018; Álvarez and Noel Carbajal Citation2019); studies at a city scale are rather rare (e.g. Corsmeier et al. Citation2006; Li X. et al., 2015). However, Vicente et al. (Citation2018) point out that urban air quality is characterized by high spatial and temporal variability, as the factors controlling it (e.g. chemical and physical processes that deliver PM, traffic intensity and the location of buildings and other obstacles) usually vary spatially, too. Therefore, studies on intra-city spatial variations of air pollution levels become crucial from the point of view of habitability and health risk. The present paper has focussed on concentrations of PM10, i.e. particulate matter with an aerodynamic diameter up to 10 µm.
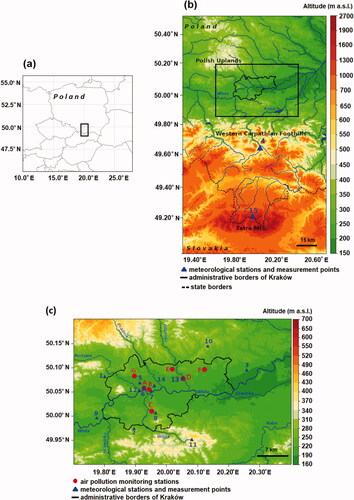
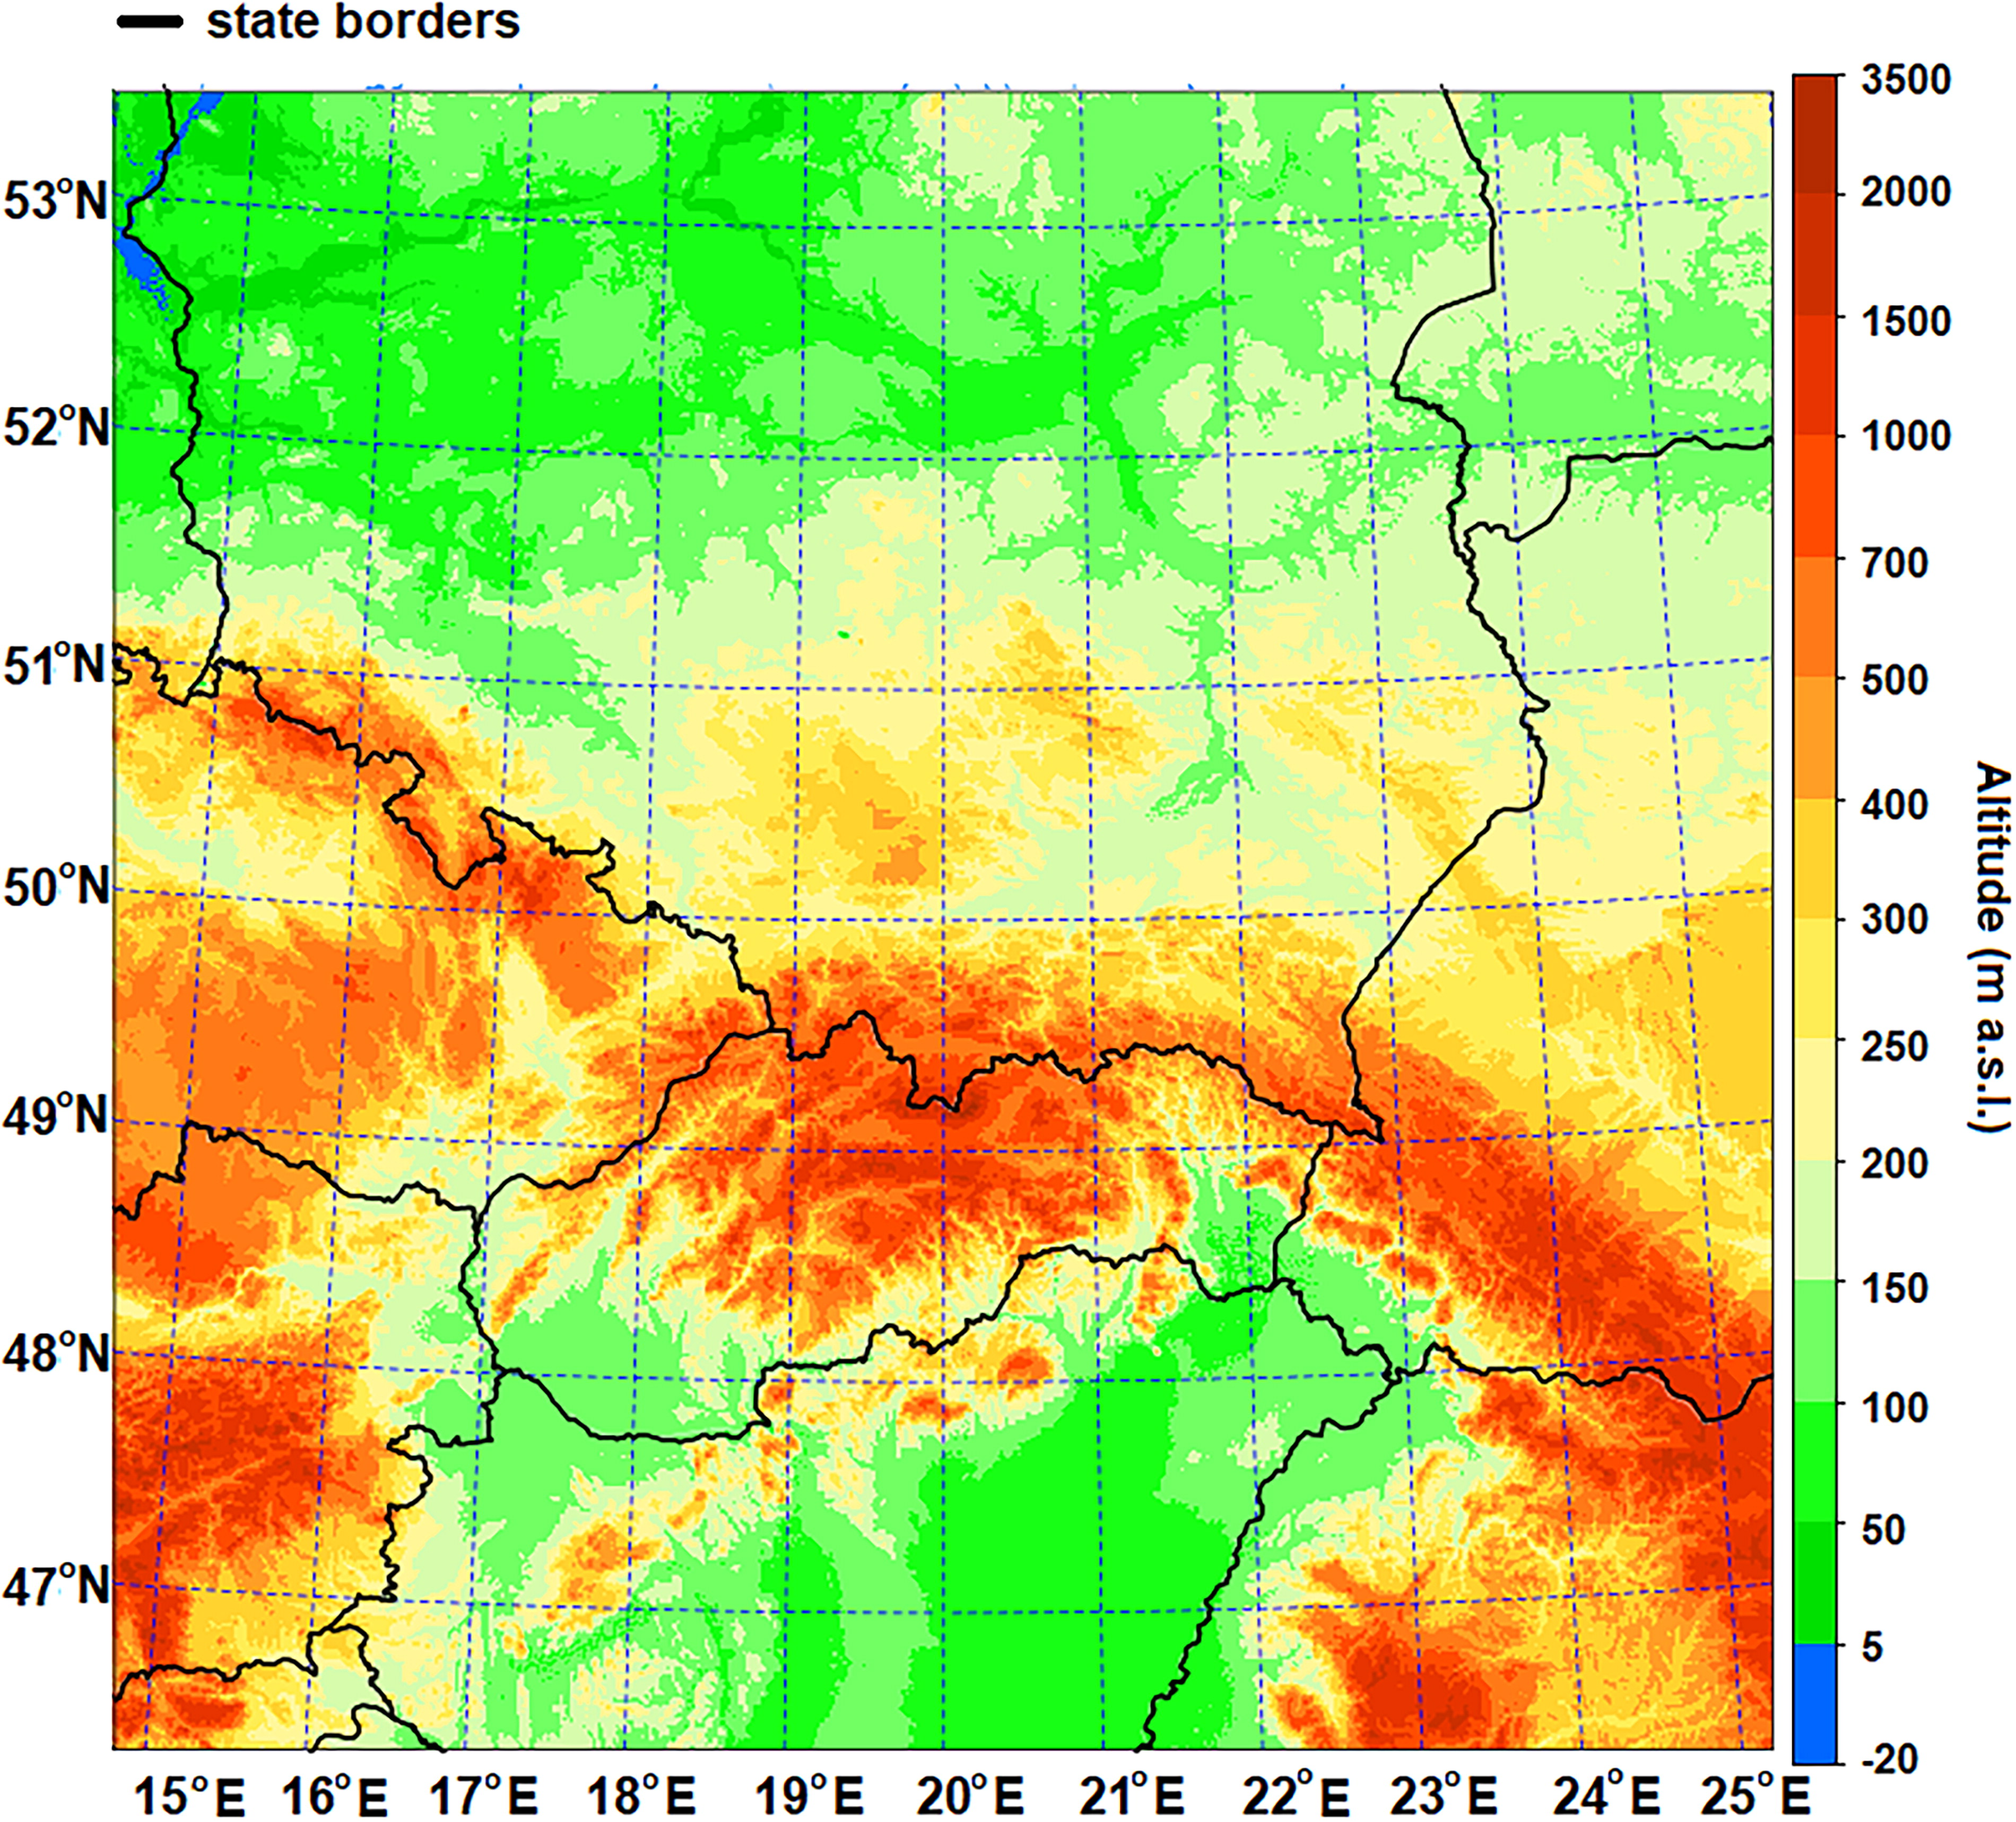
The aim of the paper is to evaluate the importance of a foehn on spatial and temporal changes to PM10 concentration in Kraków, southern Poland. Kraków is a large city located in a valley (but outside a mountainous area), with very diversified environmental conditions (described in detail in Section 2), and has very poor natural ventilation. In spite of a significant improvement in aerosanitary conditions after 1989 (e.g. Bokwa Citation2008), Kraków is still one of the most polluted cities in Europe concerning PM10 as it is in the 6% of all European measurement sites where the mean annual limit value of PM10 (i.e. 40 μg⋅m−3) was exceeded in 2016 (European Environment Agency Citation2018). The city is located in the Wisła (Vistula) valley, which is parallel to the Carpathian Mountains to the south, and the Wyżyny Polskie (Polish Uplands) to the north (). About 100 km south of Kraków, is the highest ridge of the Carpathians, the Tatra. In a certain synoptic situation, a foehn known as ‘halny’ occurs there and brings significant weather changes to the region (Ustrnul Citation1992b). Ambient air pollution in Kraków has been the subject of numerous studies (e.g. Niedźwiedź and Olecki Citation1995; Walczewski et al. Citation1996; Bokwa Citation2007) and a strong dependence of high PM concentrations on weather conditions has been shown (e.g. Niedźwiedź and Olecki Citation1994; Tomaszewska Citation1994; Bokwa Citation2011). However, little is known about the impact of a foehn on spatial and temporal patterns of PM10 pollution in the city. Interactions between foehns and air pollution determined for other world regions or cities show a large variety of effects due to the different atmospheric processes generated, and the strong primary dependence of those effects on local topography. The atmospheric processes linked to foehns which have a significant impact on air quality in urbanized areas include:
Fig. 1. Location of the region studied: a. in Central Europe, b. in southern Poland, c. at the junction of the Wisła valley, Polish Uplands and the Western Carpathian Foothills.
Key: numbers and letters as in and 2. Topographic data used in comes from the Shuttle Radar Topography Mission database provided by National Aeronautics and Space Administration (https://www2.jpl.nasa.gov/srtm/).
Intensification of an air temperature inversion in the valley in which a city is located; it can be linked to the occurrence of a so-called ‘sandwich’ foehn (Vergeiner Citation2004), or to the formation of an effective lid that traps pollutants in the cold air pool (CAP) below, by reducing the available mixing volume (Drechsel and Mayr Citation2008); these processes are linked to a high increase in air pollution
Removal of the CAP and the penetration of the foehn flow to the valley floor, due to the diurnal heating of the cold pool by solar radiation which may diminish stability and allow vertical mixing, turbulent erosion at the top of the cold pool, or interaction with orographic gravity waves (Drobinski et al. Citation2007; Flamant et al. Citation2006); these processes improve air pollution dispersion conditions and decrease its concentration.
Foehn/CAP interaction still poses a major challenge to understanding and predicting local weather and air pollution dispersion conditions, and in Kraków the CAP forms often in areas of the Wisła valley surrounding the city (see Section 2). Therefore, the present study on the role of the foehn on PM10 concentrations contributes to general research on the mechanisms of interaction between foehns and local-scale meteorological phenomena, including air pollution dispersion conditions.
2. Study area
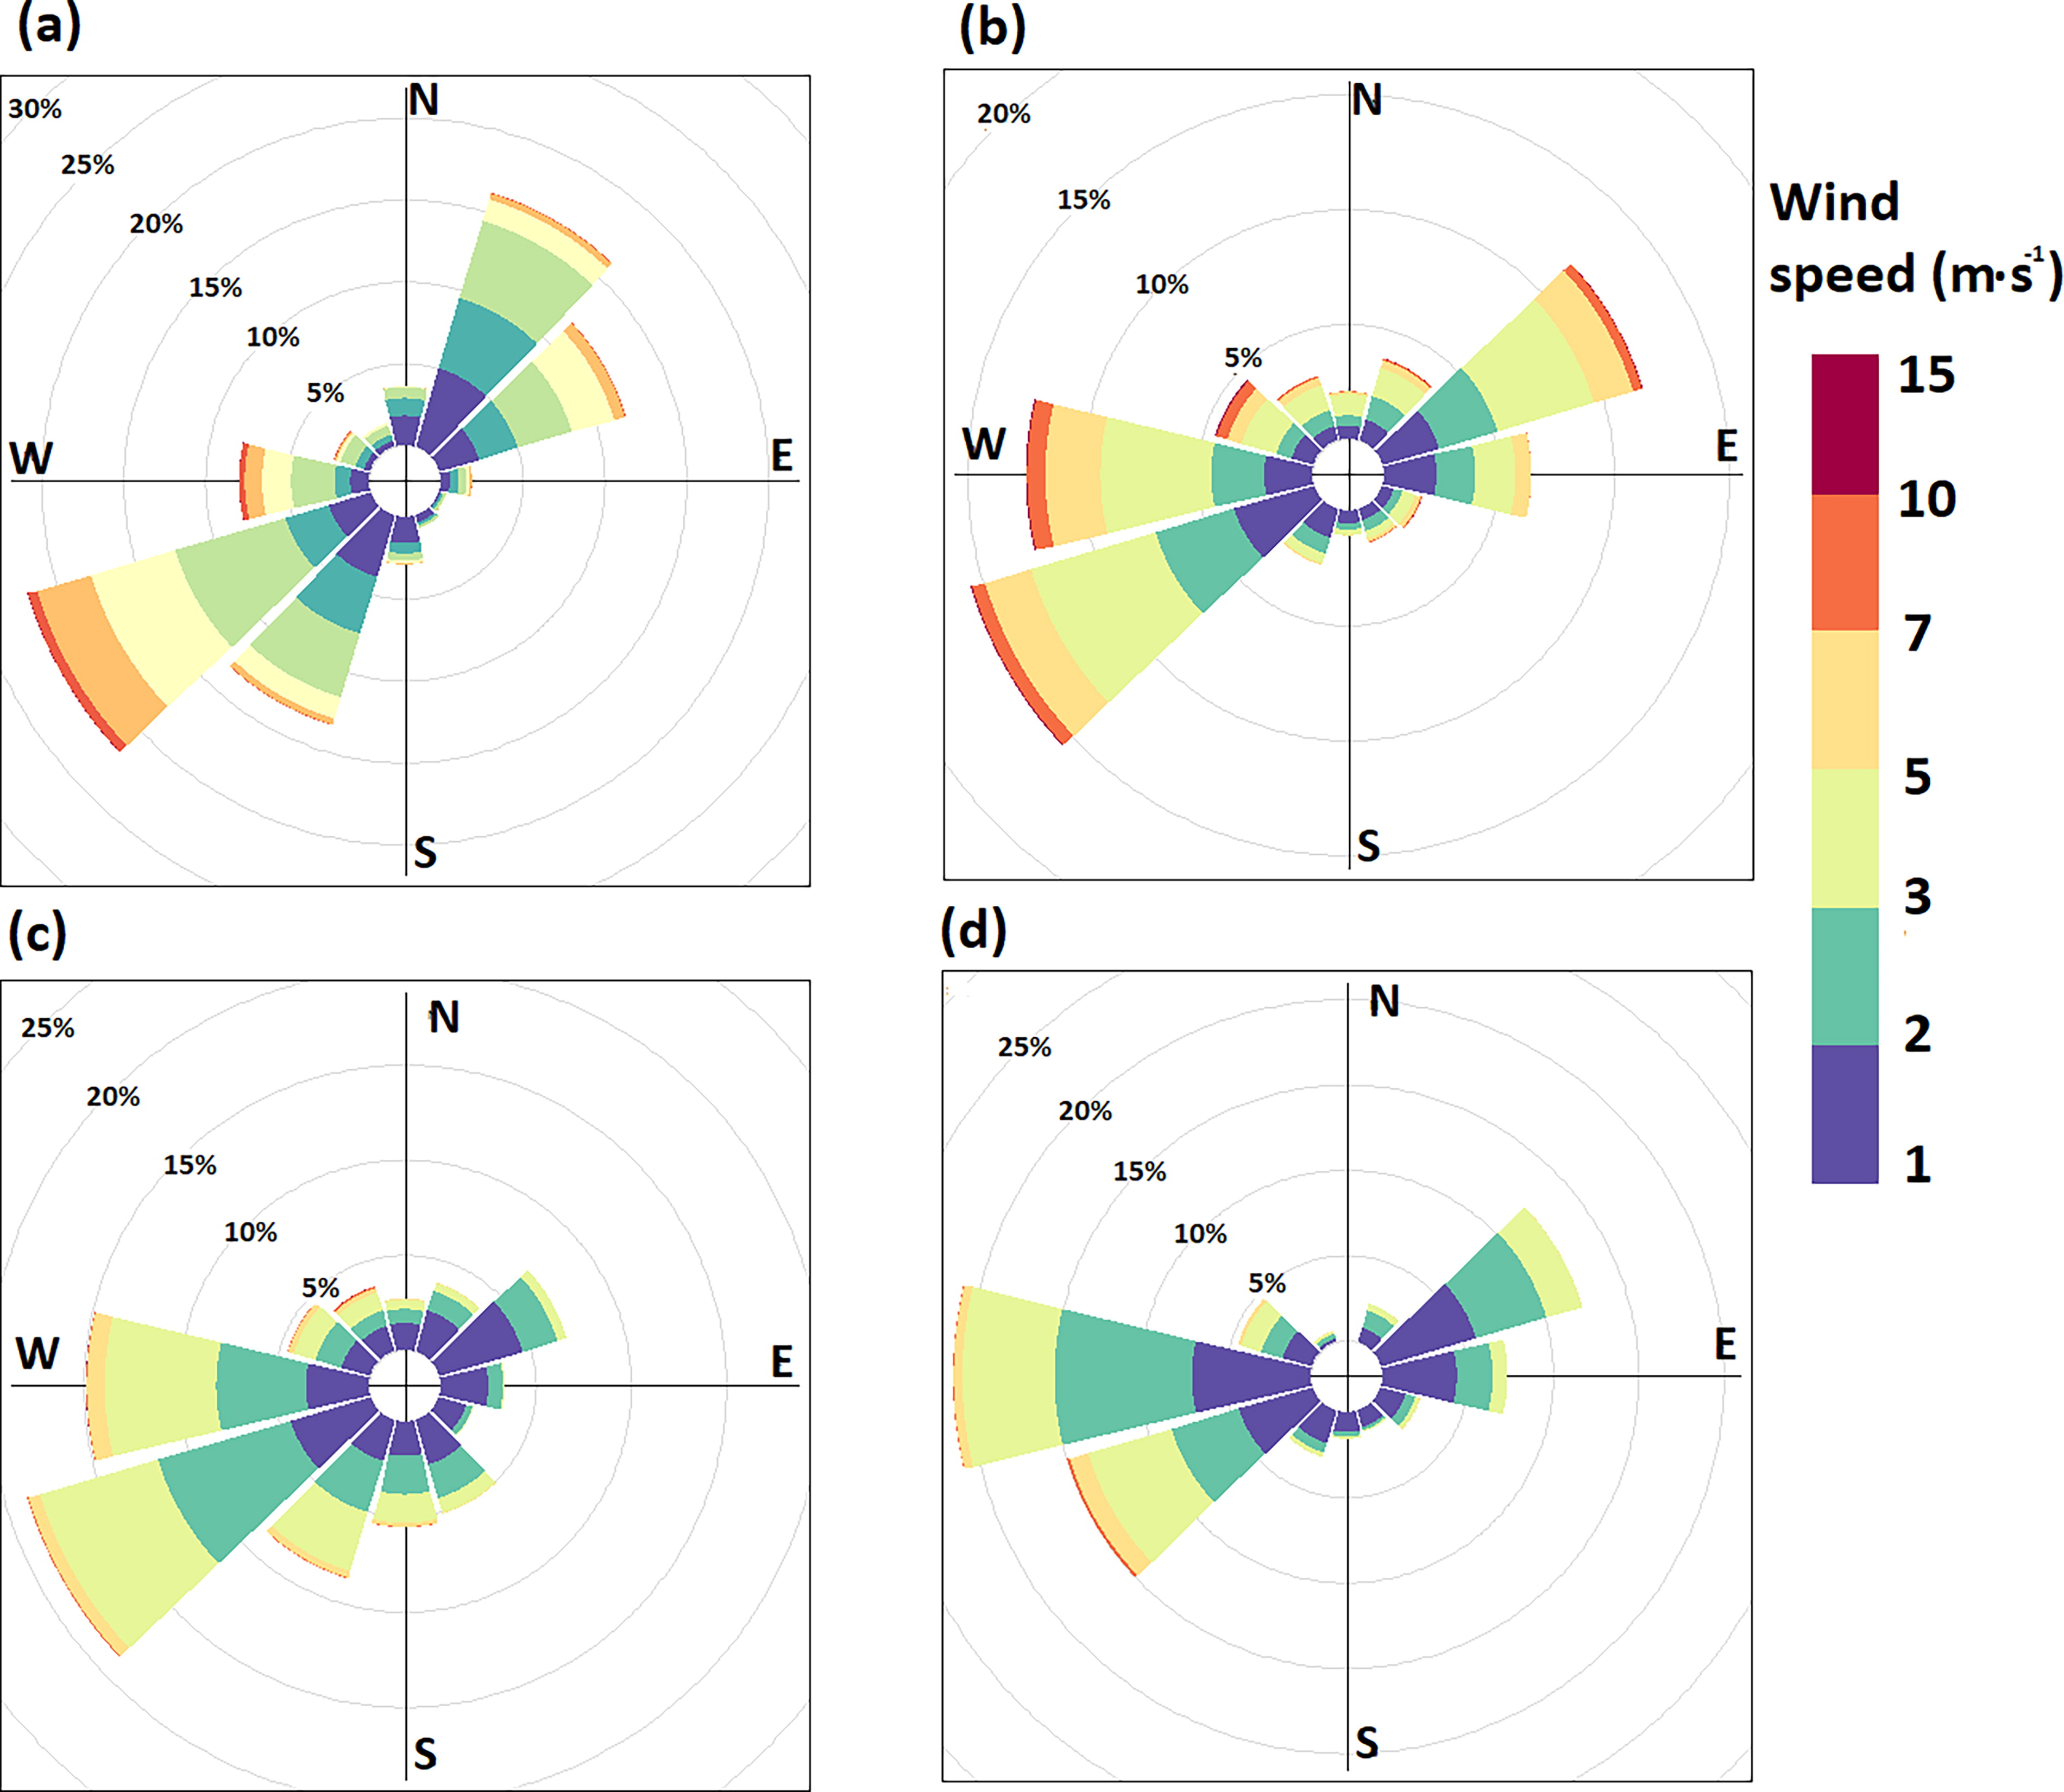
Kraków is the second largest city in Poland, located in the Małopolska (Lesser Poland) region, with an area of 326.8 km2 and 771 000 inhabitants (data from Dec 2018; Statistical Yearbook of Kraków Citation2019). Kraków agglomeration consists of the city itself and the highly populated towns and villages which surround it; the total number of inhabitants is estimated to exceed one million. The city’s area belongs to three different geographical regions and geological structures, i.e. the Polish Uplands, the Western Carpathians, with the basin of the Carpathian Foredeep in between. The central part of the city is located in the Wisła valley at an altitude of about 200 m a.s.l. In the western part of Kraków, the valley is as narrow as one km wide. However, in the eastern part of the city, the valley broadens to about 10 km and there is a system of river terraces. East of the city’s borders, the Raba enters the Wisła via a valley cutting through the Carpathian Foothills from south to north. The hilltops bordering the city to the north and south reach about 100 m above the valley floor, similar to the hilltops in the western part of the valley which means that the city is located in a semi-concave basin open to the east, and sheltered from the prevailing westerly winds (). The local-scale processes linked to the impact of relief include katabatic flows, CAP formation, frequent air temperature inversions and a much lower wind speed in the valley floor than on the hilltops (e.g. Hess Citation1974). According to Hajto and Rozwoda (2010), who studied sodar data from Kraków at an hourly resolution in the months from October to March, the mean monthly frequency of stable atmospheric conditions varies from 58.1% in March to 74.0% in December. All the factors mentioned contribute to the poor natural ventilation of the city and the occurrence of high PM10 levels, especially in the heating season. Analysis of the data on wind speed and direction from three meteorological stations in the Wisła valley (Balice, Reymonta St, Igołomia) and one station on a nearby hilltop (Libertów) for the two cold seasons (Sep 2017 to Apr 2018 and from Sep 2018 to Apr 2019) indicated significant spatial variability due to the complexity of the landforms and the presence of urban structures (, Appendix 1). In terms of spatial variability, the average frequency of weak winds (up to 2 m⋅s−1) varied from 36% in Balice to 59% in Reymonta St; in Libertów and Igołomia the values reached 50%. For a wind speed ≥5 m⋅s−1, the highest average frequency was measured in Igołomia (12%) and Balice (20%), while in Libertów and Reymonta St it did not exceed 3%. A wind speed ≥10 m⋅s−1 was noted in Igołomia (26 hourly cases) and Balice (122 hourly cases) − 1% for both analyzed periods only. Dominant wind directions are strongly linked to the impact of relief. In Balice they are SW and NE, in Igołomia and Reymonta St, W and E, while in Libertów, SSW to WNW.
Table 2. Location of air pollution stations in Kraków.
3. Data and methods
The research is based on various data from two sub-periods: Sep 2017 - Apr 2018 and Sep 2018 - Apr 2019. Such sub-periods were chosen because 1. They include the heating season when PM10 concentration in Kraków is highest; 2. They include the cold half of the year when foehns occur most often; 3. At the end of 2016, the number of PM10 measurement points in Kraków, administered by the National Inspectorate for Environmental Protection, was increased from 3 to 8 which allowed data sufficient for the present research to be obtained.
The delimitation of foehn episodes was carried out using criteria from Ustrnul (Citation1992a). Periods of potential foehn were determined based on an analysis of measurement data from the meteorological mountain observatory of the Institute of Meteorology and Water Management - National Research Institute (Pol: IMGW-PIB) on Kasprowy Wierch in the Tatra Mountains (1991 m a.s.l.) (); a potential foehn event was defined as a period when wind speed was ≥10 m⋅s−1 and wind direction was in a range from SE to SW (i.e. 140–220˚).
The next step was the verification of foehn occurrence in the area of Kraków and nearby. The foehn episodes included in the present study are classical cases according to Hann’s theory (1901), however, foehns are complex atmospheric phenomena in both genesis and occurrence (e.g. Brinkmann Citation1971, Hoinka Citation2007, Seibert Citation1990, Gohm and Mayr Citation2004, Drobinski et al. Citation2007, Cetti et. al. 2015). In particular, this complexity concerns the assessment of foehn occurrence at weather station level and at particular points or areas. The research area used in the present study has diversified relief and land use/land cover which has a significant impact on climatic conditions at a local scale. In Kraków for periods of potential foehn occurrence they were confirmed if at least one of the following criteria sets was fulfilled (according to measurements in Balice, and/or Libertów and/or Igołomia):
wind direction: 90–270˚, wind speed: ≥5 m⋅s−1, presence of altocumulus lenticularis clouds;
wind direction: 90–270˚, wind speed: ≥5 m⋅s−1, relative humidity ≤70%;
relative humidity ≤70% and the presence of altocumulus lenticularis clouds.
The criteria were established by Ustrnul (Citation1992a,b) for the area of southern Poland from an analysis of synoptic maps and measurement data from the period 1966–1985. Such an approach allowed situations when a foehn occurred somewhere in the whole area from the Tatra Mts to Kraków to be identified. However, it should be mentioned that most probably a foehn impact was not observed at all measurement points of that area as for instance valley floors quite often experience air temperature inversions, and that prevents the entrance of a foehn to such areas.
The duration of a foehn in the Kraków area was defined as the number of consecutive hours when these criteria were fulfilled. The conditions were checked by analysis of measurement data from meteorological stations and measurement points located around Kraków and within the city, as presented in . Observations of altocumulus lenticularis clouds were obtained from the climatological station of the Jagiellonian University in the Botanical Garden in Kraków. shows the location of the meteorological stations and measurement points.
Potential foehn episodes were divided into long (>24 h) and short (≤24 h), and only the long ones were included in further analyses.
There were 14 long episodes which all together lasted for 591 hours and occurred on 40 days (Appendix 2). Altocumulus lenticularis clouds were found during 13 out of 14 long foehn episodes and provided a visible proof of foehn occurrence in the study area even if at the station level the foehn impact was not detectable for example due to the impact of the relief. The episodes studied can be considered ‘deep’ foehn cases, following the criteria of Zängl (Citation2003) and Gohm and Mayr (Citation2004) from an analysis of synoptic maps for long foehn episodes.
Data on PM10 concentrations come from the data bases of the National Inspectorate of Environmental Protection (https://powietrze.gios.gov.pl/pjp/archives). Mean hourly and daily concentrations for the sub-periods Sep 2017 - Apr 2018 and Sep 2018 - Apr 2019 from seven measurement points located in Kraków were used (, ). The measurement points represent several parts of the city, located on various types of landform and land use/land cover (see for the location of the measurement points):
Krasińskiego St: street canyon in the city center on the floor of the Wisła valley, with a very busy municipal transportation route and intensive traffic;
Dietla St: a busy inner ring road in the city center on the floor of the Wisła valley, with intensive tram, bus and vehicular traffic;
Kurdwanów district: suburban area in a large district of blocks of flats in the southern part of the city, about 50m above the valley floor;
Bulwarowa St: suburban area in a large district of blocks of flats, located close to the steelworks in the eastern part of the city, on a terrace of the Wisła;
Piastów district: suburban area in a large district of blocks of flats in the eastern part of the city, on the slopes of the Wyżyny Polskie (Polish Uplands), about 50m above the valley floor;
Wadów district: suburban area with agriculture activity and scattered residential buildings located close to the steelworks, on a river terrace in the eastern part of the Wisła valley;
Złoty Róg St: suburban area in a large district of blocks of flats and residential buildings, on the slope of the Wyżyny Polskie (Polish Uplands) in the western part of the city.
The other measurement point operated by the National Inspectorate of Environmental Protection, i.e. in Swoszowice district, was not taken into consideration due to large gaps in its data base. The general features of the spatial variability of PM10 concentrations, shown below with daily data, give the background for an analysis of hourly data in the context of foehn impact. The PM10 levels in the study periods were not only relatively high but they also showed significant spatial variability within the area of Kraków. The number of days with a mean daily PM10 level ≥ 50 μg⋅m−3 (i.e. exceeding the allowed value), was highest in Krasińskiego St at 275 days, which is 57% of all days in the periods analyzed (i.e. Sep 2017 - Apr 2018 and Sep 2018 - Apr 2019). For other measurement points, the percentage of such days varied from 38% in Dietla St to 24% in the Wadów district (Appendix 2). Additionally, the only case of a mean daily concentration above 200 µg⋅m−3 was noted in Krasińskiego St at 224 µg⋅m−3 on 5th Mar 2018.
Spatial variability of PM10 concentrations can also be shown as the difference between the lowest and the highest concentrations noted at measurement points at specific times. On 47 days in total (i.e. 10% of the study period), differences of mean daily PM10 concentration exceeded 50 µg⋅m−3, and the greatest difference was 136 µg⋅m−3 on 5th Mar 2018 between Krasińskiego St (224 µg⋅m−3) and Wadów district (88 µg⋅m−3). On 181 days (37%) differences in mean daily PM10 concentration were from 25 to 49 µg⋅m−3. These data additionally demonstrate a high spatial variability of PM10 levels within the city. The comparison of data on foehn occurrence and PM10 indices shows that differences of mean daily PM10 concentrations in the ranges of 25-50 µg⋅m−3 and 51-75 µg⋅m−3 are much more frequent during foehn episodes (43% and 16%) than for non-foehn periods (35% and 5%). During the study period, there were 56 days with potential conditions for a foehn based on data from Kasprowy Wierch. For 67% of them, the mean daily PM10 concentration allowed (i.e. 50 µg⋅m−3) was exceeded at one measurement point at least in Kraków; and for 14% of days, the maximum difference in PM10 mean daily concentrations between measurement points exceeded 50 µg⋅m−3. The figures for the whole period (i.e. both foehn conditions and non-foehn) were 57% and 10% respectively. During foehn periods, the share of the mean daily concentration above 50 µg⋅m−3 is larger at stations in the western part of the city than during non-foehn periods: in Krasińskiego St by +8%, in Dietla St by +18%, and in Złoty Róg St by +3%; while at other stations the share is smaller than during non-foehn periods. Therefore, a foehn can be considered as one of the factors which determine elevated PM levels in the western part of Kraków. On the other hand, mean daily concentrations of PM10 for days with foehn conditions and for all other days of the study period do not differ very much; the values for days with a foehn vary from 64 µg⋅m−3 in Krasińskiego St to 35 µg⋅m−3 in the Wadów district, while for the whole study period from 61 μg⋅m−3 in Krasińskiego St to 38 μg⋅m−3 in the Wadów district.
In order to analyze the impact of the foehn on the UBL and PM10 dispersion conditions in Kraków during long foehn episodes, model analysis outcomes were used, in addition to the measurement data described above, so as to obtain three-dimensional information for the area of the whole city and surrounding areas. Aire Limitée Adaptation Dynamique Développement International (ALADIN) is a numerical weather prediction (NWP) system developed by the international ALADIN consortium for operational weather forecasting and research purposes (Termonia et al. Citation2018). Part of the consortium's development work is to provide several configurations of a limited-area model (LAM), precisely validated to be used for operational weather forecasting at the 16 partner institutes. These are called the ALADIN canonical model configurations (CMCs).
Currently there are three canonical model configurations: 1. ALADIN baseline CMC, 2. Application of Research to Operations at Mesoscale (AROME) CMC, and 3. ALADIN–AROME (ALARO) CMC. AROME 2 km x 2 km grid spacing and ALARO 4 km x 4 km grid spacing, both with 60 vertical levels, are operationally used in IMGW-PIB. Non-operational configuration of AROME with 1 km x 1 km grid spacing and 87 vertical levels (AROME CMC 1 km) was applied in the present study as a better solution for the determination of the foehn effect on the UBL in Kraków, using lateral boundary data from ALARO 4 km x 4 km grid spacing. The size of the AROME CMC km domain was 810 × 810 points centered on 20°E 50°N. The location of the lowest model level is 9 m a.g.l., and the highest is at 50 km a.g.l. Details concerning the height of the lowest model levels up to 3 km altitude, information about the parametrization schemes used in the AROME model and a topographic map of the model domain are included in Appendices 4, 5 and 6. Due to ongoing work on the assimilation of surface data in the ALARO model in the ALADIN Poland group, data assimilation was not used in this research, and models were run in dynamical adaptation mode. The data obtained with the model were used to provide vertical profiles of wind speed and direction, air temperature and relative humidity, with a one-hour temporal resolution, in points representative for the western, central and eastern parts of the city, corresponding to measurements in Balice, Krasińskiego St and Bulwarowa St, respectively (see and and 2 for their location). Additionally, N-S cross-sections through the valley at those points were obtained for the same elements. For selected cases, wind and air temperature fields at selected levels were obtained for Kraków and surrounding areas.
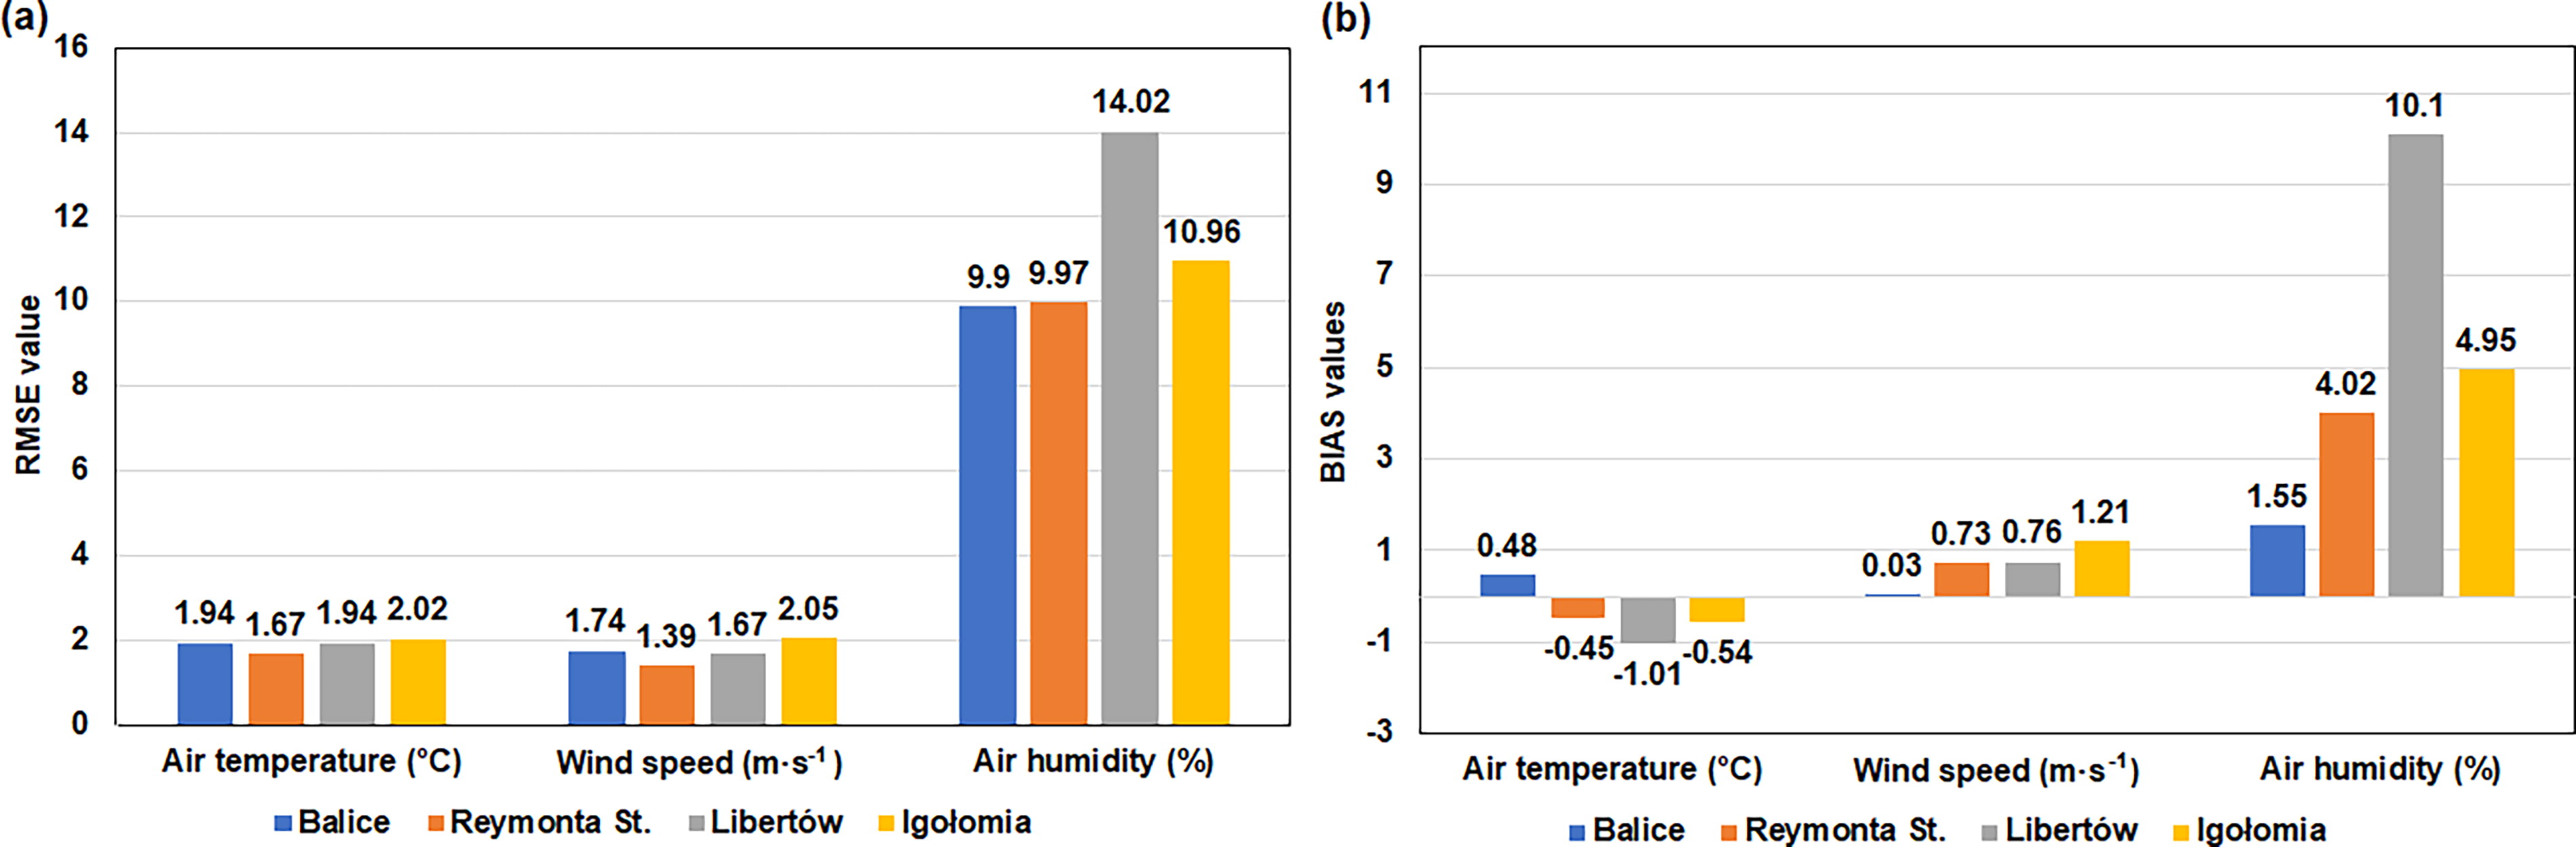
Verification of forecast results was performed for 24-h periods (beginning from the 7th hour of the forecast) for 40 selected days in the period during which the 14 long foehn episodes occurred. Data obtained from four meteorological stations (Balice, Libertów, Igołomia and Reymonta St) were used to verify the model forecast for air temperature, relative humidity and wind components on the valley floor and at the hill top nearby. The value of root mean square error (RMSE), difference (bias), and forecast accuracy were determined on the basis of differences between observation and forecast for each hour. Forecast accuracy was calculated for three difference ranges for all meteorological components (air temperature − 826 cases of one-hour observations; relative humidity − 826 cases; and wind components − 772 cases). For air temperature and wind speed the ranges were set to ±1, ±2, and ±5 °C or m⋅s−1, and for relative humidity and wind direction they were set to ±10, ±20, ±30% and ±20, ±50, ±90°, respectively. The accuracy for a given range specified the percentage of forecast hours when the difference between forecast and observation was below a specified range. Detailed information of model verification with meteorological stations measurements are included in Appendices 7 and 8. Appendix 8 presents wind roses based on forecast and measurements for two stations: one in the Wisła valley and one on a hill top.
Air temperature and relative humidity measurements (747 cases of one-hour observations) at 50 and 100 m a.g.l. from a telecommunication mast were used to verify the model forecast of atmosphere stratification in the western part of the Wisła valley. Values of RMSE and bias for air temperature and relative humidity for both altitudes (i.e. 50 and 100 m a.g.l.) are similar. Accuracy of air temperature in the range ±2 °C was equal to 87%, and for relative humidity accuracy in the range ±10% was higher than 80%. Differences between the forecast and observed air temperature gradients between 50 and 100 m a.g.l. were in the range ±1 °C/100m for 65% of cases. Differences between forecast and measured relative humidity gradients were in the range ±5%/100 m for 69% of cases. The verification procedure confirmed the convergence of model forecast results with observations, i.e. the AROME model properly presented spatial and vertical variations of meteorological conditions in the Wisła valley.
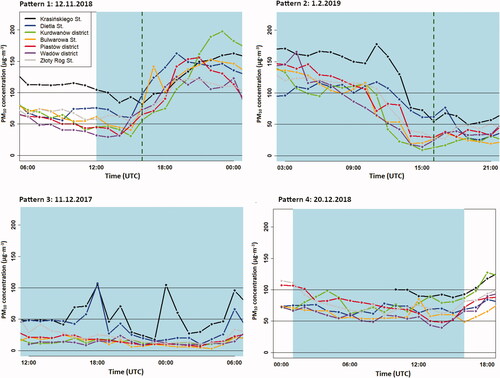
The first step of data analysis in a particular foehn episode was to distinguish the phases of PM10 concentration changes. Four spatial-temporal patterns of PM10 concentration, found in various episodes, were defined (): 1. a sudden large increase of PM10 concentrations at all measurement points; 2. a sudden large decrease of PM10 concentrations at all measurement points; 3. short-term peaks or long-term periods of high PM10 concentrations in the western part of the city only; 4. long-term periods of high PM10 concentrations at all measurement points.
Fig. 2. Examples of the four spatial-temporal patterns of PM10 concentration.
Key: blue background: foehn period; green dashed line: occurrence of altocumulus lenticularis cloud.
For each phase of each episode, all measurement and model data were analyzed in order to define the mechanisms responsible for a certain type of PM10 pattern. All available data on air temperature and relative humidity, from both measurements and the model, were used above all to determine whether a CAP was formed in the valley or not, and what its vertical extent was. Then the data were used to observe changes of UBL properties in the valley. To study the dynamics of turbulence, vertical Turbulent Kinetic Energy (TKE) fields from the AROME model were used (Termonia et al. Citation2018), as this type provides information about mechanical turbulence and convection potential. All available data on wind speed and direction were used to trace the occurrence of a foehn in the study area, its impact on the CAP, the parallel occurrence of katabatic flows and local winds modified by the relief. The next section presents the characteristics of each PM10 pattern, together with the mechanisms which modified the UBL and PM10 dispersion conditions.
4. Foehn-linked mechanisms generating spatial-temporal patterns of PM10 concentrations in Kraków
Within the 14 foehn episodes, for PM10 spatial-temporal Pattern no. 1 there were 8 cases; for Pattern no. 2 − 11 cases; for Pattern no. 3 − 15 cases; and for Pattern no. 4 − 3 cases. Usually, there were different patterns and cases of each pattern during each episode. The processes decisive for PM10 level changes were different in each pattern, and that is why no single index could be used to characterize all situations.
4.1. Pattern 1: a sudden large increase of PM10 concentration at all measurement points
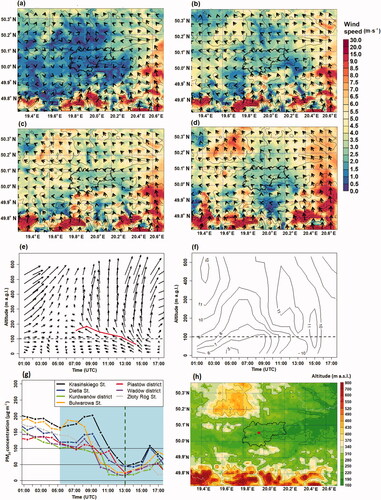
A PM10 increase case was considered a sudden and a large one if the concentration changed from allowed levels (i.e. below 50 µg⋅m−3) to about 150-200 µg⋅m−3 within 3-5 hours (see example on 12/13.11.2018 - ). In all cases, PM10 increase was linked to the development of an air temperature inversion in the Wisła valley. The air temperature difference between a level of 2 m a.g.l. and 100 m a.g.l. in the western part of the valley (at the telecommunication mast) reached from about 4 °C to as much as over 10 °C. At the same time, relative humidity reached 80-90% on the valley floor in rural areas which indicates fog occurrence, as the values were decreasing quickly with height. Wind speed inside the valley was below 3 m⋅s−1 while at about 100 m higher (i.e. above the valley) it increased to 6-8 m⋅s−1 (situation for the city centre - ). Warm and dry air streams, generated by the foehn, did not enter the valley but went above it to the north which contributed to the increase of the air temperature inversion (b - situation for the city centre). Additionally, in the western part of the valley, a weak northerly wind was observed but at station level only. The data indicate that there was a CAP on the valley floor which formed a stable air layer. The stability was further strengthened by katabatic flows from the slope of the Uplands presented in . Winds from the southern sector were forecast only on hill tops and selected parts of the valley, while in many lower parts of the valleys located on north-facing slopes, NW-NE light winds were predicted. They did not exceed 2 m⋅s−1 and they resulted from the orographic reflection of air streams coming from the south. This is an example of a phenomenon described for instance by Sheridan (Citation2019), i.e. a dense current-like return flow of air within and beneath an inversion (katabatic flows from the slope of the Uplands). It is worth mentioning that such a change of wind direction due to reflection can be seen in many parts of the Western Carpathians during foehn episodes and also that areas north of Kraków, are highly populated and deliver a lot of air pollution. Therefore, katabatic flows which enter the city from the north, contain a lot of PM10 and significantly worsen aero-sanitary conditions of Kraków. The foehn reduced available mixing volume and trapped the pollutants emitted inside the valley within a CAP, a mechanism described for instance by Drechsel and Mayr (Citation2008) or Kishcha et al. (Citation2017). Sheridan (Citation2019) summarized research showing that a CAP inhibits the penetration of a cross-mountain flow which is also the case in the present study.
Fig. 3. Vertical profiles of a. air temperature (°C); b. relative humidity (%); c. wind components for the location of PM10 monitoring station in Krasińskiego St; d. location of station in Krasińskiego St on a topographic map from the AROME model; e. spatial-temporal patterns of PM10 concentration on 12/13.11.2018.
Key: horizontal dashed black line for c: the Wisła valley height; blue background for foehn period; green dashed line for occurrence of altocumulus lenticularis cloud.
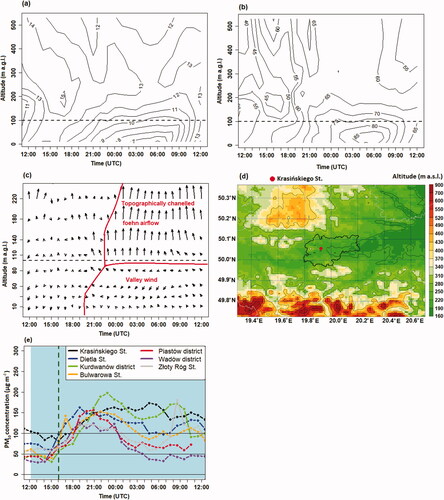
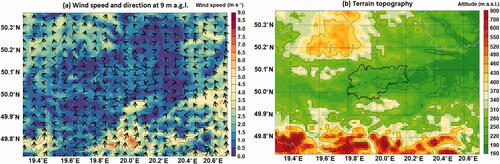
Fig. 4. Predicted wind speed and wind direction at 9 m a.g.l. from the AROME model at 19 UTC (a) (12.11.2018), and topographic map of terrain (b).
Key: thin lines: elevation; thick line: administrative borders of Kraków.
4.2. Pattern 2: a sudden large decrease of PM10 concentration at all measurement points
A PM10 decrease was considered a sudden and a large one if the concentration changed from about 150-200 µg⋅m−3 to values below allowed levels within 3-5 hours (see example on 25.11.2017 - ). PM10 decreases were linked to the intrusion of a foehn into the valley, destruction of the CAP and an increase in wind speed. However, two different modes of that process were observed. In the first, the foehn, moving from the south, entered the Raba valley first (a right tributary of the Wisła) east of Kraków and then moved into the area of Kraków from the east where the Wisła valley is much wider than in the western part of the city (). Therefore, the wind speed within the valley increased gradually from east to west, the air temperature inversion and CAP were destroyed (), and dispersion conditions improved significantly which led to a quick and large decrease in PM10 concentration.
Fig. 5. Spatial patterns of wind speed and direction at 50 m a.g.l. at 6 UTC (a), 8 UTC (b) 9UTC (c), and 11 UTC (d) in Kraków and nearby, and changes of wind components (e) and air temperature (°C) (f) in vertical profiles for the location of PM10 monitoring station in Krasińskiego St, from the AROME model on 25.11.2017, spatial-temporal patterns of PM10 concentrations on 25.11.2017 (g), and the location of the station in Krasińskiego St on a topographic map from the AROME model (h).
Key: black dashed line in f: Wisła valley height; red line in topographically channeled foehn flow in the valley; blue background in foehn period; green dashed line in occurrence of altocumulus lenticularis cloud.
The second is based on the intrusion of a foehn into the Wisła valley from the top of the CAP, an example of such situation was observed on 6/7.03.2019, see . In that case, first the wind speed increases gradually from the top of the CAP downward, while air temperature does too. Usually, the air temperature inversion in the 2-100 m a.g.l. stratum is still present and becoming more intense (due to warming of the upper strata - see air temperature measurements from the telecommunication mast- ) while PM10 concentrations are already decreasing, as there is the exchange of air between the CAP and the strata above. Additionally, as the CAP is decreasing, tall chimneys begin to deliver their emissions of PM10 into a well-mixed stratum above the CAP which contributes to a PM10 concentration decrease. Later in the day, the delivery of solar radiation triggers surface warming and the destruction of the CAP from the bottom (not shown). The CAP forming within the valley, and the topographically channelled foehn flow from the east, were predicted in the Wisła valley during that period.
Fig. 6. Vertical profiles of a. air temperature (°C), b. relative humidity (%), and c. wind components for the PM10 monitoring station in Krasińskiego St, from the AROME model on 6/7.3.2019, and d. air temperature measurements from the telecommunication mast at three altitudes. Spatial-temporal patterns of PM10 concentration on 6/7.3.2019 (e). Location of the station in Krasińskiego St and the telecommunication mast (marked Tower) on a topographic map, from the AROME model (f).
Key: dashed line in c: Wisła valley height; blue background in foehn period.

The mechanisms described above correspond well to those defined for the removal of the cold pool in the Rhine valley during a foehn event (Flamant et al. Citation2006). Convection within the cold pool seems to have the least significance due to low incoming solar radiation in the cold half year and shade from the valley. Turbulent erosion at the top of the cold pool, linked to a strong wind shear between the foehn air and the cold pool leading to the mixing necessary to deplete it, seems to be decisive in the second case described above. In the case of the Rhine valley, dynamic displacement of the cold pool by foehn air was attributed to an orographic wave effect while in case of the Wisła valley it should rather be linked to the channelling of the foehn flow first into the Raba valley and then to the Wisła.
4.3. Pattern 3: Short-term peaks or long-term periods of high PM10 concentration in the Western part of the city only
The differences in relief between the western and eastern part of the Wisła valley in Kraków contribute to the occurrence of Pattern 3, see example on 11/12.12.2017 (). The western part is much narrower and more closed than the eastern one, and as shown by Sheridan (Citation2019), valley width is an important parameter affecting interactions between the CAP and air flow above the valley. In all cases of Pattern 3, much larger PM10 concentrations were observed in the western than in the eastern part of the valley and were either long-lasting or occurred as concentration peaks. The wind speed in the eastern part was much higher than in the western, likewise the relative stability of the air layer within the valley. Such conditions show a significant impact of the relief on the foehn effect at a local scale which included closed eddies which in turn lead to the accumulation of air pollution locally. shows air temperature, relative humidity, wind speed and direction, and vertical velocity in an SW-NE cross section, with Krasińskiego St as a central, reference point. The fluctuations of air temperature and vertical velocity presented in the SW-NE cross section () correspond well to the spatial pattern of wind and TKE at a regional scale shown in .
Fig. 7. Spatial pattern of a. air temperature (contour lines), relative humidity (background) and wind speed (in knots) and direction (graphical symbols) in the SW-NE cross section through Kraków and nearby, and b. vertical velocity at 7 UTC on 12.12.2017. Location of the station in Krasińskiego St (reference point at ) and the extent of the cross section presented on on a topographic map, from the AROME model (c). Spatial-temporal patterns of PM10 concentrations on 11/12.12.2017 (d).
Key: reference point with distance 0: Krasińskiego St; the red and blue colour scales at cross section of vertical velocity in indicates upward and downward movements, respectively; blue background in foehn period; green dashed line in occurrence of altocumulus lenticularis cloud.
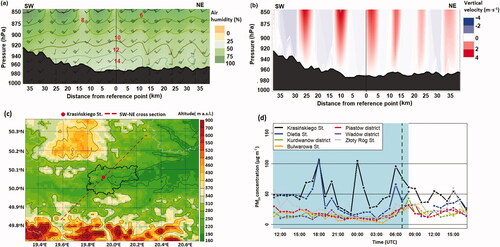
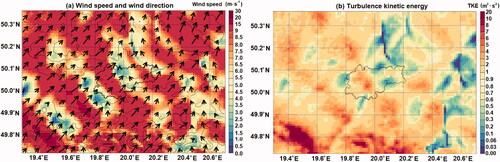
Fig. 8. Spatial patterns of a. wind components, and b. turbulent kinetic energy (TKE) at 30 m a.g.l. at 7 UTC on 12.12.2017.
Drobinski et al. (Citation2007) studied orographic waves linked to foehns in the Rhine Valley. They have shown that occasional intensification of an orographic wave at higher levels may force the foehn down to ground level and flush the cold pool downstream, for instance in the case of a breaking wave above. However, they also concluded that the sensitivity of amplitude, phase and temporal evolution of orographic gravity waves to ambient flow are still poorly understood. The study for Kraków shows that the gravity waves contributing to vertically trapped lee waves can cause a local and significant increase of PM10.
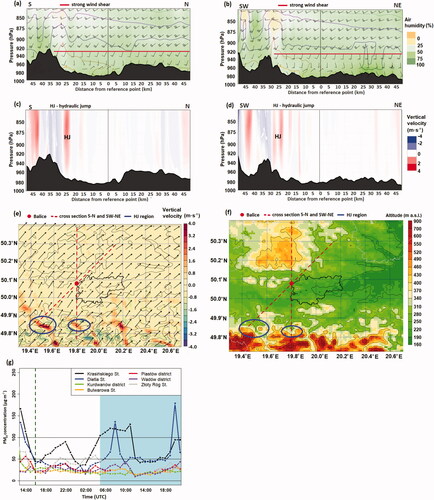
Another case that shows the impact of gravity waves on the CAP is presented with data from 9/10.2.2019 (). Very strong vertical movements can be seen in mountain areas south of Kraków while in the Wisła valley the phenomenon is much weaker (). This is shown by the measurements at the tower in the 50-100 m stratum in the western part of the valley, where there were isothermal conditions from 18 UTC on 9.02.2019 to 8 UTC on 10.02.2019. Gravity waves increased turbulence in the southern part of the city while in the northern part TKE was close to zero. The southern part of the city was warmer by about 2-3 K than the northern. According to additional measurements from other stations, in the 2-50 m stratum after 00 UTC, a strong temperature decrease occurred (.). The temperature in the western part of valley floor was similar (e.g. in Jeziorzany, Krasińskiego St tower station at 2 m a.g.l.) and dropped below zero, while in the eastern part of valley floor (Igołomia) and in locations at 50 and 100 m above the valley floor (Libertów, Bojki St telecommunication mast at 50 and 100 m a.g.l.), the temperature remained constant and was about 5 °C.
Fig. 9. Spatial pattern of a. air temperature; b. turbulent kinetic energy parameter (TKE), and c. wind components at altitude 30 m a.g.l. at 4 UTC (10.02.2019), in Kraków and nearby; d. air temperature measurements from ground stations on 9-10.02.2019; S-N cross sections of e. air temperature (contour lines), relative humidity (background), and wind speed (in knots) and direction (graphical symbols), and f. vertical velocity, at 4 UTC (10.02.2019). Spatial-temporal patterns of PM10 concentrations on 9/10.02.2019 (g). Location of station in Krasińskiego St (reference point at ) and cross section S-N presented at on a topographic map, from the AROME model (h).
Key: reference point with distance 0 in and f: Krasińskiego St; the red and blue colour scales at cross section of vertical velocity at indicates upward and downward movements, respectively; blue background in foehn period; green dashed line in occurrence of altocumulus lenticularis cloud.
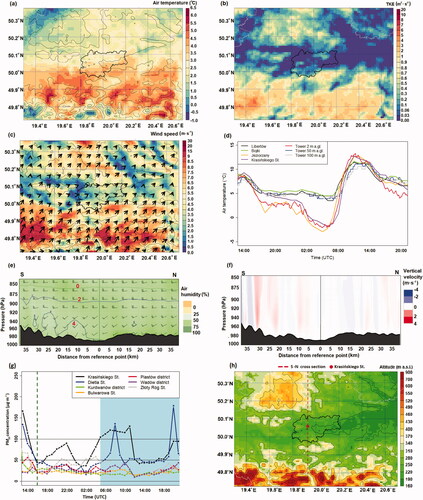
Later, from 9 to 11 UTC, the western part of the valley was sheltered by the upland areas to the north, as shown in , for 30 m and 110 m a.g.l. levels. A large wind speed difference can be seen between the western and eastern parts of the valley, accompanied by similar differences in TKE. Towards the south and south-west of Balice meteorological station (red point on ), strong ridge-parallel up-draughts downstream of the relief can be observed with S-N and SW-NE cross sections of vertical velocity (25-30km from reference point) which were identified as hydraulic jumps (marked by HJ on ). Spatial patterns of air temperature, relative humidity and wind components on the S-N and SW-NE cross sections () indicate significant fluctuations in the region of the hydraulic jump. Its occurrence resulted in the weakening of the wind in the valley and strong wind shear above the valley marked by a horizontal red line (). The spatial map of vertical velocity at 800 m a.g.l (), with arrows presenting horizontal wind at this altitude, shows the location of strong up-draughts with blue circles marking places of hydraulic jumps visible in S-N and SW-NE cross sections. The results of a numerical simulation of a real case study (Elvidge et al. Citation2016) and under idealized conditions (Sheridan and Vosper Citation2005) coincided with these observations.
Fig. 10. Spatial patterns of wind speed and direction a. at 30 m a.g.l. and c. 110 m a.g.l.; turbulent kinetic energy parameter (TKE) at b. 30 m a.g.l. and d. 110 m a.g.l. at 11 UTC on 10.2.2019.
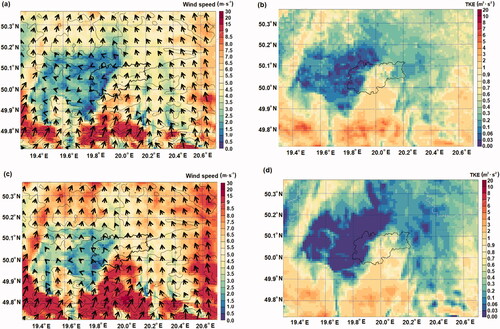
Fig. 11. Spatial pattern of a. air temperature (contour lines), relative humidity (background) and wind speed (in knots) and direction (graphical symbols) in the S-N cross section through Kraków and nearby, and c. vertical velocity at 11 UTC on 10.02.2019; SW-NE cross section of b. air temperature (contour lines), relative humidity (background) and wind speed (in knots) and direction (graphical symbols), and d. vertical velocity at 11 UTC (10.02.2019). Spatial map of vertical velocity at 800 m a.g.l. with arrows presenting horizontal wind at this altitude (e). Blue circles in present location of hydraulic jumps identified at S-N and SW-NE cross sections (). Location of Balice station (reference point in ) and cross sections presented in at topographic map, from the AROME model (f). Spatial-temporal patterns of PM10 concentrations on 10.02.2019 (g).
Key: reference point with distance 0 in : Balice; the red and blue colour scales at cross section of vertical velocity in indicates upward and downward movements, respectively; blue background in foehn period.
4.4. Pattern 4: long-term periods of high PM10 concentration at all measurement points
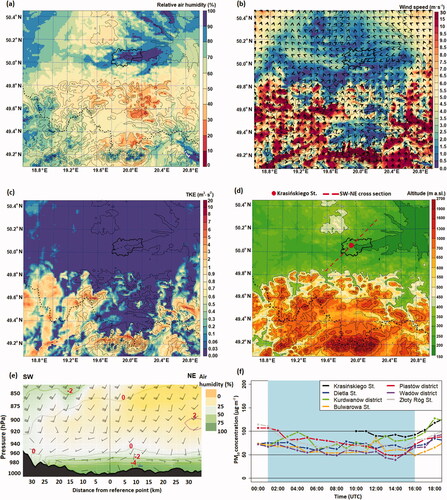
In the case of Pattern 4, the mechanisms responsible for long-lasting high PM10 concentrations are similar to Pattern 1, but their duration is longer. An example of such a situation was presented by data from 20.12.2018 (). The decisive factor is the sheltering effect, i.e. warm air streams generated by the foehn flow above the valley which runs W-E, and that shelters a much cooler and stable air layer, often with fog, and increases the air temperature inversion (). The situation can persist even during daytime. Within the valley, wind speed is close to zero and so is turbulence which reduces available mixing volume and traps emitted pollutants, while in the areas located above the values are much higher (Pattern 1, ; ).
Fig. 12. Spatial pattern of relative air humidity (a), wind speed and direction (b) and turbulence kinetic energy at 110 m a.g.l. (c), topographic map of this terrain (d) and cross section of air temperature (temperature isolines), relative humidity (background) and wind (in knots) (e) for station Krasińskiego St at 6 UTC (20.12.2018). Spatial-temporal patterns of PM10 concentrations on 20.12.2018 (f).
Key: blue background in foehn period.
This situation can also be observed in other mountainous areas, and the determination of the factors influencing foehn intrusion into a valley is not simple. For example, studies on foehns in the Dead Sea valley using a high resolution WRF model (Kunin et al. Citation2019) point out that foehn intrusion depends on synoptic and mesoscale conditions which affect the vertical structure of the lower troposphere generating different heights of stable layers. During a high stable layer over the Dead Sea Valley, the foehn reached the valley floor, while during a low stable layer, it did not. On the other hand, studies of valley CAPs presented by Sheridan (Citation2019) point out that for valleys whose depth exceeds that of the nocturnal stable boundary layer, processes related to daytime insolation may be not strong enough to break the CAP. Persistent CAPs in deep basins represent a combination of a stable boundary layer near the surface (at night), residual stability at the top of the nocturnal stable layer which is not much eroded during the day, and any stability above this is due to air mass stratification.
5. Discussion
A foehn blowing from the Carpathian Mountains, can significantly modify the UBL in the areas it reaches, which in turn has a significant impact on air pollution dispersion conditions and pollution levels in ambient air. The main mechanisms involved in that process, and known from other mountain areas, are:
Intensification of air temperature inversion and the CAP, and reduction in the available air volume for mixing pollutants (e.g. Li X. et al., 2015; Drechsel and Mayr Citation2008);
Occurrence of gravity waves (Zängl Citation2003), hydraulic jump (Gohm and Mayr Citation2004; Kishcha et al. Citation2017), trapped lee waves (Nance and Durran Citation1998) or shear-induced gravity waves which occur at the top of CAPs (Richner and Hächler Citation2013);
Intrusion of foehns into a valley and mixing local air parcels into a larger volume (Drechsel and Mayr Citation2008).
Research on the intra-urban spatial variability of PM is not very common (e.g. Moore et al. Citation2009; Vicente et al. Citation2018), and the impact of a foehn on intra-urban air quality has been studied in detail even less (e.g. Li X. et al., 2015). An important aspect of the present work is to evaluate the role of a foehn in the modification of PM10 dispersion conditions in relation to other factors which regularly impact UBL in Kraków. On the one hand, as already mentioned, the allowed mean daily level of PM10 (i.e. 50 µg⋅m−3) was exceeded at one measurement point in Kraków at least on 57% of days in the study period, and a foehn occurred on only 12% of those days, but on the other hand, the allowed limit was exceeded on 69% of days with a foehn. In the case of mean hourly PM10 concentrations, values ≥50 µg⋅m−3 for all days of the study period constitute from 50.2% to 23.6%, and there is no spatial order in their distribution, while on days with a foehn, a clear difference can be seen between the western part of the valley (represented by Krasińskiego St, Dietla St and Złoty Róg St) and the eastern one. In the western part, the share of time with PM10 concentrations above 50 µg⋅m−3 is from 33.1% to 52.9% while in other points it reaches from 19.2% to 28.7%. Therefore, the foehn can be considered an important factor which contributes both to an increase in PM10 concentration in Kraków, and to its large spatial variability. However, that impact has a different background than for instance in the case of the Santa Ana (Álvarez and Noel Carbajal Citation2019) which shows the importance of local conditions for the evaluation of foehn impacts on air quality.
In the case of Kraków, the main factor which modifies weather conditions at a local scale is the relief, as described in Section 2. That factor is decisive for the interactions between the foehn and UBL too. The city is located in a valley which is generally perpendicular to southerly winds, it is much wider in the eastern than in the western part, and during the cold half year stable atmospheric conditions occur in the UBL most of the time. The foehn can either blow above the valley or enter it in various modes. As shown in Section 4, it can either worsen or improve air pollution dispersion conditions, and increase or decrease PM10 levels, but it also contributes to large differences in PM10 concentrations within the city. The mode of interaction depends to a large extent on the exact direction from which the foehn reaches the city, which is an effect of general circulation conditions; SE winds have a much larger potential to enter the valley.
The mechanisms of interaction between the UBL and a foehn described in Section 4 were modified by local-scale processes. As shown for Urumqi (Li X. et al. 2015) or for Dead Sea valley (Vüllers et al. Citation2018), the impact of foehns on the UBL and on air pollution depends strongly on its modification by local relief which further suggests that it is possible to construct conceptual models concerning its impact on spatial patterns of urban air pollution but for a certain type of city location only. In the case of Kraków, such a model consists of the following elements:
The foehn from the Tatra Moutains is often strong enough to reach the area of the city of Kraków. It can affect air pollution dispersion conditions in the city and contribute both to a sudden and a large decrease or increase of PM10 levels all over the city, or to the occurrence of PM10 peaks in the western part of the city only, or to long-lasting high PM10 levels throughout the city. The occurrence of a particular effect depends on the mode of foehn transfer through the area of the city and nearby.
The following transfer modes were identified: a. the foehn flows above the valley where a strong CAP and return flow can be found; b. the foehn enters the valley from the east or from the valley top and destroys the CAP; c. gravity waves generated by the foehn are strong enough to enter the western, narrower part of the valley and cause large spatial differences in turbulence parameters within the city.
The first transfer mode worsens air pollution dispersion conditions for the whole city and leads to large increases in PM10 levels, the second transfer mode improves the dispersion conditions and leads to large decreases in PM10 levels throughout whole city, and the third mode generates large spatial differences in PM10 levels within the city.
6. Conclusions
Analysis of PM10 concentration changes in Kraków during foehn episodes showed that there is no single effect on air pollution dispersion conditions. Several mechanisms of foehn impact on the UBL were identified and a conceptual model of the foehn effect on PM10 spatial pattern was formulated. The model might be useful in research on other cities located in similar relief conditions to Kraków, i.e. in large valleys located at the foothills of mountain ranges with a special focus on those perpendicular to the foehn direction. An important issue is valley width; in the western narrower part of the valley, the PM10 levels are higher than in the wider eastern part. This is due to limited natural ventilation and the katabatic flows which intensify the CAP. The latter factor shows that the mechanisms of foehn impact on the UBL and air pollution dispersion conditions, well known from research in various mountain areas, might be significantly modified by specific local-scale processes.
The present study is an attempt at a climatological approach to the issue of foehn impact on UBL properties, air pollution dispersion conditions and intra-urban PM10 patterns, in spite of the limited research period length. The four patterns of PM10 spatial-temporal changes, described in Section 4, were defined by analysis of several cases for each pattern and accompanying processes. These analyses were possible due to the combination of observational and model data, including long-term mesoclimatic measurements. Such an approach allows results to be obtained which are useful for municipal management including spatial planning and air protection policy. As urban air pollution is a problem for many cities, a better understanding of the various mechanisms controlling UBL features and air pollution dispersion is needed.
Disclosure statement
The authors declare that they have no conflict of interest.
References
- Álvarez, C. A. and Noel Carbajal, N. 2019. Regions of influence and environmental effects of Santa Ana wind event. Air Qual. Atmos. Health12, 1019–1034. doi:https://doi.org/10.1007/s11869-019-00719-3
- Bénard, P., Vivoda, J., MašEk, J., Smolíková, P., Yessad, K. and co-authors. 2010. Dynamical kernel of the Aladin-NH spectral limited-area model: Revised formulation and sensitivity experiments. Q. J. R. Meteorol. Soc. 136, 155–169. https://rmets.onlinelibrary.wiley.com/doi/abs/10.1002/qj.522. doi:https://doi.org/10.1002/qj.522
- Bokwa, A. 2011. Influence of air temperature inversions on the air pollution dispersion conditions in Krakow. Prace Geogr. IGiGP UJ 126, 41–51. http://www.pg.geo.uj.edu.pl/documents/3189230/4482219/2011_126_41-51.pdf/3a9b98f7-8324-48de-a772-aba57ac3aae2.
- Bokwa, A. 2007. Zanieczyszczenie powietrza [Air pollution]. In: Klimat Krakowa w XX wieku [Climate of Kraków in the 20th century] (ed. D. Matuszko). Institute of Geography and Spatial Management, Jagiellonian University, Kraków, Poland, pp. 187–199.
- Bokwa, A. 2008. Environmental impacts of long-term air pollution changes in Kraków, Poland. Pol. J. Envir. Stud. 17, 673–686. http://www.pjoes.com/Issue-5-2008,3821.
- Bougeault, P. and Lacarrere, P. 1989. Parameterization of orography induced turbulence in a meso-beta-scale model. Mon. Wea. Rev. 117, 1872–1888. https://journals.ametsoc.org/doi/abs/10.1175/1520-0493%281989%29117%3C1872%3APOOITI%3E2.0.CO%3B2. doi:https://doi.org/10.1175/1520-0493(1989)117<1872:POOITI>2.0.CO;2
- Brinkmann, W. A. R. 1971. What is a foehn? Weather 26, 230–239. doi:https://doi.org/10.1002/j.1477-8696.1971.tb04200.x
- Burnett, R. T., Pope, C. A., Ezzati, M., Olives, C., Lim, S. S. and co-authors. 2014. An integrated risk function for estimating the global burden of disease attributable to ambient fine particulate matter exposure. Environ. Health Perspect. 122, 397–403. doi:https://doi.org/10.1289/ehp.1307049
- Cetti, C., Buzzi, B., and Sprenger, M. 2015. Climatology of Alpine north foehn. Sci. Rep. MeteoSwiss 100, 76.
- Corsmeier, U., Kossmann, M., Kalthoff, N. and Sturman, A. 2006. Temporal evolution of winter smog within a nocturnal boundary layer at Christchurch. Meteorol. Atmos. Phys. 91, 129–148. doi:https://doi.org/10.1007/s00703-005-0111-5
- Cuxart, J., Bougeault, P. and Redelsperger, J.-L. 2000. A turbulence scheme allowing for mesoscale and large-eddy simulations. QJ. Royal Met. Soc. 126, 1–30. https://rmets.onlinelibrary.wiley.com/doi/10.1002/qj.49712656202.
- Drechsel, S. and Mayr, G. J. 2008. Objective Forecasting of Foehn Winds for a Subgrid-Scale Alpine Valley. Weather Forecast. 23, 205–218. doi:https://doi.org/10.1175/2007WAF2006021.1
- Drobinski, P., Steinacker, R., Richner, H., Baumann-Stanzer, K., Beffrey, G. and co-authors. 2007. Föhn in the Rhine Valley during MAP: A review of its multiscale dynamics in complex valley geometry. Q. J. R. Meteorol. Soc. 133, 897–916. doi:https://doi.org/10.1002/qj.70
- Elvidge, A. D., Renfrew, I. A., King, J. C., Orr, A. and Lachlan-Cope, T. A. 2016. Foehn warming distributions in nonlinear and linear flow regimes: a focus on the Antarctic Peninsula. Q. J. R. Meteorol. Soc. 142, 618–631. doi:https://doi.org/10.1002/qj.2489
- European Environment Agency. (2018). Air quality in Europe — 2018 report. European Environment Agency, Luxembourg, Publications Office of the European Union, http://www.eea.europa.eu/publications/air-quality-in-europe-2018.
- Flamant, C., Drobinski, P., Furger, M., Chimani, B., Tschannett, S. and co-authors. 2006. Föohn/cold-pool interactions in the Rhine valley during MAP IOP 15. Q. J. R. Meteorol. Soc. 132, 3035–3058. doi:https://doi.org/10.1256/qj.06.36
- Gohm, A. and Mayr, G. J. 2004. Hydraulic aspects of fohn winds in an Alpine valley. Q J. R Meteorol. Soc. 130, 449–480. doi:https://doi.org/10.1256/qj.03.28
- Hajto, M. and Rozwoda, W. 2010. Wykorzystanie danych sodarowych do oceny warunków rozprzestrzeniania się zanieczyszczeń w warstwie granicznej atmosfery w Krakowie [Application of sodar data for evaluation of air pollution dispersion conditions in the boundary layer in Kraków]. In: Ochrona powietrza w teorii i praktyce [Air Protection in Theory and Practice], Vol. 2, Instytut Podstaw Inżynierii Środowiska Polskiej Akademii Nauk [Institute of Environmental Engineering, Polish Academy of Sciences], Zabrze, Poland, pp. 81–92.
- Hann, J. 1901., Lehrbuch der Meteorologie (1st ed.), Verlag C. H. Tauchnitz, Leipzig, 805 pp.
- Hess, M. 1974. Klimat Krakowa [Climate of Kraków]. Folia Geogr. Ser. Geogr. Phys. 8, 45–102.
- Hoinka, K. P. 2007. Observation of the airflow over the Alps during a foehn event. Qjr. Meteorol. Soc. 111, 199–224. doi:https://doi.org/10.1002/qj.49711146709
- Kishcha, P., Starobinets, B. and Alpert, P. 2017. Modelling of foehn-induced extreme local dust pollution in the Dead Sea valley. In: Air Pollution Modeling and Its Applications XXV (eds. C. Mensink and G. Kallos). Springer Proceedings in Complexity, Springer, Cham, pp. 433–437. doi:https://doi.org/10.1007/978-3-319-57645-9_68.
- Kunin, P., Alpert, P. and Rostkier-Edelstein, D. 2019. Investigation of sea-breeze/foehn in the Dead Sea valley employing high resolution WRF and observations. Atmos. Res. 229, 240–254. doi:https://doi.org/10.1016/j.atmosres.2019.06.012
- Largeron, Y. and Staquet, C. 2016. Persistent inversion dynamics and wintertime PM10 air pollution in Alpine valleys. Atmos. Environ. 135, 92–108. doi:https://doi.org/10.1016/j.atmosenv.2016.03.045
- Li, X., Xia, X., Wang, L., Cai, R., Zhao, L. and co-authors. 2015. The role of foehn in the formation of heavy air pollution events in Urumqi, China. J. Geophys. Res. Atmos. 120, 5371–5384. doi:https://doi.org/10.1002/2014JD022778
- Li, Y., Chen, Q., Zhao, H., Wang, L. and Tao, R. 2015. Variations in PM10, PM2.5 and PM1.0 in an urban area of the Sichuan basin and their relation to meteorological factors. Atmosphere 6, 150–163. doi:https://doi.org/10.3390/atmos6010150
- Liu, L., Zhang, Z., Zhong, J., Wang, J. and Yang, Y. 2019. The ‘two-way feedback mechanism’ between unfavorable meteorological conditions and cumulative PM2.5 mass existing in polluted areas south of Beijing. Atmos. Environ. 208, 1–9. doi:https://doi.org/10.1016/j.atmosenv.2019.02.050
- Masson, V., Le Moigne, P., Martin, E., Faroux, S., Alias, A. and co-authors. 2013. The SURFEXv7.2 land and ocean surface platform for coupled or offline simulation of earth surface variables and fluxes. Geosci. Model Dev. 6, 929–960. doi:https://doi.org/10.5194/gmd-6-929-2013
- Mira-Salama, D., Van Dingenen, R., Gruening, C., Putaud, J.-P., Cavalli, F. and co-authors. 2008. Using Föhn Conditions to Characterize Urban and Regional Sources of Particles. Atmos. Res 90, 159–169. doi:https://doi.org/10.1016/j.atmosres.2008.02.007
- Moore, K., Krudysz, M., Pakbin, P., Hudda, N. and Sioutas, C. 2009. Intra-Community Variability in total particle number concentrations in the San Pedro Harbor area (Los Angeles, California). Aerosol Sci. Technol. 43, 587–603. doi:https://doi.org/10.1080/02786820902800900
- Muñoz, R. C. and Corral, M. J. 2017. Surface Indices of wind, stability, and turbulence at a highly polluted urban site in Santiago, Chile, and their relationship with nocturnal particulate matter concentrations. Aerosol Air Qual. Res. 17, 2780–2790. doi:https://doi.org/10.4209/aaqr.2017.05.0190
- Nance, L. B. and Durran, D. R. 1998. A modeling study of nonstationary trapped mountain lee waves. Part II Nonlinearity. J. Atmos. Sci 55, 1429–1445., 1998.
- Niedźwiedź, T. and Olecki, Z. 1994. Wpływ sytuacji synoptycznych na zanieczyszczenie powietrza w Krakowie. Zesz. Nauk UJ, Pr. Geogr 96, 55–68. [Impact of synoptic situations on air pollution in Kraków].
- Niedźwiedź, T. and Olecki, Z. 1995. The variability of air pollution in Cracow. In: Klimat i bioklimat miast [Urban Climate and Bioclimate] (ed. K. Kłysik). Publishing House of the University of Łódź, Łódź, pp. 205−212.
- Pergaud, J., Masson, V., Malardel, S. and Couvreux, F. 2009. A parameterization of dry thermals and shallow cumuli for mesoscale numerical weather prediction. Boundary-Layer Meteorol. 132, 83–106. doi:https://doi.org/10.1007/s10546-009-9388-0
- Prtenjak, M. T., Jericevic, A., Kraljevic, L., Bulic, I. H., Nitis, T. and co-authors. 2009. Exploring atmospheric boundary layer characteristics in a severe SO2 episode in the north-eastern Adriatic. Atmos. Chem. Phys. 9, 4467–4483. doi:https://doi.org/10.5194/acp-9-4467-2009
- Richner, H. and Hächler, P. 2013. Understanding and forecasting alpine foehn. In: Mountain Weather Research and Forecasting (eds. F. Chow, S. De Wekker, and B. Snyder). Springer Atmospheric Sciences. Springer, Dordrecht.
- Seibert, P. 1990. South fohn studies since the ALPEX experiment. Meteorl. Atmos. Phys. 43, 91–103. doi:https://doi.org/10.1007/BF01028112
- Seinfeld, J. H. and Pandis, S. N. 1998. Atmospheric Chemistry and Physics: From Air Pollution to Climate Change. John Wiley and Sons, New York, NY, USA.
- Sheridan, P. F. 2019. Synoptic-flow interaction with valley cold-air pools and effects on cold-air pool persistence: Influence of valley size and atmospheric stability. Q. J. R. Meteorol. Soc. 145, 1636–1659. doi:https://doi.org/10.1002/qj.3517
- Sheridan, P. F. and Vosper, S. B. 2005. Numerical simulations of rotors, hydraulic jumps and eddy shedding in the Falkland Islands. Atmos. Sci. Lett. 6, 211–218. doi:https://doi.org/10.1002/asl.118
- Statistical Yearbook of Kraków. 2019. Statistical Office in Kraków. http://krakow.stat.gov.pl.
- Termonia, P., Fischer, C., Bazile, E., Bouyssel, F., Brožková, R. and co-authors. 2018. The ALADIN System and its Canonical Model Configurations AROME CY41T1 and ALARO CY40T1. Geosci. Model Dev. 11, 257–281. doi:https://doi.org/10.5194/gmd-11-257-2018
- Tomaszewska, A. M. 1994. Zależność stężeń zanieczyszczeń atmosfery w Krakowie od wybranych elementów meteorologicznych w okresie grzewczym 1992/1993 [Dependence of air pollution concentration in Kraków from selected meteorological elements in the heating season 1992/1993]. Wiad. IMGW 3, 5–17.
- Toro A, R., Kvakić, M., Klaić, Z. B., Koračin, D., Morales S, R. G. E. and co-authors. 2019. Exploring atmospheric stagnation during a severe particulate matter air pollution episode over complex terrain in Santiago, Chile. Environ. Pollut. 244, 705–714. doi:https://doi.org/10.1016/j.envpol.2018.10.067
- Turton, J. V., Kirchgaessner, A., Ross, A. N. and King, J. C. 2018. The spatial distribution and temporal variability of föhn winds over the Larsen C Ice Shelf Antarctica Quarterly. Q. J. R. Meteorol. Soc. 144, 1169–1178. doi:https://doi.org/10.1002/qj.3284
- Ustrnul, Z. 1992a. Potencjalne warunki występowania wiatrów fenowych w Karpatach Polskich (Potential conditions of foehn effects in the Polish Carpathians). Zeszyty Naukowe UJ, Prace Geograficzne 90, 97–112.
- Ustrnul, Z. 1992b. Influence of foehn winds on air temperature and humidity in the Polish Carpathians. Theor. Appl. Climatol. 45, 43–47. doi:https://doi.org/10.1007/BF00865992
- Vergeiner, J. 2004. South foehn studies and a new foehn classification scheme in the Wipp and Inn valley, Ph.D. thesis, Univ. of Innsbruck, Austria.
- Vicente, A. B., Juan, P., Meseguer, S., Díaz-Avalos, C. and Serra, L. 2018. Variability of PM10 in industrialized-urban areas. New coefficients to establish significant differences between sampling points. Environ. Pollut. 234, 969–978. doi:https://doi.org/10.1016/j.envpol.2017.12.026
- Vüllers, J., Mayr, G. J., Corsmeier, U. and Kottmeier, C. 2018. Characteristics and evolution of diurnal foehn events in the Dead Sea valley. Atmos. Chem. Phys. 18, 18169–18186. doi:https://doi.org/10.5194/acp-18-18169-2018
- Walczewski, J., Heryan, A. and Krokowski, J. A. 1996. Monitoring powietrza i wody w Krakowie jako narzędzie ochrony zdrowia mieszkańców [Air and water monitoring in Kraków as a tool of the inhabitans’ health protection]. Folia Geogr. Ser. Geogr. Phys. 26 − 27, 159–171.
- Wang, C., Wang, C., Myint, S. and Wang, Z. 2017. Landscape determinants of spatio-temporal patterns of aerosol optical depth in the two most polluted metropolitans in the United States. Sci Total Environ. 609, 1556–1565. doi:https://doi.org/10.1016/j.scitotenv.2017.07.273
- WHO. 2016. WHO: Ambient Air Pollution: A global assessment of exposure and burden for disease 2016. WHO, Geneva. https://apps.who.int/iris/bitstream/handle/10665/250141/9789241511353-eng.pdf?sequence=1.
- Zängl, G. 2003. Deep and shallow south foehn in the region of Innsbruck: Typical features and semi-idealized numerical simulations. Meteorol. Atmos. Phys. 83, 237–261. doi:https://doi.org/10.1007/s00703-002-0565-7
Appendix 1. Wind rose at two Sub-periods for (a) Balice, (b) Igołomia, (c) Libertów and (d) Reymonta St
Appendix 2. List of foehn wind episodes studied
Appendix 3. Number of days with mean daily PM concentrations ≥ 50, 100, 150 and 200 µg⋅m-3 at measurement points in Kraków in the study periods (two cold seasons)
Appendix 4. Height of the lowest 87 vertical levels (v.l.) from the model up to 3 km of altitude, used in forecast
Appendix 5. Physical processes’ schemes used in AROME CMC 1-km model
Appendix 6. Orographic map of the AROME model domain with 1km x 1km grid spacing
Appendix 7. Verification of the AROME model forecast with data from meteorological stations: a) RMSE value; b) BIAS value
Appendix 8. Accuracy of the AROME forecast (%) in comparison with data from meteorological stations
Appendix 9. Comparison of wind roses obtained from model forecast and measurements for Balice (i.e. a station on the valley bottom; a), and Libertów (i.e. a station on a hilltop; b)
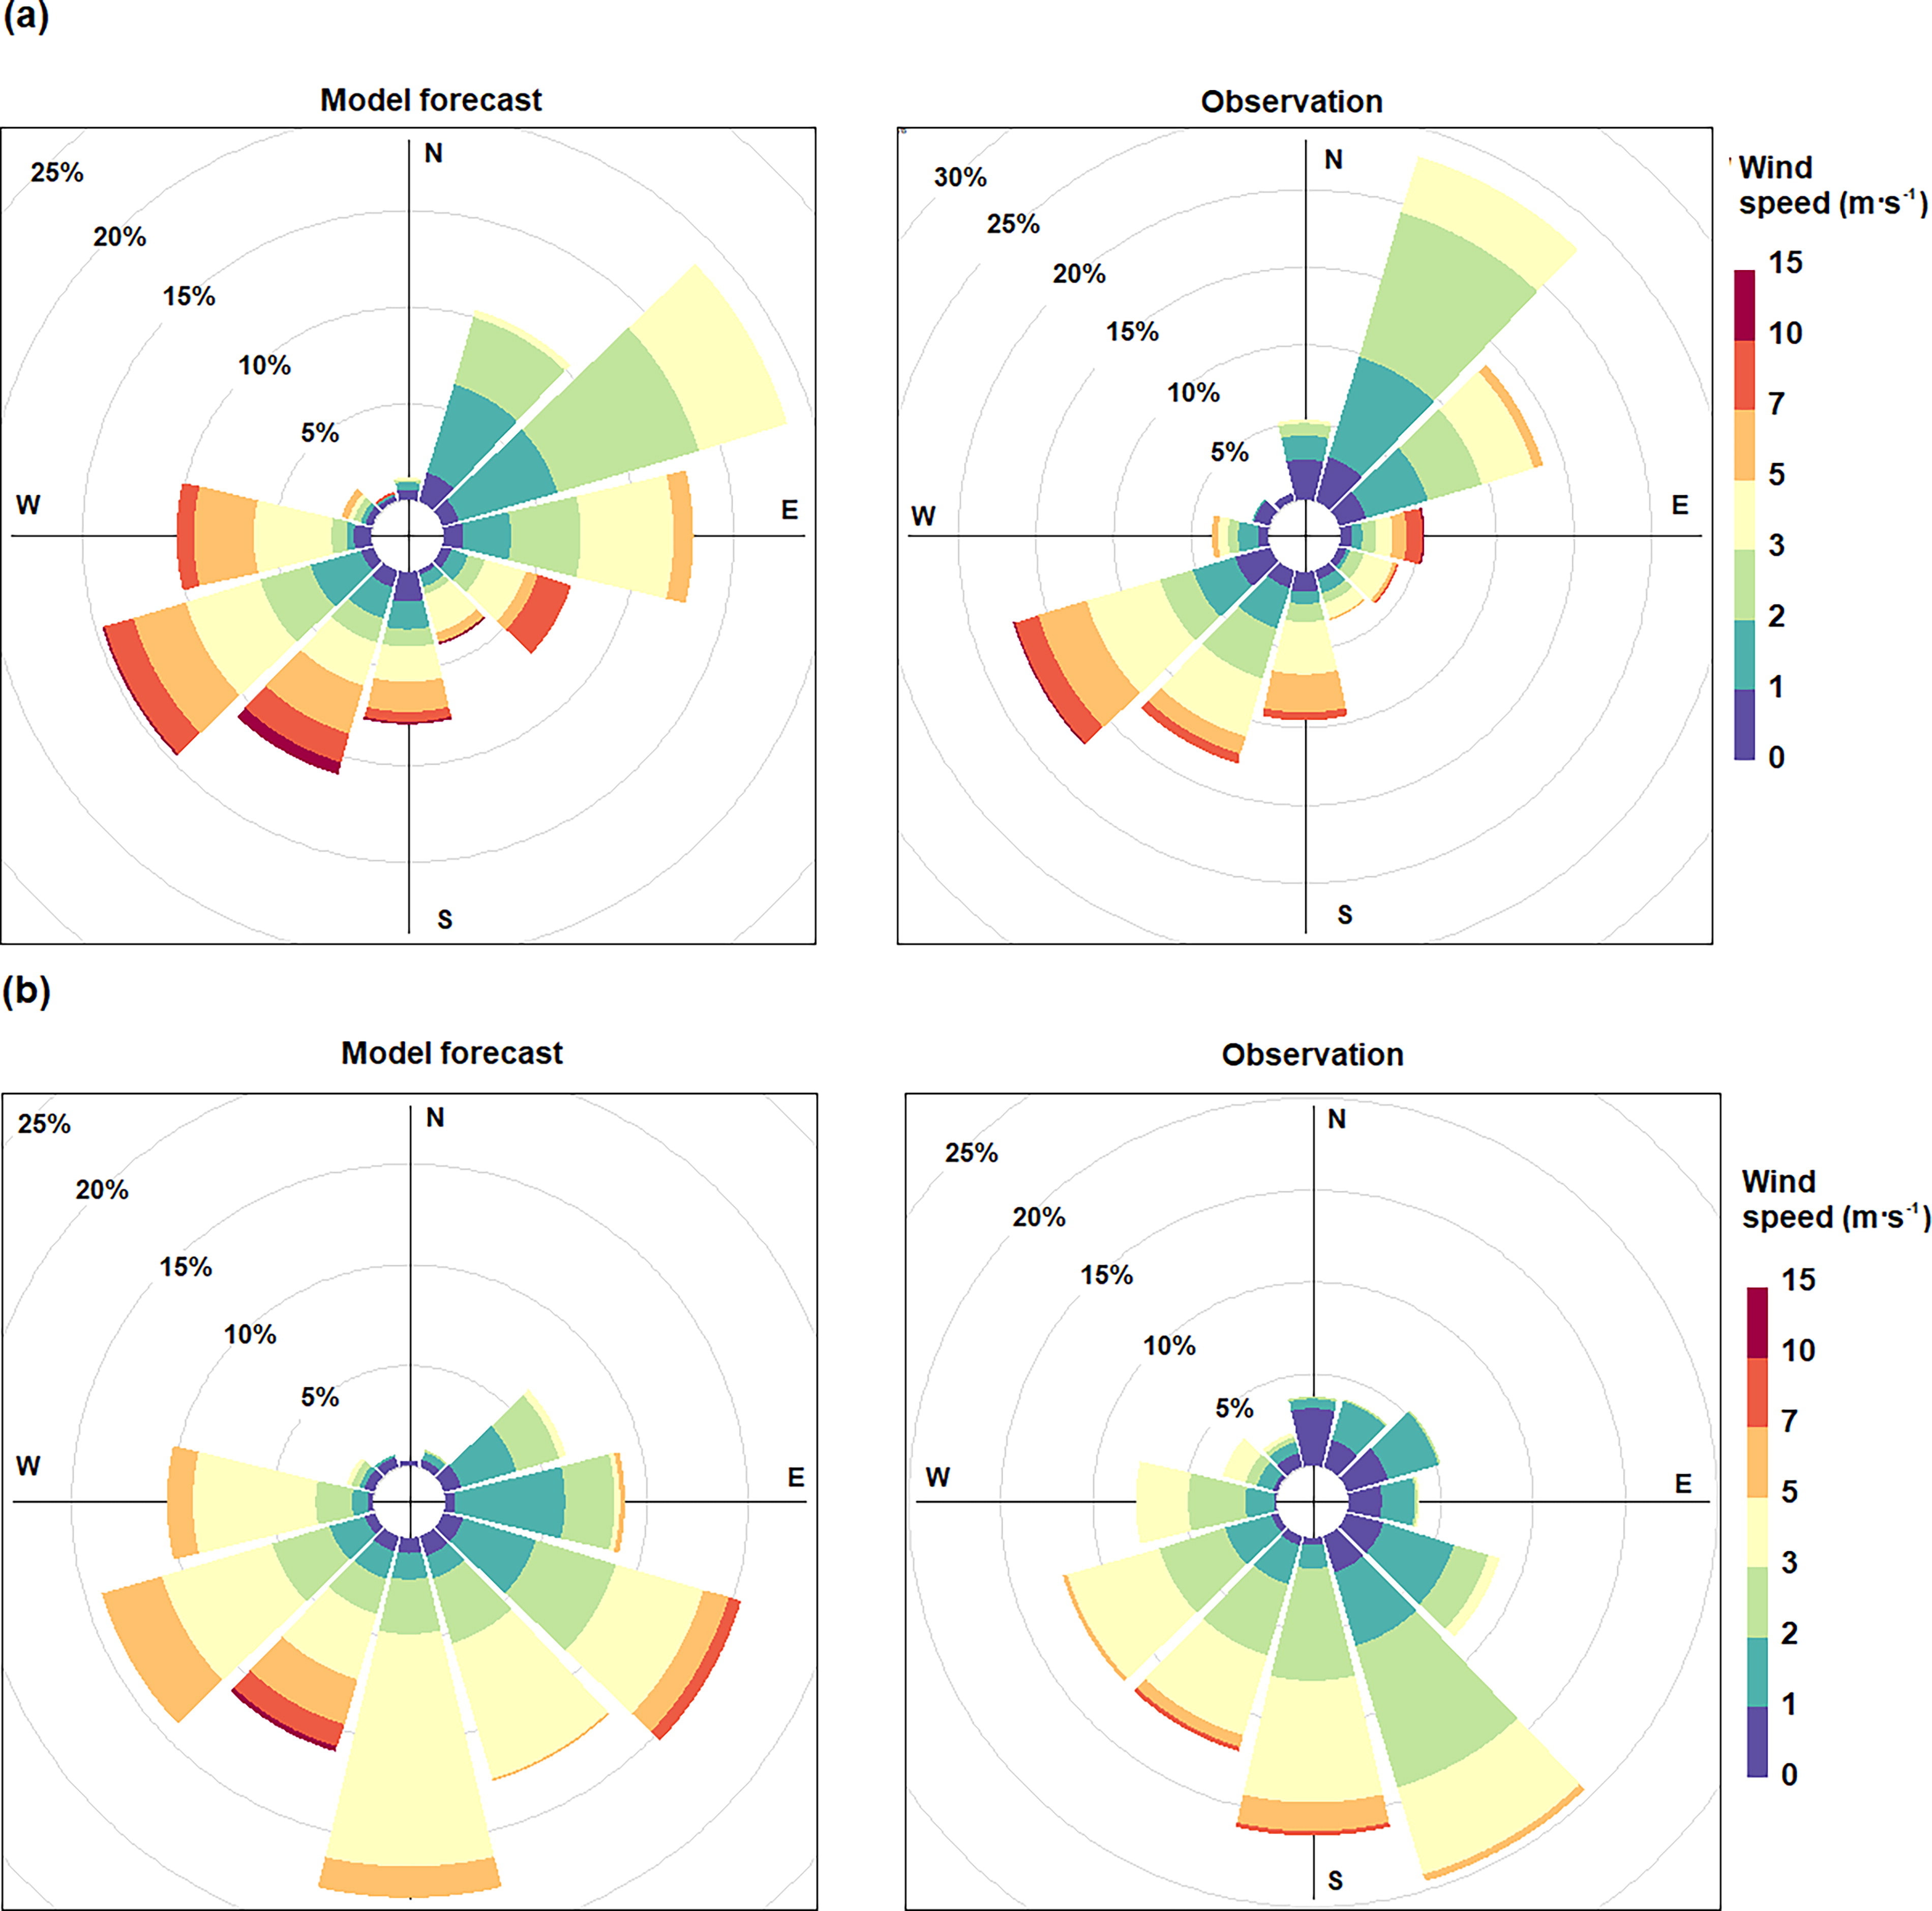
Table 1. Location of meteorological stations in Kraków and nearby, Kasprowy Wierch and the meteorological elements used in the research.