
 ?Mathematical formulae have been encoded as MathML and are displayed in this HTML version using MathJax in order to improve their display. Uncheck the box to turn MathJax off. This feature requires Javascript. Click on a formula to zoom.
Abstract
Background: Theoretical models of addiction predict that an attentional bias toward substance-related cues plays a role in development and maintenance of addictive behaviors, although empirical data testing these predictions are somewhat equivocal. This may in part be a consequence of substantial variability in methods used to operationalize attentional bias. Our aim was to examine the variability in key design and analysis decisions of the addiction Stroop.
Method: Using a pre-registered design, we identified 95 studies utilizing an addiction Stroop (46 alcohol, 25 smoking, 24 drug-related). We extracted key information about the design of the Stroop tasks, including; administration (paper-and-pencil vs. computerized), response (key-press vs. voice), design (block vs. mixed). For analysis decisions we extracted information on upper- and lower-bound reaction time cutoffs, removal of data based on standard error cutoffs, removal of participants based on overall performance, type of outcome used, and removal of errors.
Results: Based on variability from previous research there are at least 1,451,520 different possible designs of the computerized Alcohol Stroop, 77,760 designs of the computerized Smoking Stroop and 112,640 for the Drug Stroop. Many key design decisions were unreported. Similarly, variability in analyses decisions would allow for 9,000 different methods for analyzing the Alcohol Stroop, 5,376 for the Smoking Stroop and 768 for the Drug Stroop. P-curves suggest data provided evidential value and exploratory meta-regressions suggest that the addiction Stroop effect was not associated with design and analysis decisions.
Conclusions: The addiction Stroop effect is seemingly robust, however the adoption of consistent reporting guidelines is necessary to aid reliability and reproducibility.
Introduction
Attentional bias refers to the tendency of specific types of stimuli, such as alcohol- and smoking-related cues, to capture, hold and make it difficult to disengage attention from (Field et al. Citation2016). Theoretical models of addiction predict that this selective and sustained attention toward drug-related cues is associated with craving and can play a potentially causal role in the development and maintenance of substance (mis)use (Field et al. Citation2014; Robbins and Ehrman Citation2016). Empirical evidence has demonstrated some support for these claims. In a seminal meta-analytic investigation Field, Duka, et al. (Citation2009) demonstrated a robust, albeit small (r = .19 [95% CI: .15 − .23]), correlation between various indices of attentional bias and craving. Experimental manipulations of attentional bias have had a causal influence on alcohol consumed in the lab (Field and Eastwood Citation2005; Fadardi and Cox Citation2009), although see (Field, Duka, et al. Citation2009)), which has led to the development of psychological interventions to reduce alcohol- and tobacco-seeking in the ‘real-world’(Kerst and Waters Citation2014). Whilst many researchers see promise in measuring and targeting these biases (Wiers et al. Citation2013), others have suggested poor methodology and lack of convincing evidence should reduce enthusiasm for most published findings (Christiansen et al. Citation2015; Cristea et al. Citation2016).
In order to accurately test the hypotheses made by incentive-motivational models of addiction, specifically that attentional bias to substance-related cues is present in substance users and associated with substance-related outcomes, attentional biases need to be operationalized. Various computerized tasks have been designed to isolate and measure attention (both indirectly, through reaction times, and directly using eye-tracking), such as the Visual Probe (MacLeod et al. Citation1986) and attentional blink paradigms (Shapiro et al. Citation1997) - interested readers can read a comprehensive review on measurement of attention biases here (Field and Cox Citation2008). However, one of the most widely used measures is the ‘addiction’ Stroop, which is a variation of the original Stroop task. The original Stroop task was designed to measure the inhibition of cognitive interference (Stroop Citation1935). Participants are shown a list of color-words (e.g. ‘RED’, ‘BLUE’, ‘GREEN’) printed in different colors, and participants are asked to name the color in which the word is printed in, whilst ignoring the content of the word. There are two types of trials; congruent trials in which the word is presented in its corresponding color (e.g. the word ‘RED’ printed in red ink), and incongruent trials in which the word is presented in a different color to its content (e.g. the word ‘RED’ printed in blue ink). Participants should be faster and make fewer errors on congruent trials compared to incongruent trials, and numerous studies have demonstrated the robustness of this effect across a variety of populations including; healthy controls, children, Attention Deficit Hyperactivity Disorder, depression and so on (Verhaeghen and De Meersman Citation1998; Mourik et al. Citation2005).
The ‘addiction’ Stroop is an emotional Stroop variation, in which the emotional content of the words causes interference (through grabbing attention). Similar designs using relevant words have been used to a examine a range of attentional biases, such as safety-related words in the work place (Xu et al. Citation2014), and trauma-related words in war veterans with Post Traumatic Stress Disorder (Ashley et al. Citation2013). The ‘addiction’ Stroop replaces the standard color words with alcohol/drug-related words and a comparison category (e.g. neutral words within a semantic category such as household or musical). Similarly, images rather than words can be used, where an image will have a colored hue or background (pictorial Stroop). In these versions if participants are slower to name the color in which alcohol/drug-related words/images are printed compared to neutral/comparison-words, this is interpreted as the content or meaning of the alcohol/drug-related word/image ‘grabbing’ the attention making it more difficult to identify the color, than the control/comparison words. Using this task (or a variation), various studies have demonstrated an ‘attentional bias’ in heavy drinkers (Field et al. Citation2007), alcohol dependent patients (Lusher et al. Citation2004), as well as smokers (Cane et al. Citation2009) and illicit drug users (Marissen et al. Citation2006). However, there are ‘null’ results for the Stroop effect present throughout the literature (Franken et al. Citation2004; Asmaro et al. Citation2014), which may suggest any effect is not robust.
It is likely that the perceived simplicity of the design has led to widespread adoption of the ‘addiction’ Stroop as a measure of attentional bias, as it can be delivered in various settings with minimal/no programming experience (using only some paper and a stopwatch). However, subtle methodological differences in the design of the task may lead to widely different performance outcomes. A meta-analysis demonstrated the effect-sizes in alcohol-related Stroop tasks were moderated by a number of methodological variables (Cox et al. Citation2006). The number of word controls (i.e. semantic relatedness, word frequency, and word length), the use of paper-and-pencil (vs. computerized), vocal responses vs. button presses, and combined responses, were significantly, positively associated with increased effect sizes. Whereas the number of trials was significantly negatively associated with the effect size. There was no difference between blocked (substance-related cues and neutral cues presented in separate blocks) vs. non-blocked designs (substance-related and neutral cues in mixed blocks). Within the smoking Stroop the use of paper-and-pencil (vs. computerized) and unblocked (vs. blocked) designs were associated with significantly larger effect sizes. At first glance, these methodological decisions may seem trivial. However, increasing variation in tasks might impede our ability to generalize findings across studies. Furthermore, each modification to the design may also impact the psychometric properties of the task (Cooper et al. Citation2017). In support of this, Ataya et al. (Citation2012) re-analyzed data collected from 7 addiction Stroop tasks conducted in their laboratory and demonstrated ‘acceptable’ reliability overall, but with considerable variability across task versions (ɑ = .74; 95% CI: . 46 − .89). Other studies have demonstrated different estimates of internal reliability (Robinson et al. Citation2015; Spanakis et al. Citation2019), however most do not report reliability despite its integral role in effect estimates and reproducibility (Baugh Citation2002).
The estimates of attentional bias may also be moderated by analysis decisions made by the researcher once data collection is completed. Various studies have demonstrated that analyzing the same raw data in different ways can lead to dramatically different outcomes. For example, Carp et al. (Carp Citation2012a) demonstrated that across 10 pre-processing steps, each with between 2–4 different options led to 6,912 unique analysis pipelines in fMRI research, which when corrected for multiple comparisons using different methods increased to 34,560 different outcomes. Similarly, Silberzahn et al. (Citation2018) crowdsourced data analysis by giving 29 research teams (involving 61 analysts) the same data set and asked them to address the research question as to whether soccer referees are more likely to punish (give a red-card) dark-skin-toned players, compared to light skin-toned players. The analytic approaches, statistical significance and resulting effect sizes varied considerably.
This analytical flexibility has been termed ‘the garden of forking paths’ or ‘researcher degrees of freedom’. In support of this, Wicherts et al. (Citation2016) demonstrated at least 15 broad analysis decisions which might be taken, including; specifying pre-processing methods, deciding on how to deal with outliers and selecting the primary outcome. Of further concern are analysis decisions that might go unreported or be selectively reported. In a tongue-in-cheek example Simmons and colleagues (2011) demonstrated that unreported analysis decisions may lead to the interpretation that participants get younger after listening to The Beatles.
The flexibility in designing and analyzing research has been linked to the reproducibility ‘crisis’ in psychology and science as it may allow for questionable research practices such as p-hacking and HARKing (Munafò et al. Citation2017). P-hacking (or selective reporting) is using the flexibility in analytical pathways to calculate a p-value which might lead to the rejection of a null hypothesis (and as such supporting an alternative hypothesis of interest). HARKing (or Hypothesizing After Results are Known) is generating a hypothesis based on the data, rather than in advance (a-priori). Selective reporting has been linked to increases in false-positive findings (Ioannidis Citation2005). Tasks used to measure attentional bias and analyze the subsequent data allow extensive decision flexibility. Zhang et al. (Citation2019) demonstrated considerable variability and (lack of) reporting in the design of Visual Probe tasks for attentional bias modification. Similarly, we identified similar variability in analysis options when dealing with outliers on individual trials within the Visual Probe task, and how these decisions can influence psychometric properties (Jones et al. Citation2018). However, to our knowledge there has been limited investigation into the addiction Stroop.
Therefore, the aim of this study was to review the variability of potential design and analysis decisions a researcher might undertake for the addiction Stroop based on previous literature. Specifically, we wanted to provide an estimate of the number of i) design and ii) analysis decisions which could be made for the alcohol, smoking and drug-related Stroops respectively, based on what was reported in the literature. We also aimed to quantify the level of unreported methodological and analysis decisions. Finally, to examine potential p-hacking/selective reporting we conducted p-curve analyses on the overall Stroop effect (a difference in responding to one type of word, compared to another). It is possible that p-hacking in the Stroop literature may be present if there are a large number of analytical options, combined with null results. Similarly, there may be implausible effects reported in the literature, given poor reliability of measures constrains the maximum observable correlation between measures but also obscures effects through increased error variance (Parsons et al. Citation2019).
We pre-registered our study design and analyses strategy on Open Science Framework [https://osf.io/yp2wc]. We conducted formal searches similar to that of a systematic review, including search strategies, eligibility criteria and methodological data extraction. There are some deviations from our pre-registered protocol. Rather than include total number of trials used in the Stroop task we extracted information on the number of alcohol-, smoking-, drug-related cues used and the number of times each cue was presented. This provides greater information about the design of the Stroop task and taken together should contribute to the total number of trials, regardless.
Methods
Search strategy
We searched PsychInfo (N = 613), Pubmed (N = 529) and Scopus (N = 228) in October 2019, using the following search terms: addiction OR substance AND use OR substance AND misuse OR drugs OR alcohol OR smoking OR cigarette OR nicotine OR amphetamine OR cocaine OR cannabis OR marijuana OR heroin OR polydrug OR opiate
Inclusion and exclusion criteria
In order to be eligible for inclusion studies had to include an addiction Stroop e.g. any study which included alcohol, smoking, or drug-related words or images within a traditional Stroop task, designed to measure attentional bias.
Data extraction and analyses
We extracted data in relation to the design/methodological aspects of the Stroop, as well as data related to analytic decisions. For design/methodological aspects we extracted information on administration (computerized vs paper and pencil), participant response (key press vs. voice), inclusion of practice trials (yes vs. not reported), number of experimental trials (not including practice trials), number of drug-related stimuli, type of stimuli (words vs. pictures), number of times each stimuli was presented, design (blocked vs. mixed), control stimuli (category), number of comparison categories, number of colors used; response timeout. Our extraction code book can be found on Open Science Framework. Extraction was shared across four authors (AJ, PC, LR, SW), with cross-checking. A fifth author (JD) independently extracted data from 21 of the articles with 85.7% agreement. All disagreements were resolved within the team.
For analysis decisions we extracted information on the lower-bound reaction time (RT) cutoff (in ms), upper-bound RT cutoff (in ms), removal of individual RTs based on standard deviation cut offs, exclusion of trials in which errors were made, the primary outcome of the task (e.g. Raw RTs, or ‘difference’ scores), and whether participants were removed from analyses based on Stroop performance.
In order to conservatively estimate the potential number of different (hypothetical) unique Stroop tasks an investigator could design based on previous research we multiplied the number of different variations for key design decisions,
We did not include administration type, as this generally does not include variation in response type (only voice), timeouts, or design (block designs only). We also did not include the number of critical trials, as this is often determined by other decisions we did include (e.g. number of stimuli, number of colors used) and this would considerably inflate our estimates. Similarly, we did not include the number of comparison conditions as this is largely related to specific hypotheses within papers.
In order to estimate the potential number of different analytical pipelines an investigator could attempt based on previous research we multiplied the number of different variations in key analysis variables,
If a design decision was not reported, we took that to assume it was not carried out (e.g. no lower-bound RT cutoff was implemented), as it is impossible to infer selective reporting.
The conducted P-Curve tests for evidential value of the reported p-values using the P-Curve app (http://p-curve.com). The rationale for p-curve is as follows. First, unlike previous techniques for combining p-values (e.g. Fisher’s combined test) the p-curve only uses statistically significant p-values (p < .05). In the absence of a ‘real’ Stroop effect (i.e. no attentional bias to alcohol/smoking/drug related words) the distribution of p-values from p < .0001 to p ∼ 1.0 should be uniform (all outcomes equally as likely: a flat p-curve). If there is a true ‘Stroop’ effect the distribution of p-values should be right skewed (more p values closer to p ≤ .01 than p = .05) and the right skew should be larger with greater power of the studies. However, according to (Simonsohn et al. Citation2014) if selective reporting or p-hacking exists in the literature (in this case due to the large number of analysis decisions) then the p-curve should be left skewed (a greater number of p-values ∼.05 than p < .01), due to experimenters’ limited ambition to achieve a small p-value rather than one that simply crosses the threshold of conventional statistical significance.
We report the continuous test which computes pp-values for each test, before standardizing the values (Z-scored). The sum of the Z scores is divided by the number of tests and the resulting Z score and corresponding p-value is the test for evidential value (Simonsohn et al. Citation2015). We also report the half-curve. The half-curve focuses on the distribution of p-values < .025, which may be a solution to deal with more ambitious p-hacking (Simonsohn et al. Citation2015). In order to conduct supplementary P-Curve analyses, we also extracted information on hypotheses for the Stroop effect (e.g. a test of reaction time/error differences to different stimulus types) and the statistical test for this hypothesis. Type of tests identified included paired samples t-tests (e.g. comparing mean reaction times to alcohol vs. control words), one sampled t-tests comparing a Stroop difference score (mean reaction times to control words – mean reaction times to neutral words) to 0, or omnibus tests (e.g. ANOVAS) if multiple images categories (e.g. alcohol vs. neutral vs. positive vs. negative) were used or the analyses included group comparisons (e.g. smokers vs. non-smokers). If this was the case, we extracted the F-value and degrees of freedom for the main effect of cue. Similarly, we also extracted statistical tests for hypotheses which examined that the Stroop effect was moderated by substance use status, (e.g. ‘compared to controls, abstinent alcoholics would show delayed color-naming of alcohol-related words’ (Field et al. Citation2013)) or was associated with consumption/craving (e.g. ‘smoking Stroop effect should be associated with craving for the positive effects of smoking’ (Waters et al. Citation2009)). We also conducted robustness checks (e.g. if studies reported both a group difference between heavy and light drinkers in the Stroop, but also a correlation with alcohol consumption). These robustness checks did not substantially influence our findings. P-curve reporting table is available on Open Science Framework.
Exploratory Meta-analysis
In an attempt to explore whether the effect sizes from the Stroop task were associated with analysis decisions we conducted exploratory meta-analyses on the effect sizes for the Stroop effect across alcohol, smoking and drug Stroops. This analysis was not pre-registered, but was the consequence of a helpful peer-review process.
We extracted information from studies which allowed us to compute an effect size for the Stroop effect. This was either the mean or median reaction times/number of errors to substance alcohol words and the standard deviation, and the mean or median reaction times/number of errors to neutral comparison words and the standard deviation. If standard deviations were not available, but means were, we imputed these by estimating the average standard deviation in relation to the mean for all other studies of the same stimulus type. If standard errors were provided we converted them to standard deviations (standard deviation = standard error * √N). If data was available in figures, we used webplot digitizer to obtain it (Rohatgi Citation2015). If data was not available in the paper we contacted authors and requested this data. We computed a Standardized Mean Difference using the formula (meanSubstance – meanNeutral/pooledSD), and the associated standard error. If data was provided as an interference score, we used the formula for SMD as (meanInterference − 0/SDInterference). Given the lack of reporting of a correlation between substance and neutral RTs/Errors, we imputed a correlation of 0.59, in line with previous research (Balk et al. Citation2012).
If studies reported a Stroop effect across different drinking groups (e.g. Heavy and Light Drinkers: Adams et al. Citation2012) we took the overall Stroop effect to reduce any variability in effect sizes from sampling. For smoking and drug-related Stroops we did not include the Stroop effect from non-using controls groups (e.g. Copersino et al. Citation2004). One study (Lusher et al. Citation2004) had an implausibly large effect size SMD > 50Footnote1 and was excluded.
Meta-analysis and -regressions were conducted in R, using the ‘metafor’ package. We used a random effects, restricted maximum likelihood model. Heterogeneity was measured using the I2 statistic (Higgins et al. Citation2003), with I2 > 50% representing moderate heterogeneity and > 75% indicative of substantial heterogeneity. We conducted moderator analyses on a number of design and analysis decisions including i) computerized vs paper-and-pencil tasks, ii) words vs pictures, iii) blocked vs mixed design, iv) inclusions of practice trials vs non-stated, v) inclusion of RT cut offs (upper or lower bound) vs no exclusion. Data and analyses files are on OSF [https://osf.io/fc8qn/]
Results
Study selection
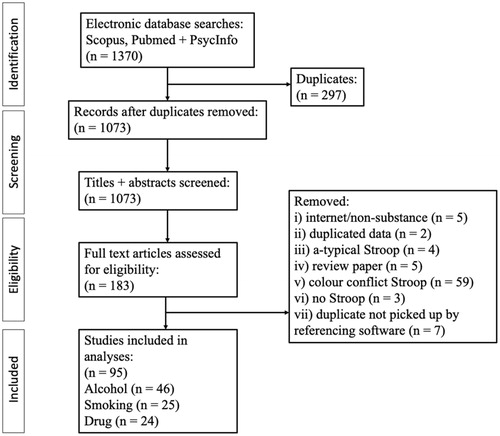
After duplicates were removed, we retained 1073 articles for title and abstract screening. Following title and abstract screening 183 papers remained for full text screen. Of these, we identified n = 46 studies containing an Alcohol Stroop, n = 25 containing a Smoking Stroop and n = 24 containing a Drug-related Stroop. Full details of papers included is provided on Open Science Framework. The remaining studies did not meet our inclusion criteria (e.g. presenting an emotion Stroop with no alcohol/smoking cues, using a modified Stroop to manipulate attentional bias, duplicates that were not picked up by automatic filtering in EndNote/study protocols). PRISMA flowchart is shown in .
Figure 1. PRISMA diagram outlining systematic searches of the literature.
Alcohol stroop
We identified 46 studies (published from 1994 − 2019) which implemented a version of the addiction Stroop with alcohol-related stimuli.
Variation in design/methodological variables
The majority of studies (N = 35) used a computer to administer the Alcohol Stroop, compared to a paper-and-pencil version (N = 10) (see ). One study did not report how the Stroop task was administered. All paper-and-pencil Stroop tasks required a voice response from the participant, whereas 26 of the computerized tasks required a key-press, and 7 required a verbal response. Two studies required both a voice response and corresponding key-press, however one study recorded only the voice response and the other recorded only the key press response.
Table 1. Extracted data of the design decisions of the Alcohol Stroop.
The majority of the Stroop tasks used words (N = 43), with 3 using pictures. Twenty-five used a blocked design, whereas 16 used a mixed design. Two studies used a combination mixed and block design, and three studies did not report the design used. The majority (N = 31) included four-word colors (range 2 − 5). Furthermore, most studies reported the inclusion of practice trials (N = 33). The number of alcohol-related stimuli ranged from 4 − 28 (mean = 14.1), and the number of times the stimuli were presented ranged from 1 − 48 (mean = 6.4). There was considerable variability in control/comparison cues, which we attempted to categorize into 10 distinct themes (building-related, clothing-related, emotional, environment-related, household-related, music-related, office-related, soft-drinks, transport, other). The most common comparator was household-related words (N = 17).
Finally, there was considerable variability in the reporting of trial time outs in the computer administrated Stroops. Ten studies did not report this information. Of the studies that did, 12 required a response from the participant to move on to the next trial. Where a timeout was reported it ranged from 1500 ms − 6000 ms (mean = 2714 ms).
We estimate that based on previous research there are 1,451,520 potential iterations of the alcohol addiction Stroop task that could be designed for administration on a computer, and 11,520 paper-and-pencil versionsFootnote2, based on previous research.
Variation in analysis decisions
Paper-and-pencil Stroop tasks do not record reaction times or error rates on a trial-by-trial basis and are not included in the frequencies for lower/upper bound cutoffs or individual trial removals based on standard deviations (see ). Twenty-five studies did not report a lower bound RT cutoff. Of those that did, cutoffs ranged from 100 ms − 400 ms, with one study not reporting what the cut off was (RT trimming was stated). Twenty-five studies did not report an upper-bound cut off. Of those that did, cutoffs ranged from 1500 ms − 10000 ms, with one study not reporting the cut off used. Thirty-two studies did not remove RTs if they were a number of SDs around the mean. Two studies removed RTs that were 3 SDs above the mean and one study removed RTs that were 3 SDs above or below the mean. Fourteen studies did not explicitly state trials on which errors were made were not removed, whereas 19 studies did. One study (Cox et al. Citation2003) stated that due to error infrequency they were not considered in analyses. One study recoded errors as the mean RT + 2 SDs.
Table 2. Extracted data of the analysis decisions on the Alcohol Stroop task.
Of all the studies, 42 did not remove any participants based on overall Stroop scores. Studies removed participants if they were >2, 3, or 4 SDs from the sample mean. One study removed participants based on ‘totally incorrect responses’ but did not provide further information.
Finally, the majority of all Stroop studies (N = 25) conducted primary analyses on Mean Reaction Times to alcohol-stimuli vs. comparison stimuli, with 1 study analyzing medians rather than means. Twelve studies analyzed difference/interference scoresFootnote3 based on means, 1 analyzed difference/interference scores based on medians and 1 analyzed difference/interference scores based on D scores. Three studies used errors as a primary outcome (2 using raw error scores and 1 using difference/interference error scores). Two studies analyzed individual reaction times in a general linear model.
We estimated based on the available research there are 9,000 potential analysis pipelines for the computerized alcohol Stroop.
P-Curve for stroop effect
We were able to extract 22 statistical tests for a Stroop effect (e.g. the test for difference in reaction times/errors/difference scores based on stimuli) (Online supplementary Figure 1). Of these 22 significant statistical tests, 3 had a p value > .025. Continuous tests for half curve (Z= −12.97, p < .0001) and full curve (Z = −13.03, p < .0001) were statistically significant. The p-curve demonstrated support for evidential value.
P-Curve for moderation with or associations with drinking status/craving
We were able to extract 17 significant tests. Of these significant statistical tests, 6 had a p value > .025 (online Supplementary Figure 2). Continuous tests for half curve (Z = −4.72, p < .001) and full curve (Z = −3.99, p < .001) were statistically significant. Half and Full curve tests remained significant (ps < .001) for robustness checks. The p-curve demonstrated support for evidential value.
Smoking stroop
We identified 25 studies (published from 2006 − 2019) which implemented a version of the addiction Stroop with smoking-related stimuli.
Variation in design/methodological variables
The majority of studies (N = 21) used a computer to administer the smoking Stroop, compared to a paper-and-pencil version (N = 4) (see ). All paper-and-pencil Stroop tasks required a voice response from the participant, whereas 16 of the computerized tasks required a key-press, and 3 required a verbal response. One study required both a voice response and corresponding key-press, and one study did not report the response required.
Table 3. Extracted data of the design decisions of the Smoking Stroop.
All but one (N = 20) of the computerized smoking Stroops used words. Eighteen used a blocked design, whereas 5 used a mixed design. Two studies did not report the design used. The majority of all Stroops (N = 12) included three word-colors (range 3 − 5). Furthermore, most studies reported the inclusion of practice trials (N = 14). The number of smoking-related stimuli ranged from 5 − 26 (mean = 12.8), and the number of times the stimuli were presented ranged from 1 − 10 (mean = 5.4). There was some variability in control/comparison cues, which we categorized into 3 distinct themes (household-related, mixed/other, unknown/not reported). The most common comparators were unknown/not reported (N = 9).
Finally, there was considerable variability in the reporting of trial timeouts. In the computerized versions 11 studies did not report this information. Of the studies that did, two required a response from the participant to move on to the next trial. Where a timeout was reported it ranged from 1200 ms − 4000 ms (mean = 2462 ms).
We estimate that based on previous research there are 77,760 potential iterations of the smoking addiction Stroop task that could be designed to be administered on a computer, and 1,080 paper-and-pencil versions, based on previous research.
Variation in analysis decisions
Ten studies did not report a lower-bound RT cutoff. Of the 11 that did that did, cutoffs ranged from 100 ms − 200 ms (see ). Fourteen studies did not report an upper-bound RT cutoff, of those that did it ranged from 1000 − 2000 ms. Fourteen studies did not remove RTs if they were a number of SDs around the mean. One study removed RTs >2 SDs above and below the mean, one study removed RTs >2 SDs above the mean only, two studies removed RTs > 3 SDs above and below the mean, one study removed RTs > 2 SDs below and >3 SDs above the mean, one study replaced RTs > 3 SDs above the mean with mean RT + 3 SDs, and one study replaced RTs > 3 SDs above the mean with the mean RT. Thirteen studies did not explicitly state trials on which errors were made were not removed, whereas 7 did.
Table 4. Extraction table of Analysis Decisions of the Smoking Stroop.
Twenty studies did not report removal of participant responses based on Stroop performance. Two studies removed participants who made >33% errors, 1 study removed participants who made >25% errors or a difference score was 4 standard deviations outside the sample mean, and 1 study removed participants with mean RTs outside three standard deviations from the sample mean.
Finally, the nine studies conducted primary analyses on Mean Reaction Times to alcohol-stimuli vs. comparison stimuli, with 1 study analyzing medians rather than means. Eleven studies analyzed difference/interference scoresFootnote4 based on means, 2 analyzed difference/interference scores based on medians. In 2 studies the main outcome measure was unclear.
We estimated based on the available research there are 5,376 potential analysis pipelines for the alcohol Stroop.
P-Curve for stroop effect
We were able to extract 13 statistical tests for a Stroop effect (see online Supplementary Figure 3).
Of these 13 significant statistical tests, 0 had a p value > .025. Continuous tests for half curve (Z = −5.06, p < .0001) and full curve (Z = −6.90, p < .0001) were statistically significant. The p-curve demonstrated support for evidential value.
P-Curve for moderation with or associations with smoking status/craving
We were able to extract 5 significant tests (online Supplementary Figure 4). Of these significant statistical tests, 1 had a p value > .025. Continuous tests for half curve (Z = −1.71, p = .0437) and full curve (Z = −2.30, p = .0106) were statistically significant. The p-curve demonstrated some support for evidential value.
Drug-related stroop
We identified 24 studies (published from 2000 − 2018) which implemented a version of the addiction Stroop with drug-related stimuli (either: mixed, cocaine-, methamphetamine-, heroin-, cannabis-related cues).
Variation in design/methodological variables
The majority of studies (N = 21) used a computer to administer the drug Stroop, compared to a paper-and-pencil version (N = 3) (see ). All paper-and-pencil Stroop tasks required a voice response from the participant, whereas 19 of the computerized tasks required a key-press, and 2 required a verbal response.
Table 5. Extraction of data for design decisions of the Drug Stroop.
Twenty-two of the computerized drug-related Stroops used words (1 used images and 1 used both). Twelve used a blocked design, whereas 10 used a mixed design. Two studies did not report the design used. The majority of all Stroops (N = 17) included four word-colors (range 3 − 4). Furthermore, most studies reported the inclusion of practice trials (N = 15). The number of smoking-related stimuli ranged from 2 − 319 (mean = 11.2Footnote5), and the number of times the stimuli were presented ranged from 1 − 32 (mean = 6.6). There was some variability in control/comparison cues, which we categorized into 8 distinct themes. The most common comparators were mixed (N = 9).
Finally, there was considerable variability in the reporting of trial timeouts. In the computerized versions 5 studies did not report this information. Of the studies that did, one required a response from the participant to move on to the next trial. Where a timeout was reported it ranged from 1750 ms − 6000 ms (mean = 3170 ms).
We estimate that based on previous research there are 112,640 potential iterations of the drug addiction Stroop task that could be designed to be administered on a computer, and 2,816 paper-and-pencil versions, based on previous research.
Variation in analysis decisions
Thirteen studies did not report a lower-bound RT cutoff. Of the 8 that did that did, cutoffs ranged from 100 ms − 200 ms (see ). Nineteen studies did not report an upper-bound RT cutoff, the two that did were 1500 ms and 3000 ms. One study removed RTs >3 SDs above and below the mean. Eleven studies did not explicitly state trials on which errors were made were not removed.
Table 6. Extracted data of the analysis decisions on the Drug Stroop task.
Twenty studies did not report removal of participant responses based on Stroop performance. One study removed participants with RTs > 3 SDs above the mean, one study removed participants with >25% reaction times < 200 ms, and one study removed participants with ‘excessive errors’. A further study removed all participants with a negative inference score (e.g. no attentional bias), although this was to test a specific theoretical prediction.
Finally, fourteen studies conducted primary analyses on Mean Reaction Times to drug-related-stimuli vs. comparison stimuli, with 1 study analyzing mean reaction times in the first blocks of the task only. Seven studies analyzed difference/interference scores based on means, and 2 analyzed difference/interference scores based on medians.
We estimated based on the available research there are 768 potential analysis pipelines for the alcohol Stroop.
P-Curve for drug stroop effect
We were able to extract 10 statistical tests for a Stroop effect (see online Supplementary Figure 5). Of these 10 significant statistical tests, 0 had a p value > .025. Continuous tests for half curve (Z = −9.07, p < .0001) and full curve (Z = −10.65, p < .0001) were statistically significant. The p-curve demonstrated support for evidential value.
P-Curve for moderation with or associations with smoking status/craving
We were able to extract 8 significant tests (online Supplementary Figure 6). Of these significant statistical tests, 7 had a p value < .025. Continuous tests for half curve (Z= −2.25, p < .01) and full curve (Z= −3.75, p < .001) were statistically significant. Robustness checks demonstrated the half curve p value changed to (p = .002), whilst full curve remained < .001. The p-curve demonstrated support for evidential value.
Exploratory meta-analyses
We were able to extract k = 77 effect sizes relating to the alcohol, smoking and drug Stroops. The pooled effect size was SMD = 0.23 [95% CI = 0.17; 0.29], Z = 7.29, p < .001], see Supplementary Figure 7 for forest plot. There was considerable heterogeneity across effect sizes (I2 = 80%). Leave-one-out analyses demonstrated the pooled effect was not largely influenced by one effect size (SMDs ranged between .22 to .23, all p values < .001). There was no evidence of moderation of the effect size for the majority of our extracted variables (see supplementary Table 1). There was weak evidence increased number of alcohol, smoking, drug-related stimuli was associated (X2(1) = 4.19, p = .040) with larger effect sizes (coefficient = .002 (95% CI: .001 to .004)).
Discussion
The aim of this study was to quantify the design and analysis decisions a researcher might make when utilizing the addiction Stroop task. Based on available information in the literature a considerable number of potential design and analysis decisions can be taken for each task. Given these decisions, it is possible that based on previous information a researcher could design 1,451,520 different computerized Stroop tasks to assess alcohol attentional bias, 77,760 to assess smoking attentional bias and 112,640 to assess attentional bias to drug-related cues. This makes the number of tasks that are precisely the same very limited across studies, which in turn limits their generalizability. Whilst researchers often have to make difficult decisions on task design, which might be constrained by pragmatic (e.g. time) or methodological issues, small changes to task design can considerably influence psychometric properties (Cooper et al. Citation2017).
Similarly, we found evidence of analytical flexibility (‘researcher degrees of freedom’) when examining the data from the addiction Stroops. These analysis pipelines may increase the risk of false-positive findings in the literature (Ioannidis Citation2005; Simmons et al. Citation2011), which might also partially explain the inconsistent findings reported across attentional bias studies (Christiansen et al. Citation2015; Heitmann et al. Citation2018). Encouragingly our p-curve analyses suggest evidential value and limited evidence of p-values clustering around the commonly accepted threshold for statistical significance (p < .05; (Chavalarias et al. Citation2016)). This suggests that researchers are unlikely to be utilizing analysis pipelines in search of a ‘statistically significant’ effect, known as p-hacking. However, we note that the p-curve is not immune to p-hacking if parallel analyses are conducted and the ‘strongest’ result is chosen (Ulrich and Miller Citation2015), rather than conducting sequential analyses until the p < .05 is reached.
A wider issue identified in our review is the lack of reporting for key methodological and analytical variables. Whilst this issue is not limited to the Stroop task (it has been reported across psychology, ranging from fMRI research (Carp Citation2012b) to human laboratory studies of eating behavior (Robinson et al. Citation2018)) it does limit the ability of researchers to attempt direct replications (Brandt et al. Citation2014). In line with many of the positive reforms in psychology, researchers should endeavor to establish guidelines or a checklist on reporting of the addiction Stroop and cognitive tests more generally, alongside reliability estimates (Parsons et al. Citation2019). Here we have examined some key variables which should at the very least be reported however, we invite researchers to add to this list and strive toward transparent and comprehensive reporting. Similar efforts should also be undertaken for other tasks designed to measure attentional bias (e.g. Visual Probe).
There is also a lack of research into the psychometric properties of the emotional/addictive Stroop, which should be surprising given their widespread use. Very few studies reported on the psychometric properties of the task used. In a comprehensive analysis Hedge et al. (Citation2018) demonstrated that many cognitive tasks including the standard Stroop offer poor reliability, below what is acceptable for research into individual differences. These observations were replicated by Wilson et al. (Citation2019) when examining the emotional Stroop with suicide related words (rs = −.09–.13), suggesting unacceptable measurement error in these tasks.
Finally, we note that the vast majority of design and analysis decisions made by researchers were not justified (this has also been noted for cognitive tasks elsewhere, specifically for trial numbers: ‘different studies can choose very different numbers without any explicit discussion or justification’ Hedges et al. (Citation2018, 1174). There was some consistency in the design and analysis decisions within research groups suggesting heritability passed from peers/mentors (discussed in Smaldino and McElreath Citation2016). Whilst this may serve to increase productivity as less effort is spend designing and validating new research materials, it can also increase the proliferation of inadequate practices and increase false positives. When analysis decisions were justified with a reference it was often inaccurately attributed. For example, studies often cited Ratcliffe (Ratcliff Citation1993) as justification for implementing RT cutoffs, however did not provide any information on distribution testing, amount of data removed or comparing their method with other methods to determine whether it was optimal. All of which are recommended in the original paper.
Our exploratory meta-analysis demonstrated a small but robust alcohol Stroop effect, in line with previous meta-analyses (Cox et al. Citation2006). Our examination of design and analytic variables as potential moderators of the effect suggested limited influence. There was weak evidence that a larger number of unique substance-related cues increased the Stroop effect, this may be due to the reduced likelihood of habitation (and attenuating of any biases) to a larger number of images (Hall and Rodríguez Citation2017). However, examination of each potential variable in isolation may not lead to substantial differences in effect sizes across studies, due to myriad other factors which also contribute to the phenomenon. The combination of analytic/methodological decisions may substantially influence effect sizes (for example, a small number of trial repetitions combined with no practice trials and no reaction time trimming might lead to effect sizes computed on highly variable RTs). Future avenues of research might include multiverse analyses to examine the variability of effect sizes and statistical significance within studies, as a result of design and methodological decisions (see Steegen et al. Citation2016). Importantly, if the overall Stroop effect remains irrespective of different methodologies and analysis pathways (known as conceptual replication: Crandall and Sherman Citation2016) then this can increase our confidence that the effect is robust. Such conceptual replications, as well as direct replications, are important in overcoming the replication crisis.
Our review is not without limitations. First, it is entirely plausible we have not provided an exhaustive list of potential design and analysis decisions researchers might make, as we decided to focus on prominent and previously discussed variables. Indeed it is possible that variables such as inter-trial-intervals might influence Stroop performance, based on research in other cognitive domains (Auchter et al. Citation2017; Cooper et al. Citation2017). Similarly, the counterbalancing (or not) of blocked designs may also moderate Stroop performance (Waters and Feyerabend Citation2000). We also noted (but did not analyze) variability in the number of different category comparisons, e.g. alcohol vs. neutral vs. positive vs. negative words (Fridrici et al. Citation2013). Increasing the number of comparisons serves to increase complexity and length of the task which may also influence psychometric properties. Second, for a number of variables (e.g. lower/upper-bound RT cutoffs) it is impossible to infer whether lack of reporting is due to these procedures not being carried out or careless/undisclosed reporting. Therefore, it is possible our estimations of analysis pipelines are conservative, with the potential that they are even larger than reported here.
Concluding remarks
This is the first study to examine in detail the variability in the methodological and analytic decisions researchers might be faced with when conducting research into attentional bias using the addiction Stroop. The observed variability means a large number of different tasks can be designed and analyses carried out by justifying decisions based on published literature. This has a number of implications for the reproducibility and reliability of the attentional bias research in addiction. Despite this, researchers should have some confidence that attentional bias is a seemingly robust phenomenon. We observed no evidence of p-hacking (at least in the studies we identified), and effect sizes demonstrating the presence of bias toward-substance related cues were unaffected by the identified analysis/methodological choices. Nevertheless, in order to achieve further progress in the field researchers should develop and adopt stringent reporting guidelines, and investigate whether methodological and analytic decisions influence the psychometric properties of the addiction Stroop.
Open Scholarship


This article has earned the Center for Open Science badges for Open Data, Open Materials and Preregistered through Open Practices Disclosure. The data and materials are openly accessible at https://doi.org/10.5281/zenodo.1212328, https://doi.org/10.5281/zenodo.1212328 and https://doi.org/10.5281/zenodo.1212328. To obtain the author’s disclosure form, please contact the Editor.
Supplementary Material
Download MS Word (3.4 MB)Disclosure statement
The authors report no conflicts of interest.
Correction Statement
This article has been corrected with minor changes. These changes do not impact the academic content of the article.
Notes
1 This may have been due to a mislabelling of standard deviations in the original paper, however we were unable to contact the author for clarification.
2 Here we looked at variability only in number of alcohol stimuli, number of times presented, control category, number of colours and practice trials.
3 If it wasn’t specifically stated otherwise we assumed difference scores were based on mean RTs.
4 If it wasn’t specifically stated otherwise we assumed difference scores were based on mean RTs.
5 Not including 319 in estimation which would significantly skew the mean (26.6, if included).
References
- Adams S, Ataya AF, Attwood AS, Munafò MR. 2012. Effects of acute alcohol consumption on alcohol-related cognitive biases in light and heavy drinkers are task-dependent. J Psychopharmacol. 26(2):245–253.
- Ashley V, Honzel N, Larsen J, Justus T, Swick D. 2013. Attentional bias for trauma-related words: exaggerated emotional Stroop effect in Afghanistan and Iraq war veterans with PTSD. BMC Psychiatry. 13(1):86.
- Asmaro D, Carolan PL, Liotti M. 2014. Electrophysiological evidence of early attentional bias to drug-related pictures in chronic cannabis users. Addict Behav. 39(1):114–121.
- Ataya AF, Adams S, Mullings E, Cooper RM, Attwood AS, Munafò MR. 2012. Internal reliability of measures of substance-related cognitive bias. Drug Alcohol Depend. 121(1–2):148–151.
- Auchter A, Cormack LK, Niv Y, Gonzalez-Lima F, Monfils MH. 2017. Reconsolidation-extinction interactions in fear memory attenuation: the role of inter-trial interval variability. Front Behav Neurosci. 11:2.
- Baugh F. 2002. Correcting effect sizes for score reliability: a reminder that measurement and substantive issues are linked inextricably. Educ Psychol Meas. 62(2):254–263.
- Balk EM, Earley A, Patel K, Trikalinos TA, Dahabreh IJ. 2012. Empirical Assessment of Within-Arm Correlation Imputation in Trials of Continuous Outcomes [Internet]. Rockville (MD): Agency for Healthcare Research and Quality (US); Nov. Report No.: 12(13)-EHC141-EF.
- Brandt MJ, IJzerman H, Dijksterhuis A, Farach FJ, Geller J, Giner-Sorolla R, Grange JA, Perugini M, Spies JR, van 't Veer A. 2014. The replication recipe: what makes for a convincing replication? J Exp Soc Psychol. 50:217–224.
- Cane J, Sharma D, Albery I. 2009. The addiction Stroop task: examining the fast and slow effects of smoking and marijuana-related cues. J Psychopharmacol. 23(5):510–519.
- Carp J. 2012a. On the plurality of (methodological) worlds: estimating the analytic flexibility of fMRI experiments. Front Neurosci. 6:149.
- Carp J. 2012b. The secret lives of experiments: methods reporting in the fMRI literature. Neuroimage. 63(1):289–300.
- Chavalarias D, Wallach JD, Li AHT, Ioannidis JPA. 2016. Evolution of reporting p values in the biomedical literature, 1990–2015. JAMA. 315(11):1141–1148.
- Christiansen P, Schoenmakers TM, Field M. 2015. Less than meets the eye: reappraising the clinical relevance of attentional bias in addiction. Addict Behav. 44:43–50.
- Cooper SR, Gonthier C, Barch DM, Braver TS. 2017. The role of psychometrics in individual differences research in cognition: a case study of the AX-CPT. Front Psychol. 8:1482.
- Copersino ML, Serper MR, Vadhan N, Goldberg BR, Richarme D, Chou JC, Stitzer M, Cancro R. 2004. Cocaine craving and attentional bias in cocaine-dependent schizophrenic patients. Psychiatry Res. 128(3):209–218.
- Cousijn J, van Benthem P, van der Schee E, Spijkerman R. 2015. Motivational and control mechanisms underlying adolescent cannabis use disorders: a prospective study. Dev Cogn Neurosci. 16:36–45.
- Cox WM, Brown MA, Rowlands LJ. 2003. The effects of alcohol cue exposure on non-dependent drinkers' attentional bias for alcohol-related stimuli. Alcohol Alcohol. 38(1):45–49.
- Cox WM, Fadardi JS, Pothos EM. 2006. The addiction-stroop test: theoretical considerations and procedural recommendations. Psychol Bull. 132(3):443–476.
- Crandall C, Sherman J. 2016. On the scientific superiority of conceptual replications for scientific progress. J Exp Soc Psychol. 66:93–99.
- Cristea IA, Kok RN, Cuijpers P. 2016. The effectiveness of cognitive bias modification interventions for substance addictions: a meta-analysis. PLoS One. 11(9):e0162226.
- Fadardi JS, Cox WM. 2009. Reversing the sequence: reducing alcohol consumption by overcoming alcohol attentional bias. Drug Alcohol Depend. 101(3):137–145.
- Field M, Cox W. 2008. Attentional bias in addictive behaviors: a review of its development, causes, and consequences. Drug Alcohol Depend. 97(1–2):1–20.
- Field M, Werthmann J, Franken I, Hofmann W, Hogarth L, Roefs A. 2016. The role of attentional bias in obesity and addiction. Health Psychol. 35(8):767–780.
- Field M, Christiansen P, Cole J, Goudie A. 2007. Delay discounting and the alcohol Stroop in heavy drinking adolescents. Addiction. 102(4):579–586.
- Field M, Duka T, Tyler E, Schoenmakers T. 2009. Attentional bias modification in tobacco smokers. Nicotine Tob Res. 11(7):812–822.
- Field M, Eastwood B. 2005. Experimental manipulation of attentional bias increases the motivation to drink alcohol. Psychopharmacology (Berl). 183(3):350–357.
- Field M, Marhe R, Franken IHA. 2014. The clinical relevance of attentional bias in substance use disorders. CNS Spectr. 19(3):225–230.
- Field M, Mogg K, Mann B, Bennett GA, Bradley BP. 2013. Attentional biases in abstinent alcoholics and their association with craving. Psychol Addict Behav. 27(1):71–80.
- Field M, Munafò MR, Franken IHA. 2009. A meta-analytic investigation of the relationship between attentional bias and subjective craving in substance abuse. Psychol Bull. 135(4):589–607.
- Franken IHA, Hendriks VM, Stam CJ, Van den Brink W. 2004. A role for dopamine in the processing of drug cues in heroin dependent patients. Eur Neuropsychopharmacol. 14(6):503–508.
- Fridrici C, Leichsenring-Driessen C, Driessen M, Wingenfeld K, Kremer G, Beblo T. 2013. The individualized alcohol Stroop task: no attentional bias toward personalized stimuli in alcohol-dependents. Psychol Addict Behav. 27(1):62–70.
- Hall G, Rodríguez G. 2017. Habituation and conditioning: salience change in associative learning. J Exp Psychol Anim Learn Cogn. 43(1):48–61.
- Hedge C, Powell G, Sumner P. 2018. The reliability paradox: why robust cognitive tasks do not produce reliable individual differences. Behav Res Methods. 50(3):1166–1186.
- Heitmann J, Bennik EC, van Hemel-Ruiter ME, de Jong PJ. 2018. The effectiveness of attentional bias modification for substance use disorder symptoms in adults: a systematic review. Syst Rev. 7(1):160.
- Higgins JP, Thompson SG, Deeks JJ, Altman DG. 2003. Measuring inconsistency in meta-analyses. BMJ (Clinical Research ed.). 327(7414):557–560.
- Ioannidis JPA. 2005. Why most published research findings are false. PLoS Med. 2(8):e124.
- Jones A, Christiansen P, Field M. 2018. Failed attempts to improve the reliability of the alcohol visual probe task following empirical recommendations. Psychol Addict Behav. 32(8):922–932.
- Kerst WF, Waters AJ. 2014. Attentional retraining administered in the field reduces smokers' attentional bias and craving. Health Psychol. 33(10):1232–1240.
- Lusher J, Chandler C, Ball D. 2004. Alcohol dependence and the alcohol Stroop paradigm: evidence and issues. Drug Alcohol Depend. 75(3):225–231.
- MacLeod C, Mathews A, Tata P. 1986. Attentional bias in emotional disorders. J Abnorm Psychol. 95(1):15–20.
- Marissen MAE, Franken IHA, Waters AJ, Blanken P, van den Brink W, Hendriks VM. 2006. Attentional bias predicts heroin relapse following treatment. Addiction. 101(9):1306–1312.
- Mourik RV, Oosterlaan J, Sergeant JA. 2005. The Stroop revisited: a meta-analysis of interference control in AD/HD. J Child Psychol Psychiatry. 46(2):150–165.
- Munafò MR, Nosek BA, Bishop DVM, Button KS, Chambers CD, Percie Du Sert N, Simonsohn U, Wagenmakers E-J, Ware JJ, Ioannidis JPA. 2017. A manifesto for reproducible science. Nat Hum Behav. 1(1):1–9.
- Parsons S, Kruijt A-W, Fox E. 2019. Psychological science needs a standard practice of reporting the reliability of cognitive-behavioral measurements. Adv Meth Pract Psychol Sci. 2(4):378–395.
- Ratcliff R. 1993. Methods for dealing with reaction time outliers. Psychol Bull. 114(3):510–532.
- Robbins SJ, Ehrman RN. 2016. The role of attentional bias in substance abuse. Behav Cogn Neurosci Rev. 3(4):243–260.
- Robinson E, Bevelander KE, Field M, Jones A. 2018. Methodological and reporting quality in laboratory studies of human eating behavior. Appetite. 125:486–491.
- Robinson CD, Pickworth WB, Heishman SJ, Wetter DW, Cinciripini PM, Li Y, Rowell B, Waters AJ. 2015. Black cigarette smokers report more attention to smoking cues than white smokers: implications for smoking cessation. Nicotine Tob Res. 17(8):1022–1028.
- Rohatgi A. 2015. Web based tool to extract data from plots, images, and maps. https://automeris.io/WebPlotDigitizer/.
- Spanakis P, Jones A, Field M, Christiansen P. 2019. A Stroop in the hand is worth two on the laptop: superior reliability of a smartphone based alcohol Stroop in the real world. Subst Use Misuse. 54(4):692–698.
- Shapiro KL, Raymond JE, Arnell KM. 1997. The attentional blink. Trends Cogn Sci. 1(8):291–296.
- Silberzahn R, Uhlmann EL, Martin DP, Anselmi P, Aust F, Awtrey E, Bahník Š, Bai F, Bannard C, Bonnier E, et al. 2018. Many analysts, one data set: making transparent how variations in analytic choices affect results. Adv Meth Pract Psychol Sci. 1(3):337–356.
- Simmons JP, Nelson LD, Simonsohn U. 2011. False-positive psychology: undisclosed flexibility in data collection and analysis allows presenting anything as significant. Psychol Sci. 22(11):1359–1366.
- Simonsohn U, Nelson L, Simmons J. 2014. P-curve: a key to the file-drawer. J Exp Psychol Gen. 143(2):534–547.
- Simonsohn U, Simmons JP, Nelson LD. 2015. Better P-curves: making P-curve analysis more robust to errors, fraud, and ambitious P-hacking, a Reply to Ulrich and Miller (2015). J Exp Psychol Gen. 144(6):1146–1152.
- Smaldino PE, McElreath R. 2016. The natural selection of bad science. R Soc Open Sci. 3(9):160384.
- Steegen S, Tuerlinckx F, Gelman A, Vanpaemel W. 2016. Increasing transparency through a multiverse analysis. Perspect Psychol Sci. 11(5):702–712.
- Stroop JR. 1935. Studies of interference in serial verbal reactions. J Exp Psychol. 18(6):643–662.
- Ulrich R, Miller J. 2015. p-hacking by post hoc selection with multiple opportunities: detectability by skewness test?: Comment on Simonsohn, Nelson, and Simmons (2014). J Exp Psychol Gen. 144(6):1137–1145.
- Verhaeghen P, De Meersman L. 1998. Aging and the Stroop effect: a meta-analysis. Psychol Aging. 13(1):120–126.
- Waters AJ, Carter BL, Robinson JD, Wetter DW, Lam CY, Kerst W, Cinciripini PM. 2009. Attentional bias is associated with incentive-related physiological and subjective measures. Exp Clin Psychopharmacol. 17(4):247–257.
- Waters A. j, Feyerabend C. 2000. Determinants and effects of attentional bias in smokers. Psychol Addict Behav. 14(2):111–120.
- Wicherts JM, Veldkamp CLS, Augusteijn HEM, Bakker M, van Aert RCM, van Assen MALM. 2016. Degrees of freedom in planning, running, analyzing, and reporting psychological studies: a checklist to avoid p-hacking. Front Psychol. 7:1832.
- Wiers RW, Gladwin TE, Hofmann W, Salemink E, Ridderinkhof KR. 2013. Cognitive bias modification and cognitive control training in addiction and related psychopathology: mechanisms, clinical perspectives, and ways forward. Clin Psychol Sci. 1(2):192–212.
- Wilson KM, Millner AJ, Auerbach RP, Glenn CR, Kearns JC, Kirtley OJ, Najmi S, O'Connor RC, Stewart JG, Cha CB. 2019. Investigating the psychometric properties of the Suicide Stroop Task. Psychol Assess. 31(8):1052–1061.
- Xu Y, Li Y, Wang G, Yuan X, Ding W, Shen Z. 2014. Attentional bias toward safety predicts safety behaviors. Accid Anal Prev. 71:144–153.
- Zhang M, Fung DSS, Smith H. 2019. Variations in the visual probe paradigms for attention bias modification for substance use disorders. IJERPH. 16(18):3389.