
 ?Mathematical formulae have been encoded as MathML and are displayed in this HTML version using MathJax in order to improve their display. Uncheck the box to turn MathJax off. This feature requires Javascript. Click on a formula to zoom.
Abstract
Background: We aimed to assess whether stress, boredom, drinking motives, and/or inhibitory control were related to alcohol use during a period of social isolation.
Method: Analyses were carried out on questionnaire data (N = 337) collected during the first wave of the COVID-19 pandemic (7 April–3 May 2020). We first assessed changes in drinking behavior, stress and boredom. We then regressed drinking behavior on drinking motives, inhibitory control, stress, and boredom. We also investigated interactions between change in stress/boredom and inhibitory control.
Results: A minority of respondents reported increased alcohol use (units = 23.52%, drinking days = 20.73%, heavy days = 7.06%), alcohol-related problems (9.67%), and stress (36.63%). Meanwhile, most respondents reported increased boredom (67.42%). Similarly, boredom significantly increased (B = 21.22, p < .001), on average, while alcohol-related problems decreased (B = −1.43 p < .001). Regarding drinking motives, decreased alcohol-related problems were associated with social drinking motives (B = −0.09, p = .005). Surprisingly, risk-taking was associated with decreased alcohol-related problems (B = −0.02, p = .008) and neither stress nor boredom independently predicted changes in alcohol use. Finally, several significant interactions suggested that those who were more impulsive and less bored were more likely to report increased alcohol use and vice versa.
Conclusions: These data provide a nuanced overview of changes in drinking-related behavior during the COVID-19-induced period of social isolation. While most people reduced their drinking, there was evidence of complex interactions between impulsivity and boredom that may be explored in future studies.
Introduction
Increased mortality and morbidity have been linked to social isolation (e.g. loneliness) for decades (e.g. House et al. Citation1988). A large volume of theoretical and empirical work states that this effect ultimately results from increased activation of the hypothalamic pituitary adrenocortical (HPA) axis (Cacioppo et al. Citation2015). Chronic HPA axis activation results in dysfunctional stress responses and deficits in emotional regulation (Milivojevic and Sinha Citation2018). In turn, these neuroadaptations contribute to the development and maintenance of addiction and offer an explanation as to why stress is a prominent risk factor for alcohol misuse (e.g. Jose et al. Citation2000; Ruisoto and Contador Citation2019).
Poor inhibitory control (i.e. impulsivity) is a multifaceted construct (Strickland and Johnson Citation2021) that has been established as a risk factor for alcohol misuse (e.g. Dalley and Ersche Citation2019; Lee et al. Citation2019). Evidence for this is provided by pre-clinical experimental work (e.g. Belin et al. Citation2008; Kreek et al. Citation2005), neuroimaging studies (e.g. Bosker et al. Citation2017; Voon et al. Citation2020), and heritability studies (e.g. Karlsson Linnér et al. Citation2021). However, relatively little has been completed in the way of understanding the contextual conditions under which this effect may differ. Nevertheless, recent work has shown that in times of acute stress, those who have lower inhibitory control tend to crave and consume more alcohol (Clay et al. Citation2018; Clay and Parker Citation2018).
‘Boredom’ (i.e. the inability to find satisfaction or interest while participating in an activity) has also been associated with addictive behaviors such as gambling (Eastwood and Mercer Citation2010) and alcohol misuse (Biolcati et al. Citation2018). Those with reduced inhibitory control tend to have greater boredom proneness (Struk et al. Citation2016; Isacescu et al. Citation2017). Therefore, poor inhibitory control may moderate the relationship between boredom and alcohol use, whereby the impact of boredom on alcohol use is greater among those with poor inhibitory control.
Other well-researched moderators of drinking behavior exist: so-called drinking motives (Cooper Citation1994). Several general patterns emerge when examining the impact of drinking motives on alcohol use: social motives (i.e. drinking to improve social situations) tend to be related to drinking frequency; enhancement motives (i.e. drinking to increase positive affect) are related to heavy drinking; coping motives (drinking to reduce negative affect) are associated with a greater number of alcohol-related problems; and conformity motives (i.e. drinking to fit in with a group) are typically negatively associated with frequency and quantity of alcohol use (Kuntsche et al. Citation2005, Citation2014; Lyvers et al. Citation2010). Drinking motives have also been shown to impact alcohol use following crisis. For example, after the 9/11 terrorist attack, Beseler et al. (Citation2011) found that both drinking to cope and drinking for enjoyment (i.e. enhancement) were associated with increased alcohol use. Similarly, ‘drinking to cope’ has been highlighted as a prominent risk factor for increased alcohol use during the COVID-19 pandemic in the USA (Rodriguez et al. Citation2020) and Canada (Wardell et al. Citation2020).
The COVID-19 pandemic and associated ‘lockdowns’ (i.e. government mandated periods of social isolation characterized by orders to remain at home to mitigate the spread of disease; Anderson et al. Citation2020) have resulted in increased mental distress worldwide through (for example) social isolation, loss of income, increased childcare responsibilities, and monotony (Bhattacharjee and Acharya Citation2020; Gavin et al. Citation2020; Ornell et al. Citation2020; Pfefferbaum and North Citation2020). Thus, the pandemic presents a naturalistic source of negative affect. Early in the pandemic, several scholars warned that long-term isolation may create an unforeseen public health crisis involving increased alcohol consumption (Clay and Parker Citation2020; Finlay and Gilmore Citation2020; Ramalho Citation2020). As a result, attempts were made to synthesize work conducted in-relation to other crises involving trauma (e.g. the 9/11 attack), epidemic outbreaks (e.g. the 2002-03 SARS pandemic), and economic hardship (e.g. the 2008 recession) in relation to alcohol use (Gonçalves et al. Citation2020). Ultimately, two opposing scenarios were proposed (Rehm et al. Citation2020): (1) increased psychological distress may drive an increase in alcohol use and related harms; (2) alcohol policies which reduce the physical and financial availability of alcohol would cause a reduction in alcohol consumption and associated problems.
Following these predictions, recent work has tried to characterize those most at-risk of increased alcohol consumption, although this literature offers a somewhat mixed picture. Several studies provide evidence that increased distress was associated with increased drinking (Koopmann et al. Citation2020; Neill et al. Citation2020; Tran et al. Citation2020; Garnett et al. Citation2021; Jacob et al. Citation2021). Conversely, in a large-scale study comprising data from 21 European countries, Kilian et al. (Citation2021) found evidence that drinking decreased in most countries and that this reduction was primarily driven by reduced availability of alcohol. Nevertheless, increased distress dampened this relationship. Additionally, recent work has shown that impulsivity acts as a moderator of stress-related pandemic drinking (Clay et al. Citation2021). However, that paper reports a secondary analyses of birth cohort data, and such surveys prioritize brevity and breadth. Thus, single-item measures of impulse-control were utilized, which were not empirically validated and may suffer from reduced content validity.
Overall, previous research provides strong evidence for the prediction that those who increased their drinking during the pandemic were drinking to cope, which may be moderated by impulsivity, and limited evidence that a reduction in affordability or availability played a role. Therefore, our work here was motivated by the need to evaluate risk factors for those who increased their drinking during the pandemic; whether they were drinking to cope and whether this relationship, if present, was moderated by impulsivity (using empirically validated measures).
As we move out of the pandemic, this work is of importance as it pertains to drinking in the home (versus in public settings). For instance, prior to the pandemic, a significant proportion of alcohol was consumed at home (perhaps due to convenience, cost, safety, autonomy, and stress relief) (e.g. Foster and Ferguson Citation2012; Callinan et al. Citation2016). Moreover, most long-term harms that occur because of alcohol use (e.g. liver disease and cancer) are linked to total alcohol consumption (GBD 2016 Alcohol Collaborators Citation2018). However, research typically focuses on public drinking (Callinan and MacLean Citation2020). Thus, if a large amount of alcohol is typically consumed in the home, further research which focuses on drinking in this setting is crucial in reducing the burden of alcohol, and data collected during the COVID-19 pandemic provides the perfect opportunity for this (Callinan and MacLean Citation2020).
We aimed to investigate how some of the theoretical mechanisms that underlie alcohol use (in a non-clinical sample in the hope that our results are generalizable to as many people as possible) may have operated during a period of social isolation brought on by the COVID-19 pandemic. We hope that this increased theoretical understanding of socially isolated home drinking, will have broader implications beyond the pandemic by, for instance, identifying those most at-risk of future alcohol-related long-term harm.
We preregistered several hypothesesFootnote1: (1) alcohol use would increase during social isolation; (2) both coping and enhancement motives would be associated with increased alcohol use; (3) poor inhibitory control, stress, and boredom would be positively associated with an increase in alcohol use; and (4) the association between poor inhibitory control would be greater among those with higher negative affect (stress and boredom).
Materials and methods
Recruitment
A survey designed to assess changes in, and factors related to, drinking behavior during social isolation was created using Qualtrics (Provo, Utah). The survey was developed in English, and then translated into French, Spanish, Italian, Portuguese (European and Brazilian), and Hebrew by the native speaking authors. Some wording had to be changed slightly to retain the original meaning and to ensure consistency across countries. Participants were eligible if they were ≥ 18 years of age, had a reliable internet connection, and they were proficient in at least one of the languages listed above. Participants could complete the survey on either a computer, smartphone, or tablet. All responses were completed between 7 April 2020 and 3 May 2020. During this time, the survey was advertised by several news media outlets and throughout the co-authors’ networks via email, word-of-mouth, and social media. All participants gave their informed consent and were not compensated. The study was approved by the University of Portsmouth Science Faculty Ethics Committee (ref: SFEC 2020-030).
Demographic information
Demographic data collected were age, gender, ethnicity, country of residence, education level, occupation, whether the respondent was a key worker, gross individual income over the last 12 months, subjective social status, marital status, the number of people in the same household as the respondent, number of offspring, who the respondent was isolated with, and whether the respondent was suffering from any COVID-19 associated symptoms. Country of residence was recoded to reflect sub-regions of the world based on the United Nations M49 Standard (United Nations Citation2020). This allowed us to find a balance between the number of levels and the number of participants within each level (Hox et al. Citation2018). The gross individual income question was presented in local currency relative to British Pounds and then recoded to relative income using World Bank adjusted net national income per capita data (The World Bank Citation2020), where:
(1)
(1)
An index of socioeconomic status (SES), combining relative income, education, occupation, and subjective social status (Diemer et al. Citation2013), was calculated using exploratory factor analysis (EFA) – see Appendices. This allowed us to conserve statistical power during hypothesis testing by controlling for the variables entered into the final EFA using a single model parameter. Similar approaches to creating an index of SES have been published elsewhere (e.g. Scharoun-Lee et al. Citation2009; Yu et al. Citation2014).
Alcohol use and drinking behavior
Alcohol Use Disorders Identification Test (AUDIT): The AUDIT was created by the World Health Organization as a brief assessment of alcohol misuse (Babor et al. Citation1992, Citation2001). It has been shown to have excellent psychometric properties when used to assess alcohol use disorders in a variety of settings (Fleming et al. Citation1991; Claussen and Aasland Citation1993). The AUDIT is scored on a scale from 0 to 40, where scores between 0 and 7 indicate low-risk drinking, scores between 8 and 15 indicate increasing risk of harm, scores between 16 and 19 higher risk drinking, and a score >20 suggests alcohol dependence. Internal consistency of the AUDIT in the present study was good, Cronbach’s α = 0.78.
Typical Atypical Drinking Diary (TADD): The TADD was used to retrospectively assess alcohol use (Patterson et al. Citation2019). When completing the TADD, participants fill in two weekly diaries: one for typical weeks and another for atypical weeks (i.e. either less than or greater than a typical week). Participants specified the type, strength, volume, and quantity of the beverages they consumed for each day of the 7-day week and then estimated how many weeks they drank this typical/atypical amount during the specified period. Participants were asked to estimate what they drank before (i.e. ‘before the COVID-19 induced isolation’) and during (i.e. ‘after the COVID-19 induced isolation’) social isolation. This method allows for the calculation of units,Footnote2 drinking days, and heavy drinking daysFootnote3 per week. Research indicates that the TADD is more accurate and time-efficient than other retrospective assessments of drinking, such as the Timeline Followback (Patterson et al. Citation2019).
Alcohol Problems Questionnaire (APQ): Alcohol-related problems were assessed using the Alcohol Problems Questionnaire (Drummond Citation1990). The APQ is a standalone scale that consists of 44 binary (yes/no) items designed to assess alcohol-related problems across four domains: commonly faced alcohol-related problems, problems related to romantic relationships, problems related to children, and problems related to work. Therefore, the maximum score on the APQ is 44, with a higher score reflecting a greater number of alcohol-related problems faced. Here, we added a ‘Not Applicable’ option to the latter subscales to allow the questionnaire to be relevant to a larger proportion of the population than the original scale. For instance, an 18-year-old student may not have any children. We also changed the wording for questions about romantic relationships from ‘spouse’ to ‘spouse/partner’ for the same reason. The APQ has been shown to have good validity and test-retest reliability (Williams and Drummond Citation1994). In the present study, the internal consistency was excellent, Cronbach’s α = 0.94.
Drinking motives
Drinking motives were assessed using the Revised Drinking Motives Questionnaire (DMQ–R; Cooper Citation1994). The DMQ-R is a 20-item scale which proposes four motives for alcohol consumption: conformity (e.g. ‘so you won't feel left out’); coping (e.g. ‘drinking to forget your problems’); enhancement (e.g. ‘to have fun’); and social (e.g. ‘because it helps you enjoy a party’). Here, participants responded to each item using a 5-point Likert scale (1 = Almost never/never, 2 = Some of the time, 3 = Half of the time, 4 = Most of the time, 5 = Almost always/always). Each subscale contains five items. Thus, the maximum score per subscale is 25, with higher scores indicating greater endorsement of a motive. The DMQ-R has been shown to have good validity across cultures and in a variety of age groups (Fernandes-Jesus et al. Citation2016). Here, the internal consistency of the DMQ-R subscales ranged from acceptable to excellent, Cronbach’s αs = 0.68–0.89.
Negative affect
Short stress overload scale (SOS–S)
Self-report stress levels were measured before (i.e. ‘before the COVID-19 related isolation’) and during (i.e. ‘since the COVID-19 related isolation’) social isolation using the SOS-S (Amirkhan Citation2018). The SOS-S is a 10-item scale designed to act as a brief diagnostic tool for stress and stress-related disorders and has been shown to have good psychometric properties. Here, participants responded to each item using a five-point Likert scale (1 = Not at all: 5 = A lot). Therefore, the maximum score on the SOS-S is 50, with higher scores reflecting greater levels of stress. In the present study, internal consistency was excellent, Cronbach’s αs = 0.90–0.92.
Perceived stress reactivity scale (PSRS)
Stress reactivity was assessed using the 23-item PSRS (Schlotz et al. Citation2011). The PSRS is a standalone scale with five subscales: prolonged reactivity, reactivity to work overload, reactivity to social conflict, reactivity to failure, and reactivity to social evaluation. Participants responded to each item using a 3-point Likert-type scale that varied depending on the framing of each item (e.g. ‘When tasks and duties build up to the extent that they are hard to manage…’, 0 = ‘…I am generally untroubled’, 1 = ‘…I usually feel a little uneasy’, 2 = ‘…I normally get quite nervous’). Therefore, the maximum total score on the PSRS is 46, with higher scores indicating greater levels of stress reactivity. The psychometric properties of the PSRS has been established in several countries, with scores correlating with numerous stress-related disorders (Schlotz et al. Citation2011). In the present study, the internal consistency was good, Cronbach’s α = 0.88.
Multidimensional state boredom scale (MSBS)
Boredom before and during social isolation was assessed using the MSBS (Fahlman et al. Citation2013). The MSBS is a 29-item scale with good psychometric properties that can be used to quantify boredom by either using the total score or across five subscales: disengagement, high arousal, low arousal, inattention, and time perception. Here, participants responded to each statement using a seven-point Likert scale (1 = Strongly disagree, 2 = Disagree, 3 = Somewhat disagree, 4 = Neutral, 5 = Somewhat agree, 6 = Agree, 7 = Strongly agree). Thus, the maximum score was 203, where higher scores reflect greater levels of boredom. The internal consistency here was excellent with Cronbach’s α ranging from 0.96 to 0.97.
Inhibitory control
The shortened urgency, premeditation, perseverance, sensation seeking, positive urgency, impulsive behaviour scale (S-UPPSP)
The S-UPPSP was used to assess negative urgency (i.e. the tendency to act rashly under extreme negative emotions), lack of premeditation (i.e. the tendency to act without thinking), lack of perseverance (i.e. the inability to remain focused on a task), sensation seeking (i.e. the tendency to seek out novel and thrilling experiences), and positive urgency (i.e. the tendency to act rashly under extreme positive emotions) (Cyders et al. Citation2014). The S-UPPSP is a 20-item scale where participants rate several statements related to their impulsive behavior on a four-point Likert-type scale (1 = Agree strongly, 2 = Agree some, 3, Disagree some, 4 = Disagree strongly). Each subscale is made up of four items; therefore, the maximum score on each subscale is 16, with higher scores reflecting a greater level of impulsivity. Numerous studies have suggested associations between impulsive traits measured using the original and shortened UPPS-P scales and alcohol use (e.g. Coskunpinar et al. Citation2013). In the present study, internal consistency of each subscale ranged from acceptable to good, Cronbach’s α = 0.67–0.82.
Domain-specific risk-taking scale (DOSPERT)
The DOSPERT was administered to assess risk-taking (Blais and Weber Citation2006). The DOSPERT is a 30-item scale designed to assess five sub-domains risk-taking: ethical, financial, health, recreational, and social. Here, participants rate how likely it is that they would engage with each activity or behavior using a 7-point Likert scale (1 = Extremely unlikely, 2 = Moderately unlikely, 3 = Somewhat unlikely, 4 = Not sure, 5 = Somewhat likely, 6 = Moderately likely, 7 = Extremely likely). Scores can be summed across all items or by subscale. Each subscale contains six-items. Therefore, the maximum score overall is 210, with higher scores indicating a greater propensity to take risks. The DOSPERT has been shown to be a reliable and valuable assessment of ‘real world’ risk-taking via questionnaire (e.g. Highhouse et al. Citation2017). Here, the internal consistency of the DOSPERT was good, Cronbach’s α = 0.82.
Procedure
After informed consent was confirmed, participants reported their demographic information before completing the remaining scales in counterbalanced order to eliminate order effects. Scales that measured both pre- and intra-isolation data (e.g. the TADD) were presented as one block, whereby the scale which sought pre-isolation responses was presented first.
Sample
Due to limited financial and temporal resources, we used opportunity/snowball sampling to collect data from as many participants as possible within the study period (Lakens Citation2022). Overall, 1148 responses were recorded. Of these, 811 were excluded to ensure data integrity: 39.55% had >40% missing dataFootnote4; 21.43% reported living in sub-regions with an inadequate number of responsesFootnote5; 7.40% were classified as multivariate outliers based upon a Mahalanobis distance that is significant at p < .001 (Verardi and Dehon Citation2010; Tabachnick and Fidell Citation2014) and 0.17% were considered clear univariate outliers (see Appendices); 0.87% reported experiencing no social isolation; 0.52% were test data; 0.44% had gender recorded as transgender or ‘prefer not to say’ and 0.09% had ethnicity recorded as ‘prefer not to say’Footnote6; and 0.17% were duplicate responses. This left 337 cases for analysis. A simulation-based sensitivity power analysis (Lakens Citation2022) showed that our design had sufficient statistical power (1 – β) = 80% to detect an effect size of B = 0.0015 for our most complex model. Details of the sensitivity power analysis can be seen in the Appendices. Sociodemographic characteristics of the sample are shown in .
Table 1. Sociodemographic characteristics of the sample.
Analysis
Data, preregistered hypotheses, and code for analyses are posted on the Open Science Framework at https://osf.io/mnz34/. Data were analyzed using Stata IC (version 16.1) and R (version 4.0.4).
Missing data
Missing data was dealt with using multiple imputation (MI; Enders Citation2010). White et al. (Citation2011, p. 388) recommended that ‘m should be at least equal to the percentage of incomplete cases’. Here, the overall percentage of cases with incomplete data on analysis variables was 37.69%. Therefore, we used the mi impute chained command in Stata to generate 40 imputed datasets, using predictive mean matching, with d = 5 (Schenker and Taylor Citation1996). Graphical diagnostics (see Appendices) suggested that the datasets should be separated by at least 125 iterations of the imputation algorithm, thus we conservatively saved each dataset after the 150th iteration. The imputation model included all variables used in subsequent analyses together with the hypothesized interaction terms and three auxiliary variables that were believed to be correlated with missingness (percent progress in survey, date of response, AUDIT score). Interaction terms were imputed and estimated following Enders et al. (Citation2014).
Descriptive and inferential statistics
Change scores were calculated for units, drinking days, heavy drinking days, alcohol–related problems, stress, and boredom, using the mi passive command. Descriptive statistics were calculated for each of the key study variables. Bivariate relationships were explored using Pearson correlations (see Appendices). Linear mixed-effects models (LMMs) were used to test our hypotheses. We included sub-region as a random effect to improve inference and generalizability (Barr et al. Citation2013). We first assessed change in alcohol use, stress, and boredom by entering change scores and covariates into models as fixed effects and interpreting the intercept (analogous to a one sample t-test comparing the change score to zero). Next, we regressed change in alcohol use scores on our predictors of interest and covariates. Finally, we entered our hypothesized interactions into the models.
All continuous predictor variables were grand mean centered to aid interpretation and reduce potential collinearity. Models were separated by construct to conserve statistical power and to avoid erroneously conditioning the model estimates (Mcmullin et al. Citation2021). We implemented Benjamini and Hochberg’s (Citation1995) method of false discovery rate (FDR) control for pre-registered confirmatory analyses to reduce the probability of making a type I error due to multiple testing (Glickman et al. Citation2014). Significant interactions were probed using the Johnson-Neyman (JN) technique (Johnson and Neyman Citation1936) as suggested by Hayes (Citation2017). Covariates included in all models were: age (e.g. Leigh and Stacy, Citation2004), gender (e.g. White et al. Citation2015), ethnicity (e.g. Twigg and Moon Citation2013), SES (e.g. Probst et al. Citation2020), the number of COVID-19 symptoms experienced (e.g. Chaaban et al. Citation2021), and whether the participant was isolated with children (e.g. MacMillan et al. Citation2021). Models including stress as a predictor also controlled for perceived stress reactivity (e.g. Clay and Parker Citation2018). As the sample lacked ethnic diversity, a dichotomous White/non-White variable was used. As the margins command is incompatible with imputed data, the first complete dataset was used to probe and visualize significant interactions. For brevity, non-significant LMM results are reported in the Appendices. Results were considered significant when p < .05.
Results
displays the descriptive statistics for the main study variables, in terms of alcohol use and drinking behavior, drinking motives, stress, boredom, and inhibitory control. See Table S2 for correlations between variables.
Table 2. Descriptive statistics (M and SD) for main study variables (N = 337).
Changes in alcohol use, stress, and boredom
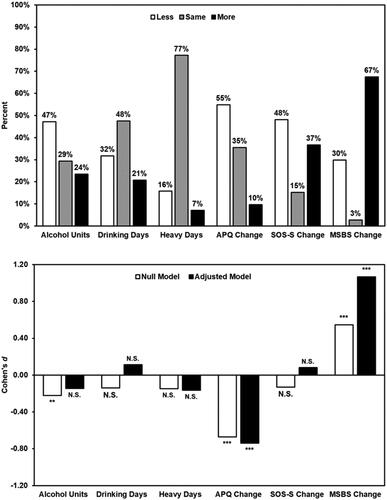
shows changes in alcohol use, stress, and boredom. A sizeable number of respondents reported increased alcohol use (units = 23.52%, drinking days = 20.73%, heavy days = 7.06%), alcohol-related problems (9.67%), and stress (36.63%). Meanwhile, the majority of respondents reported increased boredom (67.42%). Results from the unadjusted models, which tested whether change occurred on average, suggested that alcohol units (B = −1.53, FDR-adjusted p = .004) and alcohol-related problems (B = −1.47, FDR-adjusted p < .001) decreased. Meanwhile, boredom (B = 18.16, p = FDR-adjusted p < .001) increased. In the adjusted models, there was evidence to suggest that alcohol-related problems (B = −1.43 FDR-adjusted p < .001) decreased while boredom increased (B = 21.22, FDR-adjusted p < 001). No other significant changes were found.
Figure 1. Changes in alcohol use, alcohol-related problems, stress, and boredom during social isolation (N = 337). Note. Both prevalence estimates (top) and effect sizes (bottom) were calculated using imputed data (m = 40). Adjusted models controlled for age, gender, ethnicity, socioeconomic status, the number of symptoms experienced, and whether the respondent was isolating with children. 1 unit = 8 g pure ethanol; 1 heavy day = consuming >8 units per day for men or >6 units per day for women; APQ: Alcohol Problems Questionnaire; SOS-S: Short Stress Overload Scale; MSBS: Multidimensional State Boredom Scale. *FDR-adjusted p < .05, **FDR-adjusted p < .01, ***FDR-adjusted p < .001.
Associations between drinking motives and alcohol use behavior
Social motives were associated with a decrease in alcohol-related problems (B = −0.09, FDR-adjusted p = .005). No other significant relationships were found.
Associations between inhibitory control, stress, boredom, and alcohol use
Risk-taking (DOSPERT score) was associated with a decrease in alcohol-related problems (B = −0.02, FDR-adjusted p = .008). No other significant associations were found.
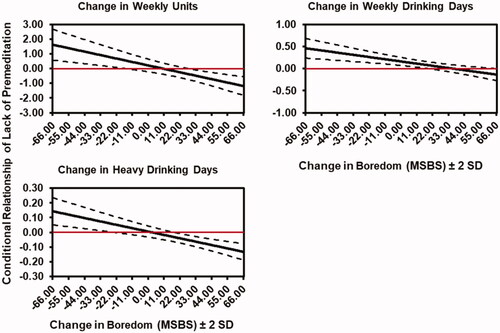
Moderation analyses suggested that boredom modified the relationship between lack of premeditation and the number of units consumed per week (B = −0.02, FDR-adjusted p = .034), the number of weekly drinking days (B = −0.004, FDR-adjusted p = .027), and the number of heavy drinking days (B = −0.002, FDR-adjusted p = .048). No other significant interactions were observed. JN plots (see ) revealed that those who were more impulsive and less bored tended to report increased alcohol use, and vice-versa. Specifically, a decrease of ≥16 MSBS points was associated with an increase in the number of units consumed. Whereas an increase of ≥28 points was associated with a decrease in the number of units consumed. Similarly, decreased MSBS scores were associated with an increased number of drinking days. Meanwhile, an increase of <19 MSBS points was associated with a decrease in drinking days. Finally, a decrease of ≥16 MSBS points was associated with an increase in the number of heavy drinking days. Whereas an increase of ≥ 18 MSBS points was associated with an increase in the number of heavy drinking days.
Figure 2. Johnson-Neyman plots illustrating significant inhibitory control x boredom interactions (N = 337). Note. Models were fitted using imputed data (m = 40). Models were adjusted for age, gender, ethnicity, socioeconomic status, the number of symptoms experienced and whether the respondent was isolating with children. The first imputed dataset was used to visualize statistically significant interactions. 1 unit = 8 g pure ethanol; 1 heavy drinking day = consuming > 8 units per day for men or > 6 units per day for women. Dashed lines represent the 95% CI.
Discussion
The present study aimed to better understand how a period of social isolation, brought about by the recent COVID-19 pandemic, affected alcohol use. By assessing associations between changes in drinking behavior, drinking motives, inhibitory control, stress, and boredom, we provide a nuanced overview of how some of the theoretical mechanisms which underlie alcohol use and misuse may have operated during this time.
We found that approximately 1 in 4 respondents reported drinking more and around 1 in 10 reported experiencing an increased number of alcohol-related problems. These findings correspond to similar work conducted during the COVID-19 pandemic (Koopmann et al. Citation2020; Neill et al. Citation2020; Tran et al. Citation2020; Clay et al. Citation2021; Garnett et al. Citation2021; Jacob et al. Citation2021; Schmits and Glowacz Citation2021; Kilian et al. Citation2022). Most respondents reported feeling more bored during lockdown, as in previous work (Martarelli and Wolff Citation2020; Jackson et al. Citation2021; Latif and Karaman Citation2021). Stress levels, however, either stayed the same or decreased for most and, despite our prediction, stress was not significant in any model. Our findings are at odds with previous literature that has found the pandemic has been associated with increased mental distress (Bhattacharjee and Acharya Citation2020; Gavin et al. Citation2020; Ornell et al. Citation2020; Pfefferbaum and North Citation2020), and that pandemic-related distress was associated with increased drinking (Koopmann et al. Citation2020; Neill et al. Citation2020; Tran et al. Citation2020; Garnett et al. Citation2021; Jacob et al. Citation2021).
One explanation for this discrepancy may be that the physiological and psychological effects of acute vs. chronic stress differ (Stephens and Wand Citation2012; Crosswell and Lockwood Citation2020). Thus, it is plausible that the effect of stress on drinking differs as a function of the timescale and severity. Alternatively, it may be due to differences in measures used; several studies cited above utilized measures that are typically used to diagnose manifestations of poor mental health (e.g. depression, anxiety) in clinical settings, while we used a measure of perceived stress. Similar to us, other non-clinical studies carried out during the pandemic, using momentary assessments of positive and negative affect, suggested that preconsumption affect was not associated with increased drinking during the pandemic (Tovmasyan et al. Citation2022). Finally, the discrepancy may relate to the nature of our sample, which was predominantly highly educated Westerners.
Those who were high in risk-taking (DOSPERT total score) tended to face fewer alcohol-related problems during social isolation, despite impulsivity (i.e. the tendency to take risks) being an established risk factor for addictive behaviors (see Dalley and Ersche Citation2019; Lee et al. Citation2019 for reviews). However, boredom was found to be a critical moderator here: those who were less impulsive (in terms of lack of premeditation), who also reported feeling more bored, were more likely to increase alcohol use during the isolation and vice versa. Previous research has identified boredom as a risk-factor for health risk behaviors, such as substance misuse (e.g. Wegner and Flisher Citation2009). However, we found that although most participants reported increased boredom, the majority also reported a decrease in alcohol use. A reason for the decreased alcohol use in those that were showing higher rates of boredom may relate to the lack of interest in alcohol outside of the typical situations. For example, drinking is typically a social activity (e.g. Niland et al. Citation2013), and we found that social motives were the most endorsed drinking motive among our sample; indeed, those with higher social drinking motives reported fewer alcohol-related problems. Thus, this suggested that, on average, our sample were motivated to drink when in social situations; something clearly impacted significantly by the social isolation.
Reward expectancy (i.e. the anticipated reward associated with alcohol consumption) is determined by drinking motives, with those who tend to ‘drink to cope’ showing the highest anticipated reward expectancy (Birch et al. Citation2004; Grant and Stewart Citation2007). In our sample, coping was the one of the least endorsed motives, suggesting that our sample were low in this trait. In this sense, the expected positive reinforcement associated with drinking (i.e. alleviation of the boredom) would not be a strong motivator to drink in our sample. Further research is needed to disentangle the relationship between drinking motives, reward expectancy, boredom and alcohol consumption.
Boredom is associated with a negative affective state, which can be high- or low- arousal (Fahlman et al. Citation2013). In either case, boredom is associated with anhedonia, thus theoretically decreasing the pleasure associated with usually rewarding activities (Watson et al. Citation2020). Although typically boredom-induced anhedonia is not associated with substance misuse (Nikčević et al. Citation2017), boredom is a complex and multifaceted phenomenon (Raffaelli et al. Citation2018). Therefore, as people were exposed to an unprecedented period of social isolation, and subsequently high levels of boredom were reported here and in other studies (e.g. Droit-Volet et al. Citation2020), it may be that the phenomenon experienced during the pandemic is dissimilar (in terms of intensity and duration) than previous work (e.g. laboratory-based studies) or during previous times. Taken together, these factors may offer a potential explanation for our findings.
Limitations
We acknowledge several study limitations. First, there were relatively high levels of attrition. This may have been driven by the length of the survey as several relatively long and detailed psychometric instruments were employed. However, a limitation of previous work in this area is that brief single-item measures, that may be limited by reduced content validity, were used (Clay et al. Citation2021). Thus, the present work overcomes this limitation, providing nuance at the expense of sample size. Nevertheless, the bias introduced by missing data was minimized by employing multiple imputation. Second, respondents tended to be White, highly educated, and relatively wealthy. Ultimately, this may limit the generalizability of our findings to those with similar sociodemographic characteristics. Similarly, the COVID-19 pandemic has been an unprecedented time, thus pandemic-related findings may only hold true inside this timeframe. Third, self-report measures are prone to measurement error. For instance, there is no way to independently verify self-report drinking and people typically under-estimate their alcohol consumption on questionnaires (Northcote and Livingston Citation2011). Fourth, ‘true’ baselines for drinking behavior, stress, and boredom were unavailable and retrospective measures were employed as a proxy. Therefore, causal inference is precluded. Fifth, accurately estimating determinants of change is notoriously difficult and these considerations informed our analysis. Therefore, we purposefully tried to avoid spurious findings by not including baseline measures in our models (i.e. by using change scores instead) (Glymour et al. Citation2005). Finally, there are other potential confounding factors that were not accounted for here, such as mood disorders (Charles et al. Citation2021), as these data were not available.
Conclusions
We aimed to understand how a period of long-term social isolation affected alcohol use, particularly focusing on drinking motives, negative affect (i.e. stress and boredom), and inhibitory control. Our rationale was not just to characterize patterns observed during COVID-19, but to use the government-enforced lockdowns to model theoretical mechanisms by which alcohol consumption in the home could be affected by periods of enforced social isolation. We found that approximately one-quarter of respondents reported drinking more and around one tenth reported facing an increased number of alcohol related problems. Coupled with recent national statistics, which suggest that alcohol-related deaths in the UK reached an all-time high in 2020 (14 deaths per 100,000 people) (Office for National Statistics Citation2021), it is clear an ‘at risk’ group of individuals, who deserve immediate attention, may also require the allocation of future resources to mitigate harm. Surprisingly, however, increased risk-taking was associated with a decrease in the number of alcohol-related problems faced during social isolation and there was no evidence of an association between either stress or boredom and a change in alcohol use behavior. Moreover, several significant interactions suggested that those who were more impulsive and less bored were more likely to report increased alcohol use and vice versa. Therefore, during a period of social isolation, some theoretical mechanisms which underlie alcohol use and misuse may not be observed. This has important implications when considering mechanisms of alcohol misuse; researchers should potentially consider evaluating people’s social interactions and isolation status during future work and interventions.
Open Scholarship

This article has earned the Center for Open Science badges for Open Data and Preregistered through Open Practices Disclosure. The data are openly accessible at https://osf.io/bctgp and https://osf.io/rvuej. To obtain the author’s disclosure form, please contact the Editor.
Supplemental Material
Download PDF (873.6 KB)Acknowledgments
The authors thank everyone who supported this work by sharing the survey among their networks. The authors are grateful to Josephine Geoghegan and Amber Vaughan Perrett for volunteering to help organize the data. The authors also thank all of the participants that completed the survey for their cooperation. Finally, the authors thank those who attended the Society for the Improvement of Psychological Science 2021 session on ‘Best Practices for Addressing Missing Data through Multiple Imputation’ for their insight on dealing with missing data.
Disclosure statement
No potential conflict of interest was reported by the author(s).
Additional information
Funding
Notes
1 The original preregistration listed ten hypotheses. Data testing hypotheses one to seven and hypothesis nine are reported in the main body of this paper. These have been briefly summarized in the Introduction. As there was no significant association between a change in stress and perceived stress reactivity (see Appendices) our planned moderation analysis, detailed in hypothesis eight of the preregistration, was not conducted. As this is a two-part study, Hypothesis 10 pertains to additional longitudinal work which is, to date, ongoing.
2 1 unit = 8 g of pure ethanol.
3 1 heavy day = >8 units per day for men and >6 units per day for women.
4 Royston (Citation2004) recommends that caution should be taken when implementing multiple imputation when the proportion of missing data exceeds 50%. Therefore, acting conservatively, we used 40% as our cut off.
5 When utilizing multilevel analyses, the minimum sample size at each level of a random effect (e.g. a sub-region) should be ≥10 (Hox et al. Citation2018).
6 Analysis of such low numbers of participants would lead to low power and unstable parameter estimates.
Related Research Data
References
- Amirkhan JH. 2018. A brief stress diagnostic tool: the short stress overload scale. Assessment. 25(8):1001–1013.
- Anderson RM, Heesterbeek H, Klinkenberg D, Hollingsworth TD. 2020. How will country-based mitigation measures influence the course of the COVID-19 epidemic? Lancet. 395(10228):931–934.
- Babor TF, de la Fuente JR, Saunders J, Grant M. 1992. AUDIT: the alcohol use disorders identification test. guidelines for use in primary health care. Geneva: World Health Organization.
- Babor TF, Higgins-biddle JC, Saunders JB, Monteiro MG. 2001. AUDIT: the Alcohol Use Disorders Identification Test: Guidelines for use in primary health care. 2nd ed. Geneva: World Health Organisation.
- Barr DJ, Levy R, Scheepers C, Tily HJ. 2013. Random effects structure for confirmatory hypothesis testing: keep it maximal. J Memory and Lang. 68(3):255–278.
- Belin D, Mar AC, Dalley JW, Robbins TW, Everitt BJ. 2008. High impulsivity predicts the switch to compulsive cocaine-taking. Science. 320(5881):1352–1355.
- Benjamini Y, Hochberg Y. 1995. Controlling the false discovery rate: a practical and powerful approach to multiple testing. J R Stat Soc: Ser B (Methodological). 57(1):289–300.
- Beseler CL, Aharonovich E, Hasin DS. 2011. The enduring influence of drinking motives on alcohol consumption after fateful trauma. Alcohol Clin Exp Res. 35(5):1004–1010.
- Bhattacharjee B, Acharya T. 2020. The COVID-19 pandemic and its effect on mental health in USA – a review with some coping strategies. Psychiatr Q. 91(4):1135–1145.
- Biolcati R, Mancini G, Trombini E. 2018. Proneness to boredom and risk behaviors during adolescents’ free time. Psychol Rep. 121(2):303–323.
- Birch CD, Stewart SH, Wall A-M, McKee SA, Eisnor SJ, Theakston JA. 2004. Mood-induced increases in alcohol expectancy strength in internally motivated drinkers. Psychol Addict Behav. 18(3):231–238.
- Blais A-R, Weber EU. 2006. A domain-specific risk-taking (DOSPERT) scale for adult populations. Judgm Decis Mak. 1(1):33–47.
- Bosker WM, Neuner I, Shah NJ. 2017. The role of impulsivity in psychostimulant- and stress-induced dopamine release: review of human imaging studies. Neurosci Biobehav Rev. 78(April):82–90.
- Cacioppo JT, Cacioppo S, Capitanio JP, Cole SW. 2015. The neuroendocrinology of social isolation. Annu Rev Psychol. 66(1):733–767.
- Callinan S, MacLean S. 2020. COVID-19 makes a stronger research focus on home drinking more important than ever. Drug Alcohol Rev. 39(6):613–615.
- Callinan S, Livingston M, Room R, Dietze P. 2016. Drinking contexts and alcohol consumption: how much alcohol is consumed in different Australian locations? J Stud Alcohol Drugs. 77(4):612–619.
- Chaaban N, Høier ATZB, Andersen BV. 2021. A detailed characterisation of appetite, sensory perceptional, and eating-behavioural effects of COVID-19: self-reports from the acute and post-acute phase of disease. Foods. 10(4):892.
- Charles NE, Strong SJ, Burns LC, Bullerjahn MR, Serafine KM. 2021. Increased mood disorder symptoms, perceived stress, and alcohol use among college students during the COVID-19 pandemic. Psychiatry Res. 296:113706.
- Claussen B, Aasland OG. 1993. The Alcohol Use Disorders Identification Test (AUDIT) in a routine health examination of long‐term unemployed. Addiction. 88(3):363–368.
- Clay JM, Parker MO. 2018. The role of stress-reactivity, stress-recovery and risky decision-making in psychosocial stress-induced alcohol consumption in social drinkers. Psychopharmacology (Berl). 235(11):3243–3257.
- Clay JM, Parker MO. 2020. Alcohol use and misuse during the COVID-19 pandemic: a potential public health crisis? Lancet Public Health. 5(5):e259.
- Clay JM, Adams C, Archer P, English M, Hyde A, Stafford LD, Parker MO. 2018. Psychosocial stress increases craving for alcohol in social drinkers: effects of risk-taking. Drug Alcohol Depend. 185:192–197.
- Clay JM, Stafford LD, Parker MO. 2021. Associations between self-reported inhibitory control, stress, and alcohol (mis) use during the first wave of the COVID-19 pandemic in the UK: a national cross-sectional study utilising data from four birth cohorts. Int J Ment Health Addict. 1–22.
- Cooper ML. 1994. Motivations for alcohol use among adolescents: development and validation of a four-factor model. Psychol Assess. 6(2):117–128.
- Coskunpinar A, Dir AL, Cyders MA. 2013. Multidimensionality in impulsivity and alcohol use: a meta-analysis using the UPPS model of impulsivity. Alcohol Clin Exp Res. 37(9):1441–1450.
- Crosswell AD, Lockwood KG. 2020. Best practices for stress measurement: How to measure psychological stress in health research. Health Psychol Open. 7(2):2055102920933072.
- Cyders MA, Littlefield AK, Coffey S, Karyadi KA. 2014. Examination of a short English version of the UPPS-P Impulsive Behavior Scale. Addict Behav. 39(9):1372–1376.
- Dalley JW, Ersche KD. 2019. Neural circuitry and mechanisms of waiting impulsivity: relevance to addiction. Philos Trans R Soc Lond B Biol Sci. 374(1766):20180145.
- Diemer MA, Mistry RS, Wadsworth ME, López I, Reimers F. 2013. Best practices in conceptualizing and measuring social class in psychological research. Anal Soc Issues Publ Policy. 13(1):77–113.
- Droit-Volet S, Gil S, Martinelli N, Andant N, Clinchamps M, Parreira L, Rouffiac K, Dambrun M, Huguet P, Dubuis B, COVISTRESS Network, et al. 2020. Time and Covid-19 stress in the lockdown situation: time free, «Dying» of boredom and sadness. PLoS One. 15(8):e0236465.
- Drummond DC. 1990. The relationship between alcohol dependence and alcohol–related problems in a clinical population. Br J Addict. 85(3):357–366.
- Eastwood JD, Mercer KB. 2010. Is boredom associated with problem gambling behaviour? It depends on what you mean by ‘boredom’. Int Gambl Stud. 10(1):91–104.
- Enders CK. 2010. Applied missing data analysis. New York, NY: The Guilford Press.
- Enders CK, Baraldi AN, Cham H. 2014. Estimating interaction effects with incomplete predictor variables. Psychol Methods. 19(1):39–55.
- Fahlman SA, Mercer-Lynn KB, Flora DB, Eastwood JD. 2013. Development and validation of the multidimensional state boredom scale. Assessment. 20(1):68–85.
- Fernandes-Jesus M, Beccaria F, Demant J, Fleig L, Menezes I, Scholz U, de Visser R, Cooke R. 2016. Validation of the drinking motives questionnaire—revised in six European countries. Addict Behav. 62:91–98.
- Finlay I, Gilmore I. 2020. Covid-19 and alcohol—a dangerous cocktail. BMJ. 369(May):m1987.
- Fleming MF, Barry KL, Macdonald R. 1991. The alcohol use disorders identification test (AUDIT) in a college sample. Int J Addict. 26(11):1173–1185.
- Foster JH, Ferguson CS. 2012. Home drinking in the UK: trends and causes. Alcohol Alcohol. 47(3):355–358.
- Garnett C, Jackson S, Oldham M, Brown J, Steptoe A, Fancourt D. 2021. Factors associated with drinking behaviour during COVID-19 social distancing and lockdown among adults in the UK. Drug Alcohol Depend. 219:108461.
- Gavin B, Lyne J, McNicholas F. 2020. Mental health and the COVID-19 pandemic. Ir J Psychol Med. 37(3):156–158.
- GBD 2016 Alcohol Collaborators. 2018. Alcohol use and burden for 195 countries and territories, 1990–2016: a systematic analysis for the Global Burden of Disease Study 2016. Lancet. 392(10152):1015–1035.
- Glickman ME, Rao SR, Schultz MR. 2014. False discovery rate control is a recommended alternative to Bonferroni-type adjustments in health studies. J Clin Epidemiol. 67(8):850–857.
- Glymour MM, Weuve J, Berkman LF, Kawachi I, Robins JM. 2005. When is baseline adjustment useful in analyses of change? An example with education and cognitive change. Am J Epidemiol. 162(3):267–278.
- Gonçalves PD, Moura HF, do Amaral RA, Castaldelli-Maia JM, Malbergier A. 2020. Alcohol use and COVID-19: can we predict the impact of the pandemic on alcohol use based on the previous crises in the 21st century? A brief review. Front Psychiatry. 11:581113.
- Grant VV, Stewart SH. 2007. Impact of experimentally induced positive and anxious mood on alcohol expectancy strength in internally motivated drinkers. Cogn Behav Ther. 36(2):102–111.
- Hayes AF. 2017. Introduction to mediation, moderation, and conditional process analysis: a regression-based approach. New York, NY: Guilford publications.
- Highhouse S, Nye CD, Zhang DC, Rada TB. 2017. Structure of the Dospert: is there evidence for a general risk factor? J Behav Dec Making. 30(2):400–406.
- House JS, Landis KR, Umberson D. 1988. Social relationships and health. Science. 241(4865):540–545.
- Hox JJ, Moerbeek M, Van de Schoot R. 2018. Multilevel analysis: techniques and applications. 3rd ed. London: Routledge.
- Isacescu J, Struk AA, Danckert J. 2017. Cognitive and affective predictors of boredom proneness. Cogn Emot. 31(8):1741–1748.
- Jackson A, Anderson A, Weybright E, Lanigan J. 2021. Differing experiences of boredom during the pandemic and associations with dietary behaviors. J Nutr Educ Behav. 53(8):706–711.
- Jacob L, Smith L, Armstrong NC, Yakkundi A, Barnett Y, Butler L, McDermott DT, Koyanagi A, Shin JI, Meyer J. 2021. Alcohol use and mental health during COVID-19 lockdown: a cross-sectional study in a sample of UK adults. Drug Alcohol Depend. 219:108488.
- Johnson PO, Neyman J. 1936. Tests of certain linear hypotheses and their application to some educational problems. Stat Res Memoirs. 1:57–93.
- Jose BS, Van Oers HA, Van De Mheen HD, Garretsen HF, Mackenbach JP. 2000. Stressors and alcohol consumption. Alcohol Alcohol. 35(3):307–312.
- Karlsson Linnér R, Mallard TT, Barr PB, Sanchez-Roige S, Madole JW, Driver MN, Poore HE, de Vlaming R, Grotzinger AD, Tielbeek JJ, COGA Collaborators. 2021. Multivariate analysis of 1.5 million people identifies genetic associations with traits related to self-regulation and addiction. Nat Neurosci. 24(10):1367–1376.
- Kilian C, O'Donnell A, Potapova N, López-Pelayo H, Schulte B, Miquel L, Paniello Castillo B, Schmidt CS, Gual A, Rehm J. 2022. Changes in alcohol use during the COVID‐19 pandemic in Europe: a meta‐analysis of observational studies. Drug Alcohol Rev. 41(4):918–931.
- Kilian C, Rehm J, Allebeck P, Braddick F, Gual A, Barták M, Bloomfield K, Gil A, Neufeld M, … O'Donnell A, European Study Group on Alcohol Use and COVID‐19. 2021. Alcohol consumption during the COVID‐19 pandemic in Europe: a large‐scale cross‐sectional study in 21 countries. Addiction. 116(12):3369–3380.
- Koopmann A, Georgiadou E, Kiefer F, Hillemacher T. 2020. Did the general population in Germany drink more alcohol during the COVID-19 pandemic lockdown? Alcohol Alcohol. 55(6):698–699.
- Kreek MJ, Nielsen DA, Butelman ER, LaForge KS. 2005. Genetic influences on impulsivity, risk taking, stress responsivity and vulnerability to drug abuse and addiction. Nat Neurosci. 8(11):1450–1457.
- Kuntsche E, Gabhainn SN, Roberts C, Windlin B, Vieno A, Bendtsen P, Hublet A, Tynjälä J, Välimaa R, Dankulincová Z, et al. 2014. Drinking motives and links to alcohol use in 13 European countries. J Stud Alcohol Drugs. 75(3):428–437.
- Kuntsche E, Knibbe R, Gmel G, Engels R. 2005. Why do young people drink? A review of drinking motives. Clin Psychol Rev. 25(7):841–861.
- Lakens D. 2022. Sample size justification. Collabra: Psychology. 8(1):33267.
- Latif H, Karaman E. 2021. COVID-19: boredom in the family. Fam J. 29(2):147–152.
- Lee RSC, Hoppenbrouwers S, Franken I. 2019. A systematic meta-review of impulsivity and compulsivity in addictive behaviors. Neuropsychol Rev. 29(1):14–26.
- Leigh BC, Stacy AW. 2004. Alcohol expectancies and drinking in different age groups. Addiction. 99(2):215–227.
- Lyvers M, Hasking P, Hani R, Rhodes M, Trew E. 2010. Drinking motives, drinking restraint and drinking behaviour among young adults. Addict Behav. 35(2):116–122.
- MacMillan T, Corrigan MJ, Coffey K, Tronnier CD, Wang D, Krase K. 2021. Exploring factors associated with alcohol and/or substance use during the COVID-19 pandemic. Int J Ment Health Addict. 20(3):1814–1823.
- Martarelli CS, Wolff W. 2020. Too bored to bother? Boredom as a potential threat to the efficacy of pandemic containment measures. Humanit Soc Sci Commun. 7(1):1–5.
- Mcmullin SD, Shields GS, Slavich GM, Buchanan TW. 2021. Cumulative lifetime stress exposure predicts greater impulsivity and addictive behaviors. J Health Psychol. 26(14):2921–2936.
- Milivojevic V, Sinha R. 2018. Central and peripheral biomarkers of stress response for addiction risk and relapse vulnerability. Trends Mol Med. 24(2):173–186.
- Neill E, Meyer D, Toh WL, van Rheenen TE, Phillipou A, Tan EJ, Rossell SL. 2020. Alcohol use in Australia during the early days of the COVID-19 pandemic: initial results from the COLLATE project. Psychiatry Clin Neurosci. 74(10):542–549.
- Nikčević AV, Alma L, Marino C, Kolubinski D, Yılmaz-Samancı AE, Caselli G, Spada MM. 2017. Modelling the contribution of negative affect, outcome expectancies and metacognitions to cigarette use and nicotine dependence. Addict Behav. 74:82–89.
- Niland P, Lyons AC, Goodwin I, Hutton F. 2013. “ Everyone can loosen up and get a bit of a buzz on”: young adults, alcohol and friendship practices. Int J Drug Policy. 24(6):530–537.
- Northcote J, Livingston M. 2011. Accuracy of self-reported drinking: observational verification of ‘last occasion’ drink estimates of young adults. Alcohol Alcohol. 46(6):709–713.
- Office for National Statistics. 2021. Alcohol-specific deaths in the UK. https://www.ons.gov.uk/peoplepopulationandcommunity/healthandsocialcare/causesofdeath/bulletins/alcoholrelateddeathsintheunitedkingdom/registeredin2020.
- Ornell F, Schuch JB, Sordi AO, Kessler FHP. 2020. Pandemic fear” and COVID-19: mental health burden and strategies. Braz J Psychiatry. 42(3):232–235.
- Patterson C, Hogan L, Cox M. 2019. A comparison between two retrospective alcohol consumption measures and the daily drinking diary method with university students. Am J Drug Alcohol Abuse. 45(3):248–253.
- Pfefferbaum B, North CS. 2020. Mental health and the Covid-19 pandemic. N Engl J Med. 383(6):510–512.
- Probst C, Kilian C, Sanchez S, Lange S, Rehm J. 2020. The role of alcohol use and drinking patterns in socioeconomic inequalities in mortality: a systematic review. Lancet Public Health. 5(6):e324–e332.
- Raffaelli Q, Mills C, Christoff K. 2018. The knowns and unknowns of boredom: a review of the literature. Exp Brain Res. 236(9):2451–2462.
- Ramalho R. 2020. Alcohol consumption and alcohol-related problems during the COVID-19 pandemic: a narrative review. Australas Psychiatry. 28(5):524–526.
- Rehm J, Kilian C, Ferreira‐Borges C, Jernigan D, Monteiro M, Parry CDH, Sanchez ZM, Manthey J. 2020. Alcohol use in times of the COVID 19: Implications for monitoring and policy. Drug Alcohol Rev. 39(4):301–304.
- Rodriguez LM, Litt DM, Stewart SH. 2020. Drinking to cope with the pandemic: the unique associations of COVID-19-related perceived threat and psychological distress to drinking behaviors in American men and women. Addict Behav. 110:106532.
- Royston P. 2004. Multiple imputation of missing values. Stata J. 4(3):227–241.
- Ruisoto P, Contador I. 2019. The role of stress in drug addiction. An integrative review. Physiol Behav. 202(January):62–68.
- Scharoun-Lee M, Adair LS, Kaufman JS, Gordon-Larsen P. 2009. Obesity, race/ethnicity and the multiple dimensions of socioeconomic status during the transition to adulthood: a factor analysis approach. Soc Sci Med. 68(4):708–716.
- Schenker N, Taylor JMG. 1996. Partially parametric techniques for multiple imputation. Comput Stat Data Anal. 22(4):425–446.
- Schlotz W, Yim IS, Zoccola PM, Jansen L, Schulz P. 2011. The Perceived Stress Reactivity Scale: measurement invariance, stability, and validity in three countries. Psychol Assess. 23(1):80–94.
- Schmits E, Glowacz F. 2021. Changes in alcohol use during the COVID-19 pandemic: impact of the lockdown conditions and mental health factors. Int J Ment Health Addict. 20(2):1147–1158.
- Stephens MAC, Wand G. 2012. Stress and the HPA axis: role of glucocorticoids in alcohol dependence. Alcohol Res Curr Rev. 34(4):468–483.
- Strickland JC, Johnson MW. 2021. Rejecting impulsivity as a psychological construct: a theoretical, empirical, and sociocultural argument. Psychol Rev. 128(2):336–361.
- Struk AA, Scholer AA, Danckert J. 2016. A self-regulatory approach to understanding boredom proneness. Cogn Emot. 30(8):1388–1401.
- Tabachnick BG, Fidell LS. 2014. Using multivariate statistics. 6th ed. London: Pearson Education Limited.
- The World Bank. 2020. Adjusted net national income per capita (current US$). https://data.worldbank.org/indicator/NY.ADJ.NNTY.PC.CD.
- Tovmasyan A, Monk RL, Qureshi A, Bunting B, Heim D. 2022. Affect and alcohol consumption: an ecological momentary assessment study during national lockdown. Exp Clin Psychopharmacol.
- Tran TD, Hammarberg K, Kirkman M, Nguyen HTM, Fisher J. 2020. Alcohol use and mental health status during the first months of COVID-19 pandemic in Australia. J Affect Disord. 277:810–813.
- Twigg L, Moon G. 2013. The spatial and temporal development of binge drinking in England 2001–2009: an observational study. Soc Sci Med. 91:162–167.
- United Nations. 2020. Standard country or area codes for statistical use (M49). https://unstats.un.org/unsd/methodology/m49/.
- Verardi V, Dehon C. 2010. Multivariate outlier detection in Stata. Stata J. 10(2):259–266.
- Voon V, Grodin E, Mandali A, Morris L, Doñamayor N, Weidacker K, Kwako L, Goldman D, Koob GF, Momenan R. 2020. Addictions NeuroImaging Assessment (ANIA): towards an integrative framework for alcohol use disorder. Neurosci Biobehav Rev. 113(March):492–506.
- Wardell JD, Kempe T, Rapinda KK, Single A, Bilevicius E, Frohlich JR, Hendershot CS, Keough MT. 2020. Drinking to cope during COVID-19 pandemic: the role of external and internal factors in coping motive pathways to alcohol use, solitary drinking, and alcohol problems. Alcohol Clin Exp Res. 44(10):2073–2083.
- Watson R, Harvey K, McCabe C, Reynolds S. 2020. Understanding anhedonia: a qualitative study exploring loss of interest and pleasure in adolescent depression. Eur Child Adolesc Psychiatry. 29(4):489–499.
- Wegner L, Flisher AJ. 2009. Leisure boredom and adolescent risk behaviour: a systematic literature review. J Child Adolesc Ment Health. 21(1):1–28.
- White A, Castle IP, Chen CM, Shirley M, Roach D, Hingson R. 2015. Converging patterns of alcohol use and related outcomes among females and males in the United States, 2002 to 2012. Alcohol Clin Exp Res. 39(9):1712–1726.
- White IR, Royston P, Wood AM. 2011. Multiple imputation using chained equations: issues and guidance for practice. Stat Med. 30(4):377–399.
- Williams BTR, Drummond DC. 1994. The alcohol problems questionnaire: reliability and validity. Drug Alcohol Depend. 35(3):239–243.
- Yu M, Tatalovich Z, Gibson JT, Cronin KA. 2014. Using a composite index of socioeconomic status to investigate health disparities while protecting the confidentiality of cancer registry data. Cancer Causes Control. 25(1):81–92.