
Abstract
Gaming-related health problems have been researched since the 1980s with numerous different ontologies as reference systems, from self-assessed ‘game addiction’ to ‘pathological gambling’ (in the Diagnostic and Statistical Manual of Mental Disorders [DSM]-IV), ‘internet gaming disorder’ (in the third section of the DSM-5) and most recently ‘gaming disorder’ (in the International Classification of Diseases [ICD]-11). Our goal was to investigate how screening instruments that derive from different ontologies differ in identifying associated problem groups. By using four central screening instruments, each representing a different ontological basis, we hypothesized differences and similarities in prevalence, overlap, and health. A nationally representative (N = 8217) sample of Finnish participants was collected. The screening instruments produced significantly different prevalence rates (from 0.4% to 6.9%) and the binomial probabilities of group overlap ranged from poor (0.419) to good (0.919). Expectedly, the problem groups had lower mental health than the general population, yet exploratory analyses implied equivalent or significantly higher physical health. We also found strong exploratory evidence for mischievous responding to complicate the measurement of gaming problems. Considering that several major differences were confirmed between the four gaming problem constructs, we recommend researchers to clearly define their construct of interest, i.e. whether they are studying the ICD-11 based official mental disorder, the DSM-5 proposed ‘internet gaming disorder’, or other gaming problems—especially in future meta-analyses.
Introduction
A lot of scientific effort has recently been invested in studying the relationship between technology use and wellbeing. A key theme in this research are the suggested mental disorders related to technology use, which outside diagnostic manuals are often discussed as ‘addictions’, such as ‘social media addiction’. At the time of writing, one technology-related disorder has received approval from the World Health Organization (WHO): in 2019, ‘gaming disorder’ was confirmed to be included in the International Classification of Diseases (ICD-11) as a disorder due to addictive behaviors. Unlike the WHO, the American Psychiatric Association (APA) decided not to include such disorders for diagnosis in their Diagnostic and Statistical Manual of Mental Disorders (DSM-5), because the literature ‘suffers from a lack of a standard definition from which to derive prevalence data [and] understanding of the natural histories of cases’ (APA Citation2013, p. 796). ‘Internet gaming disorder’ was listed in the third section of DSM-5 as needing more research.
Despite ‘gaming disorder’ now being part of the ICD-11, the problems addressed by the APA—how to identify and epidemiologically measure those with clinically significant problems—remain debated. Henceforth, we use gaming-related health problems (GRHPs) as a reference to all constructs (‘videogame addiction’, ‘gaming disorder’, etc.) that relate to adverse mental, physical, and social aspects of gaming. A recent review of English GRHP screening instruments found 32 unique scales (King et al. Citation2020), and the scholars concluded five of them—including GAS7 (Game Addiction Scale: Lemmens et al. Citation2009) and IGDT10 (Internet Gaming Disorder Test: Király et al. Citation2017)—to have high evidential support. A later review found the prevalence rates of these five instruments to range from less than 1% to more than 14% in different age groups (Stevens et al. Citation2021). Despite scholars’ continuous attempts to make sophisticated epidemiological estimations, the fundamental problem remains unsolved: with at least 32 English screening tools that derive from diverse ontological grounds, what varies may not only be the prevalence rates, but also the GRHP constructs that are being measured (Online Appendix 0). For instance, GAS7 is based on the definition of pathological gambling in the DSM-IV (seven symptoms four of which must be present), whereas IGDT10 is based on ‘internet gaming disorder’ in the DSM-5 (nine symptoms five of which must be present). After ‘gaming disorder’ was confirmed to be included in the ICD-11, new instruments now rely on the WHO’s ontology: three novel criteria that must all be met for establishing a diagnosis. Taken together, these differences reflect two dimensions of ontological diversity:
What criteria define the disorder? E.g. the DSM-5 and the ICD-11 list different criteria.
How criteria define the disorder? E.g. the DSM-5 disorder is diagnosable when some criteria are met, but the ICD-11 demands meeting all criteria.
Previous research has found many participants who express GRHP symptoms based on the DSM-5 not to have general health problems (Carras and Kardefelt-Winther Citation2018), whereas some scholars further distinguish between the degrees to which criteria, symptoms, and health problems manifest (Myrseth and Notelaers Citation2018). Such investigations imply that it could be useful to distinguish more than one (not necessarily diagnostic) GRHP constructs. Accordingly, our research question is:
RQ: How do screening instruments that derive from different ontological understandings differ in identifying GRHP groups?
The research question is investigated from three perspectives—prevalence, overlap, and health—which form three sub research questions.
RQA: How do GRHP screening instruments that derive from separate ontological understandings differ in their prevalence rates (how many)?
RQB: How do GRHP screening instruments that derive from separate ontological understandings differ in who they identify (what characteristics)?
RQC: How do GRHP screening instruments that derive from separate ontological understandings differ in the health of their identified groups (how healthy)?
To formulate informed hypotheses, we carried out a pilot (N = 1000) by using four central GRHP screening instruments with separate ontological foundations.
Game Addiction Scale (GAS7) (Lemmens et al. Citation2009)
based on pathological gambling, as defined in the DSM-IV.
Internet Gaming Disorder Test (IGDT10) (Király et al. Citation2017)
based on ‘internet gaming disorder’, as defined in the DSM-5.
Gaming Disorder Test (GDT) (Pontes et al. Citation2021)
based on ‘gaming disorder’, as defined in the ICD-11.
Problem Gaming Test (THL1) (Salonen and Raisamo Citation2015)
based on Self-assessed gaming problems.
Whereas all the above instruments measure GRHPs, the discrepancies in the above-cited literature imply that the construct(s) being measured might not be a single entity, but plural. Although our methods cannot investigate the clinical or etiological nature of these potentially multiple constructs, we can seek evidence for the multiplicity of the measured construct(s). Thus, we use ‘constructs’ as references to those latent entities, which are shared by the (expectedly) different four groups identified by each of the four instruments, respectively. Accordingly, our study pursued evidence for an improved conceptual organization of what the ICD-11 and many scholars today refer to as a single construct, ‘gaming disorder’.
The current epidemiological and historical understandings of ‘gaming disorder’ are based on a long lineage of research throughout which multiple GRHPs have been treated as one and the same construct. In practice, studies on the literal ‘gaming disorder’ (by the ICD-11) draw from the literature on ‘internet gaming disorder’ (in the DSM-5), which in turn was built on studies of ‘gaming addiction’ (pathological gambling in the DSM-IV) and others, such as ‘problem gaming’, that vary in their ontology by each study and research team. Sound evidence for this issue are the epidemiological reviews, which systematically mix gambling-based (DSM-IV), internet-based (DSM-5), general (ICD-11), and other ontologically diverse findings of GRHPs (e.g. Stevens et al. Citation2021). If we find evidence for our four ontologically diverse instruments to be similar in how they operate, this supports the single-construct idea of ‘gaming disorder’ (which may manifest in many ways, ). If the instruments differ in how they operate, this indicates that efforts should be directed toward assessing the clinical (ir)relevance of multiple constructs ().
Figure 1. Four example scenarios where GRHP screening instruments identify overlapping groups.
Note. On the left: an example scenario where four screening instruments identify four different sized groups and they all capture the same construct on different severity levels (e.g. GD-1: severe problems, GD-4: mild problems). Left middle: an example scenario where four screening instruments identify four different sized groups and they all capture different domains of the construct (e.g. GD-A: mental health problems, GD-B: physical health problems, GD-C: social health problems, GD-D: other problems). Right middle: an example scenario where four screening instruments identify four different sized groups of which one involves GRHPs (e.g. GD-1: mixed health problems, other identified groups not related health problems). On the right: an example perfect scenario where four screening instruments identify one and the same group. The examples are not exhaustive, and the identified groups need not overlap.
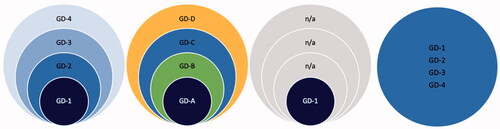
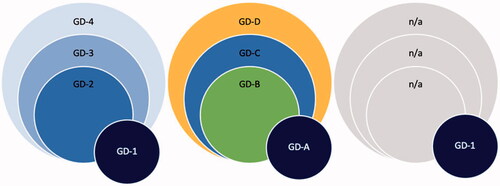
Figure 2. Three example scenarios where one screening instrument identifies a group with marginal overlap.
Next, we introduce our hypotheses, which are specified in the Methods section. Based on the recurring findings that show prevalence rates of GRHPs to vary along with the instruments (e.g. Stevens et al. Citation2021), we expected our ontologically distinct instruments to produce meaningfully different prevalence rates (Online Appendix 1).
Primary hypotheses, high confidence.
H1: We expect the ICD-11 and DSM-5 based GRHP prevalence rates to be meaningfully lower than the DSM-IV and Self-assessmentFootnote1 based prevalence rates.
H1a: We expect the ICD-11 based prevalence rate to be meaningfully lower than the DSM-IV based prevalence rate.
H1b: We expect the ICD-11 based prevalence rate to be meaningfully lower than the Self-assessment based prevalence rate.
H1c: We expect the DSM-5 based prevalence rate to be meaningfully lower than the DSM-IV based prevalence rate.
H1d: We expect the DSM-5 based prevalence rate to be meaningfully lower than the Self-assessment based prevalence rate.
The prevalence rate tells us how many people are identified, but it tells little about overlap—who are identified. In practice, two identical prevalence rates could identify two entirely different groups of people. For instance, Starcevic et al. (Citation2020) assessed 100 individuals who sought treatment for GRHPs and found 36 met both ‘gaming disorder’ and ‘internet gaming disorder’ criteria, whereas additionally 25 met only the latter. Likewise, Ko et al. (Citation2020) carried out diagnostic interviews with 69 individuals who met the ‘internet gaming disorder’ criteria and found 44 of them also met the ‘gaming disorder’ criteria (cf. ). We did not find clinical studies between ‘game addiction’ (DSM-IV pathological gambling based) and the later ‘internet gaming disorder’ (DSM-5) and ‘gaming disorder’ (ICD-11); however, our pilot data indicated that the latter two also meet the DSM-IV based criteria. We hence expect our three related instruments to identify similarly overlapping groups. The overlap of Self-assessment based problems is reported exploratively.
Secondary hypotheses, medium confidence.
H2: We expect ICD-11, DSM-5, and DSM-IV based GRHPs to overlap. Those who meet the ICD-11 criteria also meet the DSM-5 criteria, and both above additionally meet the DSM-IV based criteria.
H2a: Those who meet the ICD-11 criteria also meet the DSM-5 criteria.
H2b: Those who meet the ICD-11 and DSM-5 criteria also meet the DSM-IV based criteria.
Finally, we are interested in whether some groups are healthier than others. Because ‘gaming disorder’ is conceptualized as a mental disorder, we expect those identified by related screening tools to have lower mental health scores than the general population. Previous findings also imply similar patterns regarding physical health (Puolitaival et al. Citation2020). Due to the small prevalence rates acquired in our pilot study (Online Appendix 1), we expect not to have sufficient power to compare health in ICD-11 and DSM-5 based constructs at Stage 2. Thus, we set a hypothesis on the other two constructs alone. As our pilot gave mixed evidence on the health of those with Self-assessed gaming problems, we set competing H0s.
Tertiary hypotheses, mild confidence.
H3: We expect those with DSM-IV and Self-assessment based GRHPs to have (equally) lower health in comparison to the general population.
H3a: We expect those with DSM-IV based GRHPs to have meaningfully lower mental or physical health in comparison to the general population.
H3b/H0: We expect those who Self-assess that they have gaming problems to have meaningfully lower mental or physical health in comparison to the general population.
H3c/H0: We expect the mental and physical health of those with DSM-IV and Self-assessment based GRHPs to be meaningfully different.
Methods
This study received a positive appraisal from the Human Sciences and Ethics Committee of University of Jyväskylä in 2021. The research was carried out according to the Finnish National Board on Research Integrity guidelines and the Helsinki Declaration with its later amendments.
Sampling
The data were collected with Bilendi, i.e. respondents were invited remotely from the company’s 2.2 M panel of participants (Online Appendix 1). Our plan to collect a nationally representative Finnish sample (N ≈ 8000) was successful: we recruited 8217 respondents as representative of gender (women = 4130, men = 4070), region (East = 797, South = 3662, West = 2831, North = 927), and age (M = 48.60, SD = 18.18). We included two control questions (Oppenheimer et al. Citation2009) in the survey and Bilendi removed those responses that failed both (i.e. not included in N = 8217). Additionally, participants who reported not having played videogames within the past six months did not fill out GRHP instruments, and they were considered not having GRHPs. The order of the screening instruments was randomized.
H1. Our sample size calculation for the estimated prevalence rates was based on precision (see Rothman and Greenland Citation2018). We calculated the required sample size of 7668 participants based on the 95% confidence interval around the point estimate 0.2, which corresponds with the smallest prevalence rate in the pilot (GDT). Thus, N ≈ 8000 was a rational target sample size for precise prevalence analysis and comparison.
H2. Sample size derived from H1.
H3. The sample size requirement for H3a–b was based on power analysis for the Welch t-test (one-sided). For the desired power level of 0.9, alpha set to 0.025 (using multiple comparison correction), and the expected sizes of the groups (GAS7 = 712; 8.9%; THL1 = 1104; 13.8%) when the target sample size is N = 8000, we would have had power to reliably detect d = 0.127 and d = 0.105, respectively. This meets our smallest effect size of interest (d = 0.22). We only make inferences based on the effects that are reliably detectable by the identified groups. The sample for H3c derives from sensitivity analysis for the Welch t-test (two-sided). Based on the 95% confidence intervals of the above prevalence, sensitivity analysis with the desired power level of 0.9 and alpha set to 0.025 showed that we would be able to reliably detect d = 0.185 or d = 0.155, respectively. The code is available at: https://osf.io/6fqm5/
Design
H1. Among adolescents, GRHPs have been found to be more common than in older groups (e.g. Stevens et al. Citation2021). Due to the sample including individuals younger than 18, we expected our adult pilot data prevalence rates to be lower. We had no reason to believe this to notably influence the ratios between the prevalence rates of the four instruments. We expected the differences between the prevalence rates to cohere with those in the pilot (Table 1 in Online Appendix 1) so that the proportions identified by ICD-11 and the DSM-5 based instruments are meaningfully smaller than those identified by DSM-IV and Self-assessment based instruments (H1a–d). To test the hypotheses, we used an interval-based method, as described in Dienes (Citation2021) (see Neyman and Pearson Citation1933). We set the H0 critical region (null corroboration) to the lower bound of 95% CI in the smallest obtained prevalence rate and the H1 acceptance region twice above the upper bound of 95% CI in that prevalence rate. The range between these intervals represents an inconclusive region of doubt. If the 95% confidence intervals of the H1a–d effects (differences between prevalence rates) overlap mainly with the H0 or the H1 interval, the hypotheses are corroborated, respectively. If the 95% confidence intervals of the effects (differences between prevalence rates) overlap mainly with the region of doubt, neither H0 nor H1 will be corroborated. H1a–d corroborations support the position that ICD-11 and DSM-5 based constructs differ from DSM-IV and Self-assessment based gaming problem constructs in terms of prevalence. Due to lacking pilot support for ICD-11 and DSM-5 prevalence differences, we did not set a hypothesis regarding them but report that exploratively. If H0 is corroborated one or more times, this supports the position that the DSM-IV and/or Self-assessment based gaming problem constructs are similar to ICD-11 and/or DSM-5 based ones, prevalence-wise.
Table 1. Prevalence rates and their differences.
H2. From previous clinical studies, we found only ICD-11 and DSM-5 based GRHPs analyzed comparatively. These studies found 60% (Starcevic et al. Citation2020) and 64% (Ko et al. Citation2020) of ‘internet gaming disorder’ (DSM-5) patients also meeting the ‘gaming disorder’ (ICD-11) criteria, and all the latter meeting all the former. Our pilot found no overlap between the individuals in the ICD-11 and DSM-5 criteria meeting groups. The conflict could be explained by our pilot sample size (Figure A in Online Appendix 1). It is also known that the content differences between the available screening instruments are large (Karhulahti et al. Citation2021), thus some of these discrepancies could be explained by the properties of GDT and IGDT10 scales. We thus followed the clinical literature in our hypotheses, in addition to which we expected both the ICD-11 and DSM-5 criteria meeting groups to meet the DSM-IV based cutoff, based on the pilot data: P(DSM-5|ICD-11)≈1 and P(DSM-5 + ICD-11|DSM-IV)≈1. Because mischievous responding, among similar biases, is a known problem in survey research, we controlled Type 2 error. In gaming research, Przybylski (Citation2016) found mischievous responding alone to account for up to 2.27% of respondents, indicating that among those who meet ICD-11 criteria (N = 8000 × 0.2 ≈ 16), a false response is not unlikely to occur. Therefore, we allowed variation by the lower bound of the binomial probability 50% confidence interval for the conditional probability P = 1 (n = 16/16; 0.917, 1). This control allows, for example, one ICD-11 criteria meeting respondent to not meet the DSM-5 criteria without undermining the hypothesis (in the example of ICD-11 = 16; 0.917, 1). If the obtained sample of ICD-11 criteria meeting group meets P(ICD-11|DSM-5)>0.917, we consider H2a corroborated and this as evidence for the ICD-11 and DSM-5 based constructs to overlap. For null testing, we set the binomial probability confidence interval at 95% for the conditional probability P = 1 (n = 16/16; 0.794, 1). If the sample of GDT criteria meeting participants meets P(ICD-11|DSM-5)<0.794, we consider H0 corroborated and this as evidence for the ICD-11 and DSM-5 based constructs to be different by overlap. We repeat the process with the same logic regarding ICD-11–DSM-IV and DSM-5–DSM-IV (H2b). Empirical support for overlap can mean that the constructs consist of similar health problems (of different degree), different kinds of health problems, or no health problems (). Empirical support for lacking overlap can mean that the constructs are partially or entirely different ().
H3. We planned to apply PROMIS Global Physical Health (GPH-2) and Global Mental Health (GMH-2) scales for investigating health (Hays et al. Citation2017). The United States based reference values for physical health are 42–50 (good) and 35–41 (fair); for mental health the values are 40–48 (good) and 28–40 (fair) (PROMIS Citation2021; Hays et al. Citation2015). When measured with GPH-2 in the pilot, the Finnish working population had mean value 44.2 whereas the value for the individuals meeting DSM-IV based criteria was 42.5. With GMH-2, the values were 47.0 for the general working population and 44.5 for the DSM-IV based criteria meeting group. A one-way analysis of variance (ANOVA) test showed that there was a statistically significant difference between both physical health (F[1, 998] = 4.66, p < .05, Cohen’s d = 0.23, 95% CI [0.14, 0.33]) and mental health (F[1,998] = 8.53, p < .01, Cohen’s d = 0.32, 95% CI [0.22, 0.41]). Even small effects can be relevant if adverse health scenarios prolong over multiple years (Funder and Ozer Citation2019). Hence, we set our smallest effect size of interest to d = 0.22 (the lowest 95% CI in the pilot; clear change in reference value). If either the mental or physical health of the DSM-IV and Self-assessment based groups is significantly (d ≥ 0.22 at alpha 0.025) lower than that of the general population, we consider H3a/H3b corroborated. If corroborated, we consider that as theoretical evidence for the Self-assessment or DSM-IV based constructs linking to lower health. If neither mental nor physical effects are significant or below d = 0.22, we consider H3a/H3b not supported and continue with equivalence testing (Lakens Citation2017) to assess null support. As we did not find strong pilot evidence for H3c (Online Appendix 1), we set H0 as a competing hypothesis. In H3c, we assess the difference between the DSM-IV and Self-assessment groups. A significant effect (d ≥ 0.22 at alpha 0.025) is interpreted as support for the multiplicity of constructs health-wise. H0 is a competing hypothesis, and its corroboration is interpreted as evidence for construct similarity, health-wise.
Analysis plan
H1. We planned to calculate the prevalence rates with 95% confidence intervals for each of the four instruments. As the ontology of each diagnostic manual is linked to their recommended cutoffs (second dimension in Introduction), we follow their recommendations (Online Appendix 1). We apply the method described by Dienes:
If the CI lies mainly in the H0 interval and the remaining minority only in the grey interval, one could accept H0; similarly, if the CI lies mainly in the H1 interval and the remaining minority only in the grey interval, accept H1; otherwise more data are needed. (2021, p. 9)
We set the H0 interval (null corroboration region) to the lower bound of 95% CI in the smallest obtained prevalence rate and the H1 interval (alternative acceptance region) twice above the upper bound of 95% CI in that prevalence rate. Because assessing what ‘endorsement’ of items means is not straightforward (Connolly et al. Citation2021), we report Self-assessment (THL1) exploratively by using different endorsement criteria.
H2. The results regarding cutoff overlap are presented descriptively based on the above analyses. For H2, we test group overlap against conditional probability P > 0.917. The null is tested against conditional probability P < 0.714.
H3a–b. We compare the means of mental (GMH-2) and physical (GPH-2) health between the DSM-IV based group and the rest of the sample (one-tailed Welch t-test). This is repeated with Self-assessment. Because mental and physical health are measured separately, we carry out the test twice with a corresponding alpha level 0.025 (multiple comparison correction). Equivalence testing is carried out using the TOST two function for an independent t-test (TOSTER package). Exploratively, we repeat the analyses with two general population groups: gaming and non-gaming. We set our equivalence bounds by the same smallest effect size of interest (d = 0.22) and report the smaller test statistic. We follow the above in H3c and use THL1 cutoff 2/4 in concordance with GAS7 wording (‘sometimes’).
Results
H1. The prevalence rates (N = 8217) with 95% confidence intervals are presented in .
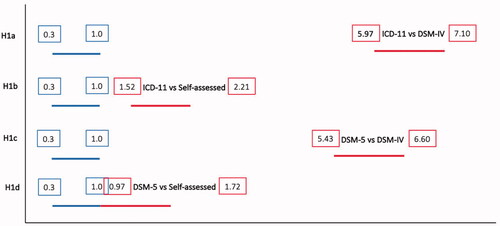
For all H1a–d, we set null regions to the lower 95% CI bound of the smallest prevalence rate (0.3), and the acceptance region twice as high as the higher 95% CI bound (2 × 0.5 = 1.0). All four hypotheses were corroborated (). We conclude that each of the four GRHP construct comparisons imply difference in terms of prevalence.
Figure 3. Null regions (left) against the effects of compared constructs (right) in H1.
H2. To test construct overlap, we calculated binomial probabilities for the groups (). We set the null to binomial probability 0.794 and the acceptance binomial probability to 0.917. In H2a, the null was supported (DSM-5|ICD-11). In H2b, the first part was undecided (ICD-11|DSM-IV), and in the second, alternative hypothesis corroborated (DSM-5|DSM-IV).
Table 2. Binomial probabilities for overlap when comparing participants in respective construct groups.
H3.Footnote2 We set competing alternative and null hypotheses regarding the lower health of DSM-IV and Self-assessment based groups, in comparison to the general population.
In H3a, the DSM-IV group (M = 43.65, SD = 8.76) had lower mental health than the general population (M = 46.98, SD = 8.00), t(639.27) = 8.812, p < .001, d = 0.40, 95% CI (0.30, 0.49). This exceeded our smallest effect size of interest, corroborating the alternative hypothesis.
We did not find a significant difference in physical health between the DSM-IV group (M = 3.07, SD = 1.15) and the general population (M = 3.05, SD = 0.998), t(632.34) = −0.42, p = .67, d = −0.02, 95% CI (−0.11, 0.06). Equivalence testing revealed that the effect is statistically equivalent, as both p values in two one-sided tests were below 0.05, t(632.05) = 4.37, p < .01.
In H3b, the Self-assessed problems group (M = 45.01, SD = 8.04) had lower mental health than the general population (M = 47.0, SD = 8.08), t(1354.2) = 7.48, p < .001, d = 0.25, 95% CI (0.18, 0.31). Again, this effect size corroborated the alternative hypothesis.
We did not find a significant difference in physical health between the Self-assessed problems group (M = 3.04, SD = 1.06) and the general population (M = 3.05, SD = 1.01), t(1314) = 0.49, p = .62, d = 0.02, 95% CI (−0.05, 0.08). Equivalence testing revealed that the effect was statistically equivalent, as both p values in two one-sided tests were below 0.05, t(1320.62) = −6.19, p < .01.
In H3c, the Self-assessed problems group (M = 45.53, SD = 7.65) had higher mental health than the DSM-IV group (M = 43.02, SD = 8.93), t(308.06) = 3.68, p < .001, d = 0.30, 95% CI (0.14, 0.48). This result was reached when excluding participants who met both cutoffs. When not doing so (i.e. some participants belonged to both groups), the Self-assessed problems group (M = 45.01, SD = 8.04) still had higher mental health than the DSM-IV group (M = 43.65, SD = 8.76), t(1085.1) = 3.06, p = .002, d = 0.16, 95% CI (0.06, 0.26), but the effect did not meet our smallest effect size of interest. We continued with equivalence testing, which revealed that the effect was not statistically equivalent because the larger p value was higher than 0.05, t(1084.9) = −1.10, p = .135.
We did not find a significant difference in physical health between the Self-assessed problems group (M = 3.00, SD = .99) and the DSM-IV group (M = 3.00, SD = 1.08), t(1314) = −.04, p = .97, d < 0.01, 95% CI (−0.16, 0.15). The effect was statistically equivalent; both p values were below 0.05, t(323.22) = ±2.72 (identical negative/positive), p < .01. This result was reached when excluding participants who met both cutoffs. Similar results were reached when not doing so: the effect was statistically equivalent, as both p values were below .05, t(1088.83) = 3.65, p < .01.
Exploratory analyses
As some of the results were unexpected, we were curious if careless or mischievous responding could explain some of them. The survey included two control items, and those who failed both were not included in the final dataset. Thus, we decided to investigate exploratively how many respondents who report having GRHPs failed the first control item (‘Please select often as a response to this question. This is a control question, which is used to verify that you are not a robot’). The results show that the more problems people report, the more they also fail the control (). For instance, the four response options in THL1 illustrate how control failures increase from 0.1% and 2.3% to 12.8% and, finally, all the way up to 22.7%. Although we cannot make claims about causality, the result is consistent with mischievous responding, i.e. people intentionally inflating extreme responses. Confirmatory research is needed to properly investigate the issue. We exploratively reanalyzed all hypotheses without the participants who failed the first control, and this did not change any results (Online Appendix 3).
Table 3. Participants who failed the first control question but passed the second one (and were included).
As exploratory analyses related to H3a–b, we additionally compared the mental and physical health of DSM-5, ICD-11, and THL1 (at least ‘often’) based participants to the general population. These analyses were repeated with three different ‘general population’ types: all participants (general), those who had played at least once over the past six months (general gaming), and those who had not played at all over the past six months (general non-gaming). H3a–b, which were tested as confirmatory with the former type, were also exploratorily reproduced with the latter two types. We also fully reproduced H3c with the THL1 criteria ‘often’ (and ‘almost always’). All analyses are reported in . Power for the exploratory analyses is reported by power curve (Online Appendix 4).
Table 4 . All H3-related exploratory analyses.
The exploratory analyses regarding the mental health of gaming and non-gaming populations did not yield any meaningful differences. On the other hand, while we did find the ICD-11 based group having significantly lower mental health than the general population, we could not find this effect in the DSM-5 based group. This implies a construct difference in terms of mental health, but confirmatory research is needed to corroborate it. Following the above, we did not find meaningful differences in physical health between the ICD-11 based group and the general population; however, both the DSM-5 based group and the Self-assessed problems (at least ‘often’) group reported significantly higher physical health than the general population. These surprising exploratory findings naturally call for confirmatory research as well.
Discussion
Our findings show that ICD-11 based, DSM-5 based, DSM-IV based, and Self-assessment based measures for ‘gaming-related health problems’ (GRHPs) identify different groups of people, which implies that different problems (or other different constructs) are being measured, to different degrees. This generally supports the premise that the multiple ontologically different constructs, which have been used synonymously as a reference to gaming disorder (or addiction), should not be mixed. Some constructs also had similarities, which we discuss below.
The first hypotheses (H1) brought confirmatory evidence for prevalence differences in all four comparisons. The prevalence rates ranged from 0.4% (ICD-11) to 6.9% (DSM-IV), which means that one scale provided an estimate that is more than 17 times larger than another scale. On the other hand, no less than 12.6% of the participants Self-assessed having problems with gaming at least ‘sometimes’. Evidently, many people have some problems with gaming sometimes, but this should not be confused with the prevalence of related mental disorders. The persistent challenges of distinguishing everyday problems and healthy intensive use from diagnostic constructs remain prevalent (see Andrews et al. Citation2015). Future studies, with clinically validated scales, will hopefully be able to assess what the prevalence rates for gaming disorder (as a mental disorder) are.
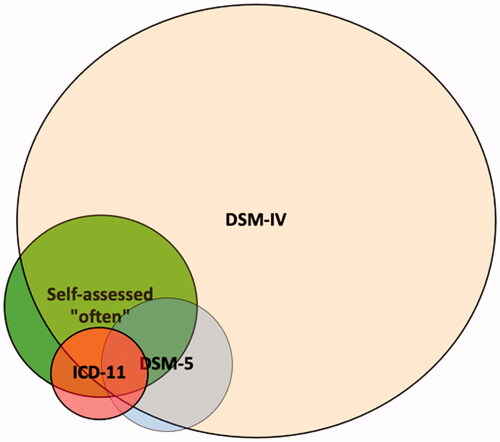
We did not hypothesize about the prevalence difference between ICD-11 (0.4%) and DSM-5 (0.9%), but the second hypothesis (H2) yielded counterevidence against the ICD-11 and DSM-5 based constructs being similar: more than half of the ICD-11 group did not meet the DSM-5 criteria. On the other hand, a significant proportion of the DSM-5 group also met the DSM-IV based criteria, which implies a difference in degree rather than kind ().
Figure 4. A model of the prevalence rates and overlap of all four measured constructs.
Finally, our hypotheses regarding health (H3) were generally supported, i.e. both DSM-IV and Self-assessment based problem groups had meaningfully lower mental health levels than the general population. We also found a significant difference between the two constructs, but the effect was not large enough (d > 0.22) to be meaningful. Our interpretation is that the constructs are distinct health-wise in relation to the general population, but the data do not allow us to make claims regarding meaningful differences or equivalence between them. The findings regarding physical health were both different and similar: the DSM-IV group and those who Self-assess having problems (at least) ‘often’ had equivalent physical health with the general population and each other; namely, the two constructs were similar in this respect, but also similar with the general population. Physical health does not seem play a major role in GRHPs.
In this study, we chose to use the officially suggested instrument cutoffs for analysis. Such cutoffs generally represent the diagnostic relevance in individual cases, and thus allowed us to compare the prevalence, overlap, and health of the identified groups as proxies for constructs like ‘gaming disorder’ (ICD-11) and ‘internet gaming disorder’ (DSM-5). We did not, however, investigate other aspects, such as the dimensions across measured symptoms and problems or alternative cutoffs by sensitivity, except for both ‘sometimes’ and ‘often’ with THL1 (see Regier et al. Citation2004; Kessler et al. Citation2004). To chart further ontological differences and similarities between constructs and/or instruments, it would be possible to compare, for instance, instrument-specific factor structures or item-based network models (e.g. Adamkovič et al. Citation2022; Liu et al. Citation2022). Researchers could also explore the standardization of cutoffs (de Beurs et al. Citation2021); however, due to the major differences between ontological systems, such as monothetic and polythetic premises, this could compromise the core criteria by which different constructs define themselves. As our data are open for secondary analysis, anyone willing to pursue the above avenues is encouraged to do so.
Taken together, our findings add to the rapidly accumulating literature on the fuzziness of technology use constructs. For instance, Davidson et al. (Citation2022) recently compared measures such as those of smartphone addiction, social networking addiction, and internet gaming disorder, and found them all to be reducible to a single component (despite claims to measure various diverse constructs). Although the design of our study was the opposite (investigating differences and similarities within one assumed construct), we further corroborate the fuzziness hypothesis: multiple significant differences manifest between constructs that all measure addictive gaming behaviors. In sum, while the current technology use scales of different constructs seem unable to distinguish themselves from others, the scales of addictive gaming behaviors—standardly studied as a single construct—seem unable to identify mutual groups with shared problems. Presently, the field appears incapable of managing both, construct differences and similarities. As these issues concern technology use research in general, it is possible that the rapid pace of technology development is not very suitable for measurement development, which tends to require time and patience in order to efficiently capture the complexity of human behavior constructs.
Limitations
Because of the incidence reported in Footnote 2, we could not carry out confirmatory analyses regarding physical health, and we had to settle with an exploratory single-item measure. That said, the item is a direct self-assessment of physical health, and we have no reasons to expect different results with the full scale: the correlation between our 1-item and the original 2-item PROMIS Global Physical Health was ρ = 0.75 in the pilot data. As to more in-depth research on physical health and gaming, we rather look forward to other methods, such as actual physical health tests, which can yield more accurate information. Related to the incident, the war in Ukraine may have affected the respondents at the time of survey. Nevertheless, because our design was comparative between related constructs, the potential effects applied to all constructs, and thus were unlikely to undermine the findings. Finally, we highlight that our study was limited to four instruments, i.e. one per each construct. Different instruments are likely to represent the same constructs in different ways, due to which possible future replications and other similar studies may consider adding new instruments. On the other hand, researchers might do better by investing their resources in explorative designs that map out the different types of problems and their unique contexts rather than continuing with the existing instruments, which seem to measure multiple unknown constructs (and/or construct dimensions).
Conclusions
Historically, gaming-related health problems have been studied through constructs such as ‘game addiction’, ‘internet gaming disorder’, and most recently, ‘gaming disorder’. Many of them derive from different ontological foundations that range from various diagnostic manuals and theories to simple self-assessment. In the present study, our goal was to investigate their differences, which were hypothesized due to different ontological foundations: ICD-11, DSM-5, and DSM-IV, and Self-assessment. Our findings lead us to conclude two things. First, we confirm that the constructs seem to be associated with lower mental health. Second, we confirm that there do not seem to be many other similarities between the constructs, i.e. despite their mutual capacity to predict lower mental health, they were found to be significantly different in terms of prevalence and/or overlap. Ultimately, we recommend researchers who are working with gaming-related health problems to
define their construct of interest, i.e. whether they are researching gaming disorder (as an ICD-11 mental disorder), problems related to gaming, or some other construct.
seek good evidence for construct validity, i.e. whether the instruments being used accurately represent the construct of interests, or something else.
Being able to give strong answers to both a and b will significantly improve research quality, enable the development of useful meta-analyses, and allow researchers to communicate with each other without the risk of confusing related yet different constructs.
Ethical approval
The research in this paper does not require ethics board approval.
Author contributions
Conceptualization: VMK, JV, RK, and MB. Data curation: JV and VMK. Formal analysis: JV, MMA, MMU, and MB. Funding acquisition: VMK, JV, MMU, RK, and MB. Investigation: VMK, JV, MMU, RK, and MB. Methodology: VMK, JV, MMA, MMU, and MB. Project administration: VMK. Resources: VMK and RK. Software: JV, MMA, MMU, and MB. Supervision: N/A. Validation: VMK, MMU, and MB. Visualization: VMK. Writing original draft: VMK. Writing review and editing: VMK, JV, MMA, MMU, RK, and MB.
Author note
This paper has been peer reviewed at PCI RR.
Citation: Karhulahti, V., Vahlo, J., Martončik, M., Munukka, M., Koskimaa, R., & von Bonsdorff, M. (2022). Ontological Diversity in Gaming Disorder Measurement: A Nationally Representative Registered Report. Addiction, Research & Theory. https://doi.org/10.31234/osf.io/qytrs
Stage 1 public registration: https://osf.io/usj5b
Submitted: 25 August 2021, In-principle acceptance: 17 January 2022
Stage 2 recommendation: https://rr.peercommunityin.org/articles/rec?id=209
Submitted: 23 May 2022, Recommended: 06 July 2022
Code, Data, and other Materials: The data are currently being processed in the Finnish Social Science Data Archive (FSD) and will be made available for scientific reuse there. The code, data, and other relevant materials are currently shared via the OSF (https://osf.io/v4cqd/) and the link will be updated after the FSD processing is completed.
Open Scholarship


This article has earned the Center for Open Science badges for Open Data, Open Materials and Preregistered through Open Practices Disclosure. The data and materials are openly accessible at https://osf.io/v4cqd/, https://osf.io/v4cqd/ and This is a RR, the full process with details and accepted Stage 1 is included in the MS / PCI RR. https://rr.peercommunityin.org/articles/rec?id=209. To obtain the author’s disclosure form, please contact the Editor.
Appendix
Download MS Word (1.4 MB)Acknowledgements
We thank Niko Männikko for sharing the Finnish translations of GAS7 and IGDT10 scales and Sari Castrén for assistance with other scales.
Disclosure statement
VMK is one of the PCI Registered Reports recommenders. JV is a CSO in Kinrate Analytics, which provides personalized game recommendations.
Additional information
Funding
Notes
1 All the applied instruments are self-assessment survey tools, but only one (THL1) asks the respondent to directly Self-assess their gaming problems.
2 As we were about to initiate data collection, the war in Ukraine started. Russia threatened to use nuclear weapons, and in Finland (where our participants are), for the first time in history, the support for joining NATO (North Atlantic Treaty Organization) outnumbered opponents. Although the past two years under COVID-19 had hardly been ‘normal’, the acute possibility of World War III implied that the mental health of our participants was not what it had been a bit earlier. The project schedule did not allow postponing data collection, but as an extra control measure, our team agreed to enlarge the survey with two additional measures: anxiety (validated Finnish translation of GAD-2: Kujanpää et al. Citation2014) and depression (validated Finnish translation of BDI-6: Aalto et al. Citation2012). To add further means for assessing the effects of the drastic world events, we also included a single item that asks the participants to self-report the negative mental health impact of the war in Ukraine. We did not contact the recommender about these additional measures, as they are not analyzed in this article, and they did not change any of the planned analyses. As a byproduct of these last-minute changes and several extra test iterations, however, a mistake occurred in our team and an erroneous GPH-2 item—PROMIS Global Health item #09 instead of #06, which is very similar in wording—ended up being included in the final survey. We noticed this soon after the data had been collected and immediately contacted the recommender who, after discussing with the managing board, advised us to proceed without confirmatory GPH-2 analysis in H3. We thus report physical health exploratively in this section with only one GPH-2 item (‘GPH-1’).
References
- Aalto AM, Elovainio M, Kivimäki M, Uutela A, Pirkola S. 2012. The Beck Depression Inventory and General Health Questionnaire as measures of depression in the general population: a validation study using the Composite International Diagnostic Interview as the gold standard. Psychiatry Res. 197(1-2):163–171.
- Adamkovič M, Martončik M, Karhulahti V, Ropovik I. 2022. Network structures of internet gaming disorder and gaming disorder: symptom operationalization causes variation. Preprint. https://doi.org/10.31234/osf.io/g3jpt.
- Andrews S, Ellis DA, Shaw H, Piwek L. 2015. Beyond self-report: Tools to compare estimated and real-world smartphone use. PLoS One. 10(10):e0139004.
- [APA] American Psychiatric Association. 2013. Diagnostic and statistical manual of mental disorders. 5th ed. Washington (DC): APA.
- Carras MC, Kardefelt-Winther D. 2018. When addiction symptoms and life problems diverge: a latent class analysis of problematic gaming in a representative multinational sample of European adolescents. Eur Child Adolesc Psychiatry. 27(4):513–525.
- Connolly T, Atherton G, Cross L, Piovesan A, Kaye LK. 2021. The Wild West of measurement: exploring problematic technology use cut off scores and their relation to psychosocial and behavioural outcomes in adolescence. Comput Human Behav. 125:e106965.
- Davidson BI, Shaw H, Ellis DA. 2022. Fuzzy constructs in technology usage scales. Comput Human Behav. 133:107206.
- de Beurs E, Boehnke JR, Fried E. 2021. Common measures or common metrics? A plea to harmonize measurement results. Preprint. https://doi.org/10.31234/osf.io/m4qzb.
- Dienes Z. 2021. Obtaining evidence for no effect. Collabra Psychol. 7(1):28202.
- Funder DC, Ozer DJ. 2019. Evaluating effect size in psychological research: sense and nonsense. Adv Methods Pract Psychol Sci. 2(2):156–168.
- Hays RD, Schalet BD, Spritzer KL, Cella D. 2017. Two-item PROMIS® global physical and mental health scales. J Patient Rep Outcomes. 1(1):2–5.
- Hays RD, Spritzer KL, Thompson WW, Cella D. 2015. US general population estimate for “excellent” to “poor” self-rated health item. J Gen Intern Med. 30(10):1511–1516.
- Karhulahti V, Martončik M, Adamkovic M. 2021. Measuring internet gaming disorder and gaming disorder: qualitative content validity analysis of validated scales. Assessment. https://doi.org/10.1177/10731911211055435.
- Kessler RC, Merikangas KR, Berglund P, Eaton WW, Koretz DS, Walters EE. 2004. For DSM-V, it’s the “disorder threshold”, stupid—reply. Arch Gen Psychiatry. 61(10):1051–1052.
- King DL, Chamberlain SR, Carragher N, Billieux J, Stein D, Mueller K, Potenza MN, Rumpf HJ, Saunders J, Starcevic V, et al. 2020. Screening and assessment tools for gaming disorder: a comprehensive systematic review. Clin Psychol Rev. 77:101831.
- Király O, Sleczka P, Pontes HM, Urbán R, Griffiths MD, Demetrovics Z. 2017. Validation of the Ten-Item Internet Gaming Disorder Test (IGDT-10) and evaluation of the nine DSM-5 internet gaming disorder criteria. Addict Behav. 64:253–260.
- Ko CH, Lin HC, Lin PC, Yen JY. 2020. Validity, functional impairment and complications related to Internet gaming disorder in the DSM-5 and gaming disorder in the ICD-11. Aust N Z J Psychiatry. 54(7):707–718.
- Kujanpää T, Ylisaukko-Oja T, Jokelainen J, Hirsikangas S, Kanste O, Kyngäs H, Timonen M. 2014. Prevalence of anxiety disorders among Finnish primary care high utilizers and validation of Finnish translation of GAD-7 and GAD-2 screening tools. Scand J Prim Health Care. 32(2):78–83.
- Lakens D. 2017. Equivalence tests: a practical primer for t tests, correlations, and meta-analyses. Soc Psychol Personal Sci. 8(4):355–362.
- Lemmens JS, Valkenburg PM, Peter J. 2009. Development and validation of a game addiction scale for adolescents. Media Psychology. 12(1):77–95.
- Liu D, Lemmens J, Hong X, Li B, Hao J, Yue Y. 2022. A network analysis of internet gaming disorder symptoms. Psychiatry Res. 311:114507.
- Myrseth H, Notelaers G. 2018. A latent class approach for classifying the problem and disordered gamers in a group of adolescence. Front Psychol. 9:2273.
- Neyman J, Pearson E. 1933. The testing of statistical hypotheses in relation to probabilities a priori. Math Proc Camb Phil Soc. 29(4):492–510.
- Oppenheimer DM, Meyvis T, Davidenko N. 2009. Instructional manipulation checks: detecting satisficing to increase statistical power. J Exp Soc Psychology. 45(4):867–872.
- Pontes HM, Schivinski B, Sindermann C, Li M, Becker B, Zhou M, Montag C. 2021. Measurement and conceptualization of gaming disorder according to the World Health Organization framework: the development of the Gaming Disorder Test. Int J Ment Health Addiction. 19(2):508–528.
- PROMIS. 2021. PROMIS® reference populations. Official instrument website. [accessed 2022 August 28]. https://www.healthmeasures.net/score-and-interpret/interpret-scores/promis/reference-populations.
- Przybylski AK. 2016. Mischievous responding in Internet gaming disorder research. PeerJ. 4:e2401.
- Puolitaival T, Sieppi M, Pyky R, Enwald H, Korpelainen R, Nurkkala M. 2020. Health behaviours associated with video gaming in adolescent men: a cross-sectional population-based MOPO study. BMC Public Health. 20(1):1–8.
- Regier DA, Narrow WE, Rae DS. 2004. For DSM-V, it’s the “disorder threshold,” stupid. Arch Gen Psychiatry. 61(10):1051–1051.
- Rothman KJ, Greenland S. 2018. Planning study size based on precision rather than power. Epidemiology. 29(5):599–603.
- Salonen A, Raisamo S. 2015. Suomalaisten rahapelaaminen 2015: Rahapelaaminen, rahapeliongelmat ja rahapelaamiseen liittyvät asenteet ja mielipiteet 15-74-vuotiailla. Helsinki (Finland): THL.
- Starcevic V, Choi TY, Kim TH, Yoo SK, Bae S, Choi BS, Han DH. 2020. Internet gaming disorder and gaming disorder in the context of seeking and not seeking treatment for video-gaming. J Psychiatr Res. 129:31–39.
- Stevens MW, Dorstyn D, Delfabbro PH, King DL. 2021. Global prevalence of gaming disorder: a systematic review and meta-analysis. Aust N Z J Psychiatry. 55(6):553–568.