
Abstract
Background
In 2019, the gambling industry introduced a voluntary partial advertising ban during live sports broadcasts in the United Kingdom known as the ‘whistle-to-whistle’ ban. This study explores the change in television advertising around live football games following the introduction of this ban.
Methods
Inverse Probability Weighted (IPW) matching models identified the change in the frequency of advertising associated with the implementation of restrictions in each section, and across the entire duration, of a live football game. Data on UK television schedules (Concise Media, TVSportsGuide) and gambling advertising (Nielsen Media) covered 3 months (1st September to 1st December) pre (2018), and post-ban (2019). There were 1049 live football games across the period studied: 468 in 2018 and 581 in 2019.
Results
The implementation of the ban was associated with a reduction in advertising (2.3 advertisements per-programme (p < 0.001, CI [−2.75, −1.84])), driven predominantly by reductions during half-time (2.18 advertisements per-programme (p < 0.001, CI [−2.32, −2.04])). It was associated with an increase in advertisements (0.34 advertisements per-programme (p < 0.001, CI [0.09,0.59])) during the pre-match section. In the post-ban period, an average of 3 (SD: 3.5) advertisements per-programme remained.
Conclusions
A voluntary partial gambling advertising ban in the UK was associated with reductions in television advertising during live football games during the restricted period. There is evidence of increased advertising in the unrestricted period due to the partial nature of the ban. Future research is needed to explore the impact of the ban on other types of advertising, and across other channels.
Introduction
Gambling is a public health issue (Korn et al. Citation2003; Public Health England (PHE), Citation2023; The Lancet Citation2017; Thomas et al. Citation2023). Harms span financial, emotional, health, economic, employment, and criminal harms: affecting individuals, families, and wider society (Langham et al. Citation2016; Wardle et al. Citation2018). A public health approach to gambling harm acknowledges a wider range of social and environmental risk factors (Korn et al. Citation2003), an important one being advertising (Public Health England (PHE), Citation2023).
Gambling advertising is omnipresent, concentrated around sports, and often represents complex and riskier bets (Deans et al. Citation2016; Newall et al. Citation2019; Torrance et al. Citation2021). It influences gambling behavior, with the greatest impact seen in more vulnerable populations, such as those who are higher risk gamblers (Bouguettaya et al. Citation2020; Killick et al. 2022; McGrane et al. Citation2023). Higher exposure to advertising is associated with increased urge to gamble, intentions to gamble, actual expenditure on gambling, and unplanned gambling spend (Russell et al. Citation2018; Browne et al. Citation2019; Roderique-Davies et al. Citation2020; Wardle et al. Citation2022). Qualitative literature suggests that it may act as a trigger to those in recovery (Binde Citation2009; Lopez-Gonzalez et al. Citation2020). Television (TV) advertising is often quoted as the most common type of exposure (IPSOS Mori Citation2020; Dunlop and Ballantyne Citation2021; Syvertsen et al. Citation2022). Whilst evidence linking exposure to advertising and harm is mostly indirect, Public Health England (PHE) identified advertising as a ‘societal’ risk factor for gambling harms (Public Health England (PHE), Citation2023).
The ‘gamblification’ of sport has received particular attention in recent years (Bunn et al. Citation2019; Sharman et al. Citation2020; Ireland et al. Citation2021; Hing et al. Citation2023). Football is the most popular sports to bet on in the UK, and is the most popular sport to watch globally (Ireland et al. Citation2019; The Gambling Commission Citation2023). Advertising around live football is ubiquitous: including TV advertisements, sponsorship, and pitch-side advertising (Cassidy and Ovenden Citation2017; Bunn et al. Citation2019; Ireland et al. Citation2021). There have been calls to restrict gambling advertising around live football (The Big Step Citation2021), given its potential to normalize gambling and influence gambling behavior and subsequent harms (Bouguettaya et al. Citation2020; Killick et al. 2022; McGrane et al. Citation2023).
European countries, such as Belgium (Belgian Official Gazette Citation2023) have committed to universal gambling advertising bans. Others have announced partial measures excluding online and ‘untargeted’ advertising (The Government of the Netherlands Citation2023). News outlets have imposed widespread bans on advertising in digital and print media (Waterson Citation2023). In the UK, gambling regulation comes under the 2005 Gambling Act (The UK Parliament Citation2005). Amongst other things, this act liberalized advertising laws, allowing the TV advertising of sports betting and casino products.
In the UK, gambling advertising is predominantly self-regulated by an industry body known as the Industry Group for Responsible Gambling, who enforce a voluntary code of conduct (Industry Group for Responsible Gambling Citation2023). Up to 2019, these voluntary codes prohibited TV advertising of the industry described ‘New Gambling Products’ (NGPs) – anything except lottery and bingo – during the watershed. In the UK, the watershed runs from 5:30am to 9:00pm. The only exemption to this were sports programmes. In August 2019, the industry group introduced a voluntary ‘Whistle-to-Whistle’ (W2W) ban during live sports programmes. Under this partial ban, gambling advertising was not permitted to appear within five minutes of the match beginning, until 5 minutes after the match had ended. This included during breaks-in-play where gambling advertising had been previously been prevalent (Ireland et al. Citation2021). The ban covered all live sports, excluding horse and dog racing. It was implemented for live sports during the watershed period only, and it did not cover other forms of advertising such as radio broadcasts, pitch-side hoardings, sponsorship of teams or leagues, or social media advertising. Other non-live sports programmes, such as sports documentaries or highlights programmes, were no longer exempt from the blanket watershed ban. Similar partial advertising bans have been implemented in Australia and Ireland (The Australian Communications and Media Authority Citation2021; The Irish Bookmakers Association Citation2021).
Despite many examples of advertising policies, there is a lack of comprehensive analysis of their impact. The UK Betting and Gaming Council (BGC), an industry body for gambling companies in the UK, reported a near elimination of TV gambling advertisements during the W2W period for all live sports programmes (The Betting and Gaming Council Citation2021). However, little is known about how the ban impacted advertising during programme sections outside of the W2W period, and advertising around specific types of sport. Analyzing changes in advertising at a granular level gives us a better understanding of how advertising bans affect the presence of advertisements on TV. Furthermore, in 2023 the UK government published its Gambling White Paper (Department for Culture and Media and Sport Citation2023) which, among other things, left advertising during sports to the discretion of sports governing bodies, and the industry. Therefore, it is imperative we understand how this self-regulation impacts the presence of advertising around live sports.
This study fills the evidence gap by exploring the change in the frequency and placement of gambling advertising following the introduction of the W2W ban in the UK. It focuses on live football given the high presence of advertising around this sport. It expands on the analysis by the UK gambling industry body to include more data, explore the impact by game section(Pre-game, 5-min before, Half-time, and Post-game), as well as over the total duration of live football games using matching models to reduce confounding.
Materials and methods
Data
The W2W ban was introduced on 1st August 2019 (Industry Group for Responsible Gambling Citation2023). This study uses 3 months of data (1st September to 1st December) in the pre (2018) and post-ban (2019) years. To enhance comparability of the data, this study used the same time period at the beginning of the football season in the pre and post-ban period where the intensity of advertising was assumed to be similar. This also removed any potential variability in advertising due to irregular sporting events – those outside of the usual football calendar such as the World Cup.
Data were compiled from three sources: TV scheduling data (Concise Media), live kickoff times from a freely available online database (TVSportsGuide.com), and gambling advertising data (Nielsen Media). Information on the content of the three datasets is available in Appendix A, supplementary material. Kickoff data were scraped using ‘Selenium’ in R. A copy of the code used to scrape this data is available in Appendix B, supplementary material. Data were analyzed using STATA 17. The data covered all gambling advertising on all UK TV channels during the period studied
The datasets were restricted to live football programmes only, excluding live highlights programmes such as ‘Match of the Day’. The three datasets were combined and live games were collapsed into sections using approximate categories by minute of the live programme (). For each section of the live programme, the total number of gambling advertisements was calculated.
Table 1. Game sections.
Due to varying game length, it was not possible to record exact end times of football games. Therefore, the post-game section was combined to include the post-game 5-min W2W period, as well as post-game programming. The wider window around Section 2 (5 min before) was to allow for late starting times. Sections 3 and 5 (First and Second Half) were included as a sense check; there should be no advertisements during the game play.
Variables
The dependent variable was the frequency of advertisements during each section of the live football game, as well as the frequency over the total duration of the programme. The independent variable of interest was a binary variable representing the introduction of the W2W ban, equal to 1 if the year was 2019 (post-ban). Control variables included the day of the game, the channel (ITV, Sky, TNT Sports (formerly BT Sports), and other), and the time of the game. Channels categorized as ‘other’ included: S4C, Eurosport, and Viaplay Sports. Timings were categorized as midday (up to 12:59), early afternoon (13:00 to 16:59), early evening (17:00 to 18:59), and late evening (after 19:00).
Statistical analysis
Regression models were run for game sections 1, 2, 4, 6, (Pre-game, 5-min before, Half-time, and Post-game) and the total duration of the live game. Linear models were first run, followed by Propensity Score (PSM) and Inverse Probability Weighted (IPW) matching models to reduce confounding. The latter models matched on the control variables stated above. PSM models matched treated (2019) and untreated (2018) football games based on a score generated using a regression of treatment against the aforementioned matching characteristics. This produced a score between 0 and 1 representing the probability of a game being ‘treated’. The model then matched football games which were close in propensity score, but differed in treatment. The ‘caliper’ indicates the total distance between the propensity scores of the matched football games; the wider the caliper, the less perfect the match. However, wider calipers can provide an appropriate approximation of a match, and can help to reduce confounding in the model. The minimum required caliper for these models was 0.4. Given that there is no agreed caliper suggested for use - research has suggested anywhere between 0.25 to 2 times the standard deviation of the logit of the propensity score (Stuart and Rubin Citation2008; Austin Citation2011) - IPW models were run for comparison. IPW matching is similar, but these models give a higher weight to treated football games (2019) that most resemble untreated football games (2018). This paper reports results from the IPW models which improve the balance of treatment and control groups to a greater extent than the linear and PSM models. Alternative model results are available in Appendix C, supplementary material.
Ethics
Ethical approval was not required because this research used secondary advertising and TV scheduling data.
Results
Descriptive
Data covered 1049 live football games: 468 in 2018 and 581 in 2019 (). The average length of live programmes was 154 min in 2018, and 151 min in 2019. Games spanned across four broad categories of networks: ITV, Sky, TNT Sports, and Other. ITV is a commercial channel in the UK, whilst Sky and TNT Sports are subscription services. The majority of games occurred in the late evening, over the weekend, and on Sky or TNT Sports channels ().
Table 2. Descriptive statistics.
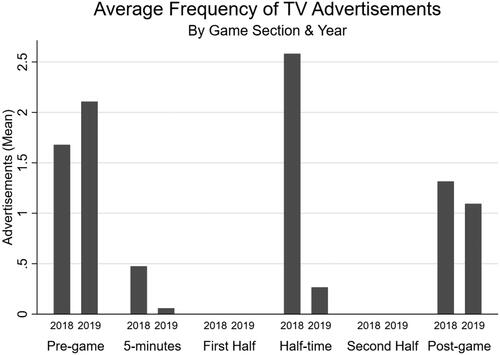
There were an average of 5.8 advertisements per live football game in 2018, and 2.9 in 2019 (). A higher frequency of advertisements occurred on Sky channels. shows the number of advertisements by game section across the pre (2018) and post-ban (2019) years. There was a reduction in advertisements during the five minutes before the live game, and during half time section in 2019; the number of advertisements was still greater than 0 since lottery and bingo advertisements are permitted. There was an increase in advertisements in the pre-game section, and minimal change in the post-game section.
Figure 1. Average frequency of television gambling advertisements by game section and year.
IPW models
Results
presents the IPW matching models. There was a reduction in advertisements equal to 2.3 advertisements (p < 0.001; CI[−2.75, −1.84]) per live game programme following the introduction of the W2W ban. The majority of this reduction occurred during half-time: 2.18 advertisements (p < 0.001; CI[−2.32, −2.04]), with a comparatively smaller reduction during the 5 min before the game (). There was an increase in advertising in the pre-game section of approximately 0.34 advertisements (p < 0.001; CI[0.09, 0.59]) per live game programme, and no change in the post-game section.
Table 3. Inverse probability weighted (IPW) matching model results.
There were fewer advertisements on Sky and TNT Sports compared to ITV during the period studied, but these result did not reach standard levels of statistical significance (p > 0.05). For the results of the linear and PSM models, see Appendix C, supplementary material.
Model performance
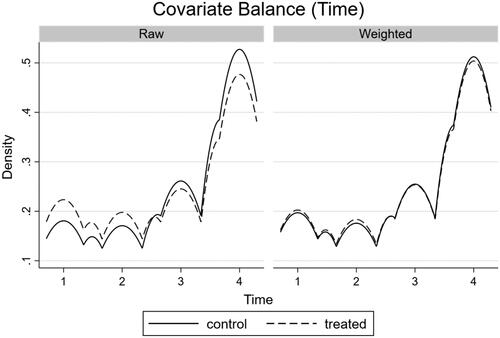
By observing the balance of covariates in the IPW model we can measure model performance. When covariates are balanced, their distribution does not differ between treatment (2019) and control (2018) groups, and therefore the groups are more comparable. Therefore, we want a matching model to provide balanced covariates. To explore this further, we have presented density plots () for the final IPW model (total programme). These are based on the differences in covariates between the treated and control groups for each of the three matching variables (channel, day of the week, time of the game). All three density plots show an improvement in fit in the weighted (matched) sample compared to the raw sample, indicating that the matched model has improved the balance of covariates. We can see this by the increased overlap of both density plots, bringing them close to complete overlap in the matched models. However, there is still significant overlap in the raw data models, likely due to the selection of two comparable periods at the beginning of the football season which improved the comparability of games in the pre and post-ban period.
Figure 2. Density plot of covariate balance (channel the game was televised on) in the IPW models.
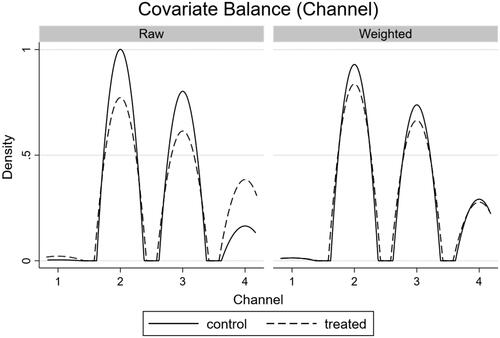
Figure 3. Density plot of covariate balance (day of the week the game was televised) in the IPW models.
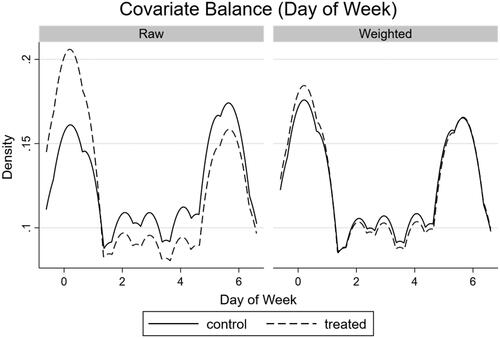
Figure 4. Density plot of covariate balance (time the game was televised) in the IPW models.
We can formally test for covariate balance in the IPW model using a balance test, where the null hypothesis states that the matched model is balanced. presents covariate balance statistics for each IPW model separately. The p-values of all models are greater than standard levels of statistical significance (p > 0.05), so we fail to reject the null hypothesis; the matched models are all balanced. also indicates that the number of observations between the treated and control groups have become more balanced in the matched sample, compared to the raw sample. This removes any bias that may occur due to the increased number of games in the treated group (2019) versus the control group (2018).
Table 4. Balance of covariates in IPW models.
Appendix D, supplementary material reports detailed covariate balance tables for both the PSM and IPW models. For covariates to be well-balanced, the matched standardized mean difference should be close to zero, and the matched variance ratios should be close to 1. These tables show that the IPW models balance the covariates marginally better than the PSM models. For further information, see Appendix D, supplementary material.
Discussion
This study examined the change in the frequency and placement of gambling advertising during live televised football as a result of an industry-implemented partial advertising ban around live sports broadcasts in the UK. It found that the ban led to an overall reduction in TV advertisements around live football games during the restricted periods (5-min before, and Half-time), with a small increase in the unrestricted pre-match section and no change in the post-match section. The comparatively smaller decreases seen during the 5 min before the game compared to half-time were likely due to the smaller time frame available for advertisements. In 2019, there remained an average of 3 gambling advertisements per live football game, attributable to the partial nature of the ban which does not apply to the pre or post-match period. Previous research has reported an average of 4.5 advertisements per game during the Men’s 2020 Euro tournament, and 5.2 gambling advertisements per game during 2022 Qatar World Cup (Newall et al. Citation2022; Sharman et al. Citation2023). This is likely due to their study of large sporting events, which this study does not cover. Other research highlights a noticeable presence of gambling advertising through other forms (including pitch-side and sponsorship) during live televised football (Cassidy and Ovenden Citation2017; Purves et al. Citation2020; Rossi et al. Citation2023; Torrance et al. Citation2023), likely resulting from the exclusion of these other forms of advertising from this ban. Therefore, TV advertising restrictions may be an effective policy tool for reducing the frequency of gambling advertisements on TV around live football games. However, partial bans may be less effective in reducing the overall prevalence of advertisements on TV.
Strengths
This paper used three rich datasets on TV schedules, kickoff times, and gambling advertising to examine the impact of a voluntary advertising ban on the presence of advertising during live televised football. It goes beyond the analysis by the UK gambling industry body by looking at football specifically, over a longer period of time, and including additional data. We used matching models to reduce confounding and identify the independent effect of the ban.
Limitations
We did not have data on advertising through other channels such as direct, online, pitch-side, or sponsorship. There might be unintended consequences if the industry increased other forms of advertising to compensate for losses in TV advertising. Evidence shows that advertisements are still highly prevalent in these areas (Purves et al. Citation2020; Torrance et al. Citation2023). Advertising may also have changed across the rest of the TV network; this is an area requiring further research.
Policy implications
A voluntary partial gambling advertising ban in the UK was associated with a reduction in gambling advertising around live football games in 2019. Reductions in advertising during the 5 min before the game, and at half-time, are similar to those reported by the industry body in the UK. However, reductions over the total duration of live football may be lower than the 78% reduction reported for all live sport (The Betting and Gaming Council Citation2021): potentially only around 43%. An important finding is that the industry did not substitute advertisements during the restricted period for lottery and bingo advertisements, which are permitted. Results indicate that there may have been some spreading of television advertisements into the pre-match (unrestricted) section, although the magnitude of this effect is comparatively smaller.
There is no evidence to suggest that the five minutes before and after a live game is the optimal window to restrict gambling advertising. A cognitive theory known as the Serial Positioning Effect (Glanzer and Cunitz Citation1966) explains how people are more likely to recall items seen at the beginning and the end of list, rather than the middle. Applied to this context, it may suggest that people may be more likely to recall advertisements in the pre and post-game section, which are areas of unrestricted advertising. Whilst we are unable to comment on this in the current study, this is an area that would benefit from further research
Evidence from other industries, such as alcohol and tobacco, indicate that partial advertising bans are less effective than universal bans (Braverman and Aarø Citation2004; Kovic et al. Citation2018; Potvin Kent and Pauzé Citation2018; Boyland et al. Citation2022). There may be increases in other types of advertising, which reduce their impact. Online platforms provide an opportunity since these are highly unregulated, and have wide reach (Hastings et al. Citation2010; Rossi and Nairn Citation2022). Gamble Aware reported that the gambling industry spent 15% of their advertising budget on TV, and 10% on online advertising in 2017. Spend on social media had increased by 52% per annum between 2014 and 2017. Online marketing was reported to have increased by 23% per annum over the same period (Gamble Aware Citation2018). Ipsos MORI estimated TV spend to be £193,548,007, and online impressions at £8,942,818 (IPSOS Mori Citation2020). It is likely that online gambling advertising has modified in line with technological changes in the UK over the last seven years, although we do not have the data required to explore this.
Future research should comprehensively explore how the introduction of specific restrictions impacts overall exposure to advertising across various advertising channels. For example, it should look at how the W2W ban impacted other live sports, including those not subject to the ban (horse racing). It should also examine the entire TV network to assess whether there were changes in advertising around other TV genres, such as entertainment. The impact of the window of restriction needs further research, in addition to looking at how overall changes in advertising translate to a change in gambling behavior.
Conclusions
This study illustrates that partial restrictions on gambling advertising during televised live sports were associated with a reduction in the number of advertisements across live football games during the restricted period, and some increases during the unrestricted period. Following the ban, advertisements remained prevalent during live football. This may impact the ability of the ban to reduce harm, since partial bans are known to be less effective. Future research must look at the wider impact of the ban, including whether there is any change in advertising during other programming post-watershed, or other forms of advertising. Evidence on the subsequent behavioral impact of the ban is also required.
Ethical approval
Ethical approval was not required because this research used secondary advertising and TV scheduling data.
Supplemental Material
Download MS Word (37.1 KB)Acknowledgements
None.
Disclosure statement
No potential conflict of interest was reported by the author(s).
Data sharing agreement
Advertising data used in this study is not available for sharing due to licensing restrictions. However, STATA do-files and log-files are available on request from the corresponding author (EM), in addition to the scraped kickoff dataset.
Additional information
Funding
References
- Austin PC. 2011. Optimal caliper widths for propensity-score matching when estimating differences in means and differences in proportions in observational studies. Pharm Stat. 10(2):150–161. doi:10.1002/pst.433.
- Belgian Official Gazette. 2023. February 27, 2023. - Royal decree determining the detailed rules regarding advertising for games of chance. https://etaamb.openjustice.be/nl/koninklijk-besluit-van-27-februari-2023_n2023030509
- Binde P. 2009. Exploring the impact of gambling advertising: an interview study of problem gamblers. Int J Ment Health Addiction. 7(4):541–554. doi:10.1007/s11469-008-9186-9.
- Bouguettaya A, Lynott D, Carter A, Zerhouni O, Meyer S, Ladegaard I, Gardner J, O’Brien KS. 2020. The relationship between gambling advertising and gambling attitudes, intentions and behaviours: a critical and meta-analytic review. Curr Opin Behav Sci. 31:89–101. doi:10.1016/j.cobeha.2020.02.010.
- Boyland E, McGale L, Maden M, Hounsome J, Boland A, Jones A. 2022. Systematic review of the effect of policies to restrict the marketing of foods and non-alcoholic beverages to which children are exposed. Obes Rev. 23(8):e13447. doi:10.1111/obr.13447.
- Braverman MT, Aarø LE. 2004. Adolescent smoking and exposure to tobacco marketing under a tobacco advertising ban: findings from 2 norwegian national samples. Am J Public Health. 94(7):1230–1238. doi:10.2105/AJPH.94.7.1230.
- Browne M, Hing N, Russell AMT, Thomas A, Jenkinson R. 2019. The impact of exposure to wagering advertisements and inducements on intended and actual betting expenditure: an ecological momentary assessment study. J Behav Addict. 8(1):146–156. doi:10.1556/2006.8.2019.10.
- Bunn C, Ireland R, Minton J, Holman D, Philpott M, Chambers S. 2019. Shirt sponsorship by gambling companies in the English and Scottish Premier Leagues: global reach and public health concerns. Soccer Soc. 20(6):824–835. doi:10.1080/14660970.2018.1425682.
- Cassidy R, Ovenden N. 2017. Frequency, duration and medium of advertisements for gambling and other risky products in commercial and public service broadcasts of English Premier League football. [PREPRINT]. Goldsmiths, University of London. https://osf.io/preprints/socarxiv/f6bu8/
- Deans EG, Thomas SL, Daube M, Derevensky J, Gordon R. 2016. Creating symbolic cultures of consumption: an analysis of the content of sports wagering advertisements in Australia. BMC Public Health. 16(1):208. doi:10.1186/s12889-016-2849-8.
- Department for Culture, Media and Sport. 2023. High stakes: gambling reform for the digital age. Gov.uk. [Report]. https://www.gov.uk/government/publications/high-stakes-gambling-reform-for-the-digital-age
- Dunlop P, Ballantyne EEF. 2021. Effective and responsible marketing of online sports gambling to young adults in the UK. SN Bus Econ. 1(10), 10. doi:10.1007/s43546-021-00125-x.
- Gamble Aware. 2018. Gambling advertising and marketing spend in Great Britain, 2014-17 [Infographic from report]. https://www.begambleaware.org/sites/default/files/2020-12/2018-11-24-rp-ga-gb-marketing-spend-infographic-final.pdf.
- Glanzer M, Cunitz AR. 1966. Two storage mechanisms in free recall. Journal of Verbal Learning and Verbal Behavior. 5(4):351–360. doi:10.1016/S0022-5371(66)80044-0.
- Hastings G, Brooks O, Stead M, Angus K, Anker T, Farrell T. 2010. Failure of self regulation of UK alcohol advertising. BMJ. 340(jan20 1):b5650–b5650. doi:10.1136/bmj.b5650.
- Hing N, Rockloff M, Browne M. 2023. A bad bet for sports fans: the case for ending the “gamblification” of sport. Sport Management Review. 26(5):788–812. doi:10.1080/14413523.2023.2260079.
- Industry Group for Responsible Gambling. 2023. Gambling industry code for socially responsible advertising: 7th edition. The Betting and Gaming Council. https://bettingandgamingcouncil.com/members/igrg
- IPSOS Mori. 2020. Final synthesis report executive summary: The effect of gambling marketing and advertising on children, young people and vulnerable adults (p. 20). Gamble Aware. Available from: https://www.ipsos.com/sites/default/files/ct/publication/documents/2020-03/gambling-marketing-advertising-effect-young-people-exec-summary.pdf.
- Ireland R, Bunn C, Reith G, Philpott M, Capewell S, Boyland E, Chambers S. 2019. Commercial determinants of health: advertising of alcohol and unhealthy foods during sporting events. Bull World Health Organ. 97(4):290–295. doi:10.2471/BLT.18.220087.
- Ireland R, Muc M, Bunn C, Boyland E. 2021. Marketing of unhealthy brands during the 2018 Fédération Internationale de Football Association (FIFA) World Cup UK broadcasts – a frequency analysis. J Strat Market. 1–16. doi:10.1080/0965254X.2021.1967427.
- Killick E, Griffiths M, Department of Psychology, International Gaming Research Unit, Nottingham Trent University, Nottingham, UK. 2022. Impact of sports betting advertising on gambling behavior: a systematic review. ADDICTA Turk J Addict. 8(3):201–214. doi:10.5152/ADDICTA.2022.21080.
- Korn D, Gibbins R, Azmier J. 2003. Framing public policy towards a public health paradigm for gambling. J Gambl Stud. 19(2):235–256. doi:10.1023/A:1023685416816.
- Kovic Y, Noel JK, Ungemack JA, Burleson JA. 2018. The impact of junk food marketing regulations on food sales: an ecological study. Obes Rev. 19(6):761–769. doi:10.1111/obr.12678.
- Langham E, Thorne H, Browne M, Donaldson P, Rose J, Rockloff M. 2016. Understanding gambling related harm: a proposed definition, conceptual framework, and taxonomy of harms. BMC Public Health. 16(1):80. doi:10.1186/s12889-016-2747-0.
- Lopez-Gonzalez H, Griffiths MD, Jimenez-Murcia S, Estévez A. 2020. The perceived influence of sports betting marketing techniques on disordered gamblers in treatment. Europ Sport Manage Quart. 20(4):421–439. doi:10.1080/16184742.2019.1620304.
- McGrane E, Wardle H, Clowes M, Blank L, Pryce R, Field M, Sharpe C, Goyder E. 2023. What is the evidence that advertising policies could have an impact on gambling-related harms? A systematic umbrella review of the literature. Public Health. 215:124–130. doi:10.1016/j.puhe.2022.11.019.
- Newall PWS, Ferreira CA, Sharman S, Payne J. 2022. The frequency and content of televised UK gambling advertising during the men’s 2020 Euro soccer tournament. Exp Results. 3:e28. doi:10.1017/exp.2022.26.
- Newall PWS, Moodie C, Reith G, Stead M, Critchlow N, Morgan A, Dobbie F. 2019. Gambling marketing from 2014 to 2018: a literature review. Curr Addict Rep. 6(2):49–56. doi:10.1007/s40429-019-00239-1.
- Potvin Kent M, Pauzé E. 2018. The effectiveness of self-regulation in limiting the advertising of unhealthy foods and beverages on children’s preferred websites in Canada. Public Health Nutr. 21(9):1608–1617. doi:10.1017/S1368980017004177.
- Public Health England (PHE). 2023. Gambling-related harms: evidence review [Review]. Public Health England. https://www.gov.uk/government/publications/gambling-related-harms-evidence-review
- Purves RI, Critchlow N, Morgan A, Stead M, Dobbie F. 2020. Examining the frequency and nature of gambling marketing in televised broadcasts of professional sporting events in the United Kingdom. Public Health. 184:71–78. doi:10.1016/j.puhe.2020.02.012.
- Roderique-Davies G, Torrance J, Bhairon T, Cousins A, John B. 2020. Embedded gambling promotion in football: an explorative study of cue-exposure and urge to gamble. J Gambl Stud. 36(3):1013–1025. doi:10.1007/s10899-020-09949-y.
- Rossi R, Nairn A. 2022. New developments in gambling marketing: the rise of social media ads and its effect on youth. Curr Addict Rep. 9(4):385–391. doi:10.1007/s40429-022-00457-0.
- Rossi R, Wheaton J, Moxey M, Tozzi E. 2023. The prevalence of gambling adverts during the opening weekend of the english premier league 2023/2024. https://www.bristol.ac.uk/media-library/sites/business-school/documents/BRISTOL-UNI-GAMBLING-Report2023-2.pdf
- Russell AMT, Hing N, Browne M, Rawat V. 2018. Are direct messages (texts and emails) from wagering operators associated with betting intention and behavior? An ecological momentary assessment study. J Behav Addict. 7(4):1079–1090. doi:10.1556/2006.7.2018.99.
- Sharman S, Ferreira CA, Newall PWS. 2020. Exposure to gambling and alcohol marketing in soccer matchday programmes. J Gambl Stud. 36(3):979–988. doi:10.1007/s10899-019-09912-6.
- Sharman S, Piper T, McGrane E, Newall PWS. 2023. Gambling adverts in live TV coverage of the Qatar 2022 FIFA Men’s World Cup. Addict Res Theory. 0(0):1–8. doi:10.1080/16066359.2023.2245330.
- Stuart EA, Rubin DB. 2008. Best practices in quantitative methods. California (CA): SAGE Publications Inc. doi:10.4135/9781412995627.
- Syvertsen A, Erevik EK, Hanss D, Mentzoni RA, Pallesen S. 2022. Relationships between exposure to different gambling advertising types, advertising impact and problem gambling. J Gambl Stud. 38(2):465–482. doi:10.1007/s10899-021-10038-x.
- The Australian Communications and Media Authority. 2021. Gambling ads during live sport on broadcast TV and radio. Rules for Gambling Ads. https://www.acma.gov.au/gambling-ads-during-live-sport-broadcast-tv-and-radio
- The Betting and Gaming Council. 2021. Review of voluntary whistle-to-whistle advertising restrictions (p. 7). The Betting and Gaming Council. https://bettingandgamingcouncil.com/uploads/Downloads/BGC-REVIEW-OF-VOLUNTARY-WHISTLE-TO-WHISTLE-ADVERTISING-RESTRICTIONS.pdf
- The Big Step. 2021. Football supporters against gambling ads. Football Saga. https://footballsaga.co.uk/
- The Gambling Commission. 2023. Statistics on participation and problem gambling for the year to March 2023 [dataset]. The Gambling Commission. https://www.gamblingcommission.gov.uk/statistics-and-research/publication/statistics-on-participation-and-problem-gambling-for-the-year-to-march-2023#files
- The Government of the Netherlands. 2023. Minister Weerwind bans untargeted advertising for online games of chance—News item—Government.nl [Nieuwsbericht]. Ministerie Van Algemene Zaken. https://www.government.nl/latest/news/2023/04/19/minister-weerwind-bans-untargeted-advertising-for-online-games-of-chance
- The Irish Bookmakers Association. 2021. Safer Gambling Code. The Irish Bookmakers Association. https://www.irishbookmakersassociation.com/bookmakers-agree-credit-card-and-whistle-to-whistle-advertising-bans/
- The Lancet (2017). Problem gambling is a public health concern. The Lancet, 390(10098), 913. doi:10.1016/S0140-6736(17)32333-4.
- The UK Parliament. 2005. The gambling act 2005. Retrieved 15 January 2024. https://www.legislation.gov.uk/ukpga/2005/19/contents
- Thomas S, Cowlishaw S, Francis J, Van Schalkwyk MCI, Daube M, Pitt H, McCarthy S, McGee D, Petticrew M, Rwafa-Ponela T, et al. 2023. Global public health action is needed to counter the commercial gambling industry. Health Promot Int. 38(5):daad110. doi:10.1093/heapro/daad110.
- Torrance J, Heath C, Andrade M, Newall P. 2023. Gambling, cryptocurrency, and financial trading app marketing in English Premier League football: A frequency analysis of in-game logos. J Behav Addict. 12(4):972–982. doi:10.1556/2006.2023.00066.
- Torrance J, John B, Greville J, O’Hanrahan M, Davies N, Roderique-Davies G. 2021. Emergent gambling advertising; a rapid review of marketing content, delivery and structural features. BMC Public Health. 21(1):718. doi:10.1186/s12889-021-10805-w.
- Wardle H, Critchlow N, Brown A, Donnachie C, Kolesnikov A, Hunt K. 2022. The association between gambling marketing and unplanned gambling spend: synthesised findings from two online cross-sectional surveys. Addict Behav. 135:107440. doi:10.1016/j.addbeh.2022.107440.
- Wardle H, Reith G, Best D, McDaid D, Platt S. 2018. Measuring gambling-related harms. Gambling Commission. https://eprints.lse.ac.uk/89248/
- Waterson J, editor. 2023. The Guardian bans all gambling advertising. The Guardian, June 15. https://www.theguardian.com/society/2023/jun/15/guardian-bans-all-gambling-advertising