
Abstract
Objective: To assess the agreement between measured height, and height predicted from ulna length using the Malnutrition Universal Screening Tool (MUST) equations, in adult patients admitted to government hospitals in Bloemfontein, South Africa.
Design: Descriptive cross-sectional survey.
Setting: Medical, surgical, pulmonary, orthopaedic, cardiovascular and general wards at Pelonomi, Universitas and National Hospitals in Bloemfontein.
Subjects: All patients between 19 and 60 years, admitted during a two-week period in March 2015, who gave written informed consent, and were able to stand upright and unassisted, were included.
Outcome measures: Standing height (via stadiometer; referred to as reference height), weight and ulna length were measured. Predicted height and body mass index (BMI) were calculated from ulna length using MUST equations, and compared with reference height and BMI by 95% confidence intervals (CI) and Bland–Altman analysis.
Results: The sample comprised n = 200 participants (48% female; median age: 42 years: 32–51 years). The median height estimated from ulna length (170.2 cm; range: 154.2–213.0 cm) was statistically significantly (95% CI [7.1; 7.7]) longer than the median reference height (163.9 cm; range: 145.1–188.4 cm). The Bland–Altman analysis indicated that the 95% limits of agreement between the two methods ranged from –19.8 to 5.7 cm. Median BMI based on estimated height (20.1 kg/m2) was significantly (95% CI [–1.9; –1.6]) lower than median BMI calculated from reference height (21.8 kg/m2).
Conclusion: Height predicted from ulna length with the MUST equations overestimated height in this population. This may be related to high prevalence of stunting in the South African population. The discrepancy may have clinical implications particularly for critically ill patients.
Strong message: Estimations of height based on upper body long-bone measurements may not be reliable in populations with a high prevalence of stunting.
Introduction
Height and weight are fundamental measurements of nutritional status and health indicators, which are used to direct the care of hospitalised patients. The European Society for Clinical Nutrition and Metabolism (ESPEN) advises that all patients should be screened for nutritional risk on admission, in order to combat the high incidence and well-researched consequences of pre-existing, as well as hospital-acquired, malnutrition on patient morbidity and mortality.Citation1 For this purpose, ESPEN recommends the Malnutrition Universal Screening Tool (MUST), the Nutritional Risk Screening (NRS) 2002, and the Mini Nutritional Assessment (MNA), all of which utilise body mass index (BMI) based on height and weight (kg/m2).Citation1
Beyond screening, height and weight are factored into equations to estimate patients’ energy expenditure, particularly in resource-poor government hospital settings in South Africa, where indirect calorimetry is not available, as well as to calculate ideal body weight and overall nutritional requirements.Citation2,3 Height and weight are equally important for the estimation of lung capacity,Citation4 glomerular filtration rateCitation5 and drug dosages,Citation6 among others. Therefore, accurate recording of height and weight are vital, particularly as all estimation equations already include some margin of error, which is only further exacerbated by inaccurate anthropometric measurements.
The standardised reference technique for height measurement requires the subject to stand up straight and unassisted for measurement with a calibrated stadiometer.Citation7 For many patients, particularly the critically ill, this is impossible due to the type of trauma and/or medical procedures, sedation, unconsciousness, confusion, pain, weakness, etc.Citation7,8 In these cases, many health care workers measure recumbent length. The correct standardised technique for accurate and reproducible results with this method, is, however, time consuming and may require moving the patient into a position that may be too uncomfortable or painful for many critically ill patients.Citation9 If conscious, the patient could self-report his/her height, but systematic reviews of studies estimating the accuracy of self-reported height found that patients tend to overestimate their true height.Citation10,11 In the South African setting, patients and/or their family members often have no idea of the patient’s height or weight, while language barriers also hamper communication. Estimating patients’ height by eyeballing, as many health care professionals do, has also been shown to be very inaccurate. Hendershot et al., for example, found that only 41% of healthcare professionals in a trauma unit were able to estimate patients’ height to within 2.54 cm of measured values.Citation12
A scientific approach to estimating height includes the use of mathematical equations based on regression modelling to predict stature, making use of long-bone lengths. These include lower limb measurements, such as knee height, as well as upper limb measures such as arm span, demi-span and ulna length.Citation7 Of these, ulna length is often the easiest to measure in critically ill patients, as at least one forearm is usually accessible, and the methodology for measuring the ulna length only requires the arm to be folded against the chest with the fingers directed towards the shoulder.Citation7,13 The subcutaneous nature of the medial olecranon and distal styloid processes of the ulna makes the whole length of the bone easy to palpitate and measure quickly and accurately.Citation7,14
The MUST, recommended by ESPEN for nutrition screening of adults under 65 years, uses a specific set of equations validated on a European population to predict height based on ulna length.Citation14 Although the technique and these equations are widely used, to date no study has been published which established that ulna length, when incorporated into MUST equations, is reliable to predict height in the South African population. This study assessed the agreement between actual measured reference height and height predicted from ulna length, of adult hospitalised patients admitted to three government hospitals in Bloemfontein, Free State Province, South Africa.
Methods
Study population and sampling
A descriptive cross-sectional study was conducted after approval was obtained from the Ethics Committee of the Faculty of Health Sciences, University of the Free State, as well as the Free State Department of Health Provincial Research Committee (NR 04/2015). The medical, surgical, pulmonary, orthopaedic, cardiovascular and general wards at Pelonomi, Universitas and National Hospitals in Bloemfontein were preselected, based on the fact that patients in these wards were most likely to be able to stand unassisted. All patients between the ages of 20 and 60 years who were admitted to the pre-selected wards during a two-week period in March 2015, who were able to stand up straight and unassisted for the measurements of height and weight, and who gave informed consent, were included in the study. The initial total sample comprised n = 226 patients. A total of n = 26 were excluded for the following reasons: (n = 8 had recent/past bone surgery affecting height or ulna length; n = 17 had with bone injuries/fractures affecting height or ulna length; and n = 1 had a physical disability). The final sample thus comprised n = 200 participants.
Data collection
Weight and height were obtained using standardised techniques as described in the literature, applied at the bedside, with the curtains drawn to ensure the privacy of participants.Citation7,14,15 The measurements were performed by four final-year dietetics students who were trained, and who were well practised in the relevant anthropometric techniques prior to data collection. The relevant anthropometric measurements recorded by these different operators did not vary significantly (Kruskal–Wallis test; p = 0.11).
The diurnal variation in stature, due to compression of the spine, seems to peak within two hours of rising.Citation16,17 In the wards included in the study, patients are routinely woken up between 05h00 and 06h00. Since the sample comprised ambulatory patients who could move around, to, for example, visit the bathroom, all measurements were taken after 09h00 as a precaution. The same equipment was used for all measurements and calibrated daily, and the average of three separate measurements was used in all instances. Language barriers were overcome by making use of interpreters.
Reference height was measured with a calibrated mobile free-standing stadiometer (Seca 213®; Seca GmbH, Hamburg, Germany) according to standardised techniques.Citation7 The stadiometer was firmly placed on a hard level surface and positioned against a wall to ensure rigidity as stability. Participants were asked to remove any shoes, socks or hat, and to adjust hairstyles that could affect the measurement. Each participant was asked to stand fully upright, facing forward on the platform; arms relaxed and freely hanging at the sides with palms facing the thighs; knees straight and legs close together; and heels, buttocks and upper back in contact with the vertical surface of the stadiometer. The head was positioned in the Frankfort plane.Citation15 Once the participant was correctly positioned, he/she was asked to inhale deeply and hold the breath for a few seconds. In order to straighten out the spine for the most reliable measurement, the participant’s head was gently lifted in an upward manner, using the mastoid process landmark. The head board was moved firmly onto the vertex of the head; the participant was instructed to exhale; and the measurement was recorded to an accuracy of 0.1 cm.Citation7,15,17
All participants were weighed on the same calibrated scale (Tanita Digital Lithium scale HD-327, Middlesex, UK), placed on a hard, level surface. The participant was asked to remove any excess clothing and to stand in the centre of the scale, while ensuring equal distribution of weight. The measurement was recorded to the nearest 0.1 kg.Citation7
Ulna measurement was taken using a standard, clearly calibrated, non-stretchable anthropometric tape (Butterfly, Shanghai, China). The participant was asked to remove or change the position of any wristbands, jewellery, bracelets and watches, and to bend the left arm diagonally across the chest, with the palm facing inwards and the fingers pointing towards the opposite shoulder. This allowed the researcher to palpitate the landmarks, and to measure the ulna from the tip of the olecranon process to the tip of the styloid process to the nearest 0.1 cm.Citation14 Ulna length was measured on the left arm as far as possible, as the MUST equations were validated for use on the left sideCitation;13 however, when not possible, the right arm was used, as no systematic differences have been recorded in the literature between measurements on the left or right side.Citation18,19
Data analysis
Ulna length was used to predict height with the use of the MUST equations developed for adults aged < 65 years.Citation17
Males: Predicted height (cm) = 79.2 + [3.60 x ulna length (cm)]
Females: Predicted height (cm) = 95.6 + [2.77 x ulna length (cm)]
BMI was calculated as weight (kg)/height (m2) using reference height and height predicted from ulna length.
Data were analysed by the Department of Biostatistics of the University of the Free State (using SAS/STAT software, Version 9.2; SAS Institute, Cary, NC, USA). Categorical data were expressed as frequencies and percentages, and continuous data as range, median and percentiles. The differences between the medians for reference and predicted heights, as well as BMI based on reference and predicted heights, respectively, were compared by means of 95% confidence intervals for paired data.
Bland–Altman analysis was used to assess the 95% limits of agreement between the two methods.Citation20 This analysis involves the plotting of the difference between measurements of the same parameter obtained with two different techniques, against the mean of the measurements. This approach is more appropriate than correlation and regression methods for this type of comparison.Citation21
Results
The final sample of n = 200 participants had a median age of 42 years (19–60 years), comprised n = 163 (81.5%) black, n = 19 (9.5%) white, and n = 8 (9.0%) coloureds people, and was relatively equally distributed according to gender (48% female, 52% male). Participant numbers were also more or less equally distributed between the three hospitals (National hospital: n = 50 (25%), Pelonomi hospital: n = 74 (37%), and Universitas hospital: n = 76 (38%).
As summarised in Table , the difference between the height predicted from ulna length using the MUST equations, and reference height, ranged from an overestimation of 47.7 cm (in one male participant) to an underestimation of 8.9 cm. The median difference between the reference height and the height predicted from the ulna length was 7.3 cm, with an interquartile range of 3.1 cm to 12.2 cm; and the difference was statistically significant (95% CI [6.1; 7.7]).
Table 1: Reference height versus height predicted from ulna length using MUST equationsCitation1
When the data were analysed according to gender (Table ), the difference between height predicted from the ulna length and the reference height remained significant in both males and females. The difference between the measurements was also statistically significantly higher in the males than in the females (95% CI; [0.3; 3.5]).
The majority (44%) of participants had a BMI (calculated from actual weight and reference height) in the normal category (18.5–24.9 kg/m2). The difference between BMI calculated from reference height and BMI based on height predicted from ulna length (Table ) ranged from an overestimation of 3.3 kg/m2 to an underestimation of 10.0 kg/m2, with a median difference of 1.8 kg/m2 (interquartile range: 0.9 kg/m2 to 2.6 kg/m2). Estimated height was significantly (95% CI [1.6; 1.9]) longer than the reference height in this population.
Table 2: BMI based on reference height versus BMI based on height predicted from ulna length using MUST equations (n = 200)Citation1
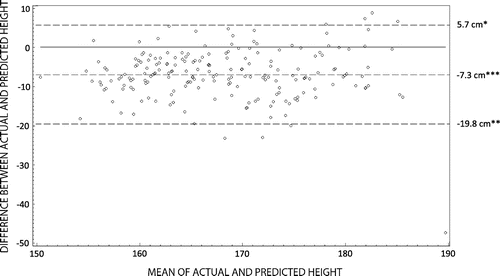
Bland–Altman analysis (Figure ) found that the 95% limits of agreement between the two methods ranged from –19.8 to 5.7 cm indicating that the methods do not consistently provide similar results.
Figure 1: Bland–Altman plot depicting the levels of agreement between direct height measurement and height predicted from ulna length using the MUST equations.
Discussion
This study found that height was statistically significantly overestimated in a population of hospitalised patients when predicted from ulna length using the MUST equations. Discrepancies of up to 19.8 cm were recorded, which is clinically significant as it will definitely impact on clinical predictions and estimations that are based on height. This was illustrated by BMI, which was statistically significantly underestimated in this population when based on the height predicted from ulna length.
Madden et al.,Citation17 reported that height predicted from ulna length correlated closely with reference height in white (English, Irish, Scottish, Welsh) participants, while overestimating height in black (Black African, Black Caribbean) and Asian (Bangladeshi, Indian, Pakistani) participants. Various other studies of predictive equations to predict height based on long-bone lengths also found that the reliability of these equations varied between ethnic groups.Citation9,22,23 A popular hypothesis is that the relative proportions of the skeletal parts differ based on ethnicity and race,Citation24 and that equations should therefore be standardised for different ethnic and racial groups.Citation17,24
In the current study, the sample was of mixed ethnicity, but the overall majority (81.5%) of participants were Black South Africans. The significant overestimation of height when predicted from ulna length using the MUST equations, therefore, seems in line with the findings of Madden et al.Citation17 Based on recent evidence regarding child growth patterns, however, an alternative explanation for these findings may be the high prevalence of stunting in the South African population. The World Health Organization (WHO) Multicentre Growth Reference Study (MGRS)Citation25 to develop new growth references for infants and children followed the growth patterns of 8 500 children living in relative affluence, in Brazil, Ghana, India, Norway, Oman, and the United States. The MGRS aimed to ensure optimal conditions for normal growth and development and to control sources of bias. The inclusion criteria, therefore, were single term births, absence of environmental and health constraints on growth, absence of significant morbidity, adherence to MGRS feeding recommendations (which included breastfeeding and optimal weaning practices), and absence of maternal smoking. The MGRS found striking similarity in linear growth of infants to five-year-olds among all sites despite marked differences among the sites in population and environmental characteristics, and concluded that ‘when health and key environmental needs are met, the world’s children grow very similarly’.Citation25 The WHO therefore advises that the new WHO growth standards, developed from the MGRS, should be used for all children everywhere, regardless of ethnicity.Citation25 Similarly, when data on a nationally representative sample of blacks and white individuals aged 18 to 74 years, from the first United States National Health and Nutrition Examination Survey (NHANES I), were adjusted for differences between the two ethnic groups in age, urban or rural residence, income and education no significant difference in average height between black and white participants of either gender was found.Citation26
‘Ethnic’ differences in skeletal proportions, therefore, seem to be rather the result of environmental factors. In humans, particularly from birth to age seven, the legs grow relatively faster than the trunk and other body segments.Citation24 Evidence suggests that poor nutrition in utero, during childhood and in adolescence, as well as other environmental factors like heavy physical labour (that directs blood away from the skeletal growth plates), infectious diseases, poor living conditions, and emotional or physical trauma, among others, reduce leg length relative to trunk length so that the child does not reach his/her genetically determined adult height.Citation24,27 That this occurs to a severe extent and on a large scale in Africa and also in South Africa, and is evidenced by the high prevalence of stunting which is estimated at 38% of children on the continentCitation28 and 26.9% of children in South Africa.Citation29 Children are defined as stunted if their height-for-age is more than two standard deviations below the WHO Child Growth Standards median.Citation28
If stunting indeed affects leg length relatively more that the rest of the skeleton,Citation24 prediction equations based on upper extremity measurements, such as ulna length, demi-span and arm span, may not be accurate predictors of height in populations with a high prevalence of stunting. Whether or not using long bones in the lower extremities in these populations may be more reliable in this regard warrants further investigation. Standardised techniques have been developed for measuring knee height,Citation7 tibiaCitation30 and fibulaCitation31 length. Femur length is considered the most accurate predictor of height in forensic science, but cannot be directly measured in living patients.Citation32 In a recent study in a public hospital in Brazil, it was indeed found that height prediction equations based on knee height outperformed those based on arm, span, demi-span and recumbent length.Citation33 From a practical point of view, in the critical care setting, however, knee height measurement requires specialised equipment (sliding broad-blade calliper), which is seldom available, thus making the measurement difficult to perform with accuracy.Citation34 Measurements of the tibia and fibula may offer alternatives that are worth investigating in the critical care setting.Citation30,31,35
Limitations of the study
All efforts were made to limit inaccuracy and inconsistency in the anthropometric measurements in the study, by ensuring that the data collectors were well trained and practised in the anthropometric techniques, and by using validated, standardised techniques and high-quality, calibrated equipment. Slight diurnal variation between patients who remained in bed, and those who walked around after waking, may however, have been a source of bias.
Conclusions and recommendations
This study found that ulna length incorporated into MUST equations did not accurately predict actual height in a South African population admitted to government hospitals in Bloemfontein. Height predicted from ulna length statistically significantly overestimated actual height in this setting. The clinical significance of this difference was illustrated by the fact that BMI based on estimated height was statistically significantly lower than BMI based on actual height measurements, and this may result in patients being classified in the incorrect BMI categories and their energy requirements being calculated incorrectly.
The findings of this study emphasise the need for large-scale interventions to address stunting in the South African population, particularly under the age of two years when stunting can be reversed.Citation29 With regard to predicting height in patients who are unable to stand unassisted for direct measurement, it is hypothesised that equations based on long-bone measurements in the lower limbs may more accurately reflect attained height in stunted individuals than those based on long-bone measurements in the upper limbs. This needs to be investigated further in larger samples of the South African population, as inaccurate recording of height may have clinical implications, particularly in critically ill patients.
Acknowledgements
The authors would like to thank the Department of Health, Free State and the managers of Pelonomi, National and Universitas Hospitals for allowing this study, as well as the participants and the hospital dietitians for their assistance.
References
- Kondrup J, Allison SP, Elia M, et al. ESPEN guidelines for nutrition screening 2002. Clinical Nutrition 2003;22(4):415–21. doi: 10.1016/S0261-5614(03)00098-0.
- Fraipont V, Preiser J-C. Energy estimation and measurement in critically ill patients. JPEN J Parenter Enteral Nutr. 2013;37(6):705–13. doi: 10.1177/0148607113505868.
- Boullata J, Williams J, Cottrell F, et al. Accurate determination of energy needs in hospitalized patients. J Am Diet Assoc. 2007;107(3):393–401. doi: 10.1016/j.jada.2006.12.014.
- Bergström EM, Savic G, Short DJ, et al. Predicting normal lung function in patients with childhood spinal cord injury. Spinal Cord. 2003;41(6):354–8. doi: 10.1038/sj.sc.3101451.
- Benisty K, Zappitelli M. Measures of GFR in health and disease. Curr Pediatr Rep. 2015;3(1):101–10. doi: 10.1007/s40124-014-0067-3.
- Pai MP. Drug dosing based on weight and body surface area: mathematical assumptions and limitations in obese adults. Pharmacotherapy. 2012;32(9):856–68. doi: 10.1002/j.1875-9114.2012.01108.x.
- Lee RD, Nieman DC. Nutritional assessment. 6th ed.. New York, NY: McGraw-Hill; 2013.
- Chen C, Gowan M, Bushwitz J, et al. 858. Crit Care Med. 2014;42(12):A1567. doi: 10.1097/01.ccm.0000458355.82676.82.
- Barbosa VM, Stratton RJ, Lafuente E, et al. Ulna length to predict height in English and Portuguese patient populations. Eur J Clin Nutr. 2012;66(2):209–15. doi: 10.1038/ejcn.2011.177.
- Griebeler ML, Levis S, Beringer L-M, et al. Self-reported versus measured height and weight in hispanic and non-hispanic menopausal women. J Women’s Health. 2011;20(4):599–604. doi: 10.1089/jwh.2009.1850.
- Gorber S, Tremblay M, Moher D, et al. A comparison of direct vs. self-report measures for assessing height, weight and body mass index: a systematic review. Obes Rev. 2007;8(4):307–26. doi: 10.1111/j.1467-789X.2007.00347.x.
- Hendershot KM, Robinson L, Roland J, et al. Estimated height, weight, and body mass index: implications for research and patient safety. J Am Coll Surg. 2006;203(6):887–93. doi: 10.1016/j.jamcollsurg.2006.08.018.
- Malnutrition Advisory Group (MAG), BAPEN. Malnutrition Universal Screening Tool: The 5 “MUST” tools. 2011 [cited 2016, Jan 4]. Available from: http://www.bapen.org.uk/pdfs/must/must_full.pdf.
- Malnutrition Advisory Group (MAG), BAPEN. The “MUST” Explanatory Booklet. A Guide to the ‘Malnutrition Universal Screening Tool’ (‘MUST’) for Adults. In: V Todorovic, C Russell, R Stratton, et al., (eds.). BAPEN; 2011 [cited 2016, Jan 4]. Available from: http://www.bapen.org.uk/pdfs/must/must_full.pdf.
- Gibson RS. Principles of nutritional assessment. New York: Oxford University Press; 2005.
- Krishan K, Vij K. Diurnal variation of stature in three adults and one child. Anthropologist. 2007;9(2):113–7.
- Madden AM, Tsikoura T, Stott DJ. The estimation of body height from ulna length in healthy adults from different ethnic groups. J Hum Nutr Diet. 2012;25(2):121–8. doi: 10.1111/j.1365-277X.2011.01217.x.
- Mahakkanukrauh P, Khanpetch P, Prasitwattanseree S. Stature estimation from long bone lengths in a Thai population. Forensic Sci Int. 2011;210(1–3):279.e1–e7. doi: 10.1016/j.forsciint.2011.04.025.
- Agnihotri AK, Kachhwaha S, Jowaheer V, et al. Estimating stature from percutaneous length of tibia and ulna in Indo-Mauritian population. Forensic Sci Int. 2009;187(1–3):109.e1–e3. doi: 10.1016/j.forsciint.2009.02.010.
- Bland JM, Altman DG. Applying the right statistics: analyses of measurement studies. Ultrasound Obstet Gynecol. 2003;22(1):85–93. doi: 10.1002/uog.122.
- Giavarina D. Understanding bland altman analysis. Biochemia Medica 2015;25(2):141–51. doi: 10.11613/BM.2015.015.
- Bjelica D, Popovic S, Kezunovic M, et al. Body height and its estimation utilising arm span measurements in Montenegrin adults. Anthropol Notebooks. 2012;18(2):69–83. doi: 10.4067/S0717-95022013000100043.
- Fogal AS, Franceschinni SDCC, Priore SE, et al. Stature estimation using the knee height measurement amongst Brazilian elderly. Nutr Hosp. 2015;31(2):829–34. doi: 10.3305/nh.2015.31.2.7618.
- Bogin B, Varela-Silva MI. Leg length, body proportion, and health: a review with a note on beauty. Int J Environ Res Public Health. 2010;7(3):1047–75. doi: 10.3390/ijerph7031047.
- Onis M. Assessment of differences in linear growth among populations in the WHO Multicentre Growth Reference Study. Acta Paediatr. 2007;95:56–65. doi: 10.1111/j.1651-2227.2006.tb02376.x.
- H.Survey. Height and weight of adults ages 18-74 years by socioeconomic and geographic variables, United States: Data from the National Health Survey Series 11, No. 224. National Center for Health Statistics. DHHS publication; no. (PHS) 81-1674). 1981.
- World Health Organisation. Global Nutrition Targets 2015: Stunting Policy Brief. WHO/NMH/NHD/14.3. 2012;(9).
- World Health Organisation. Global Health Observatory data repository: Joint child malnutrition estimates (UNICEF-WHO-WB) - Global and regional trends for stunting by WHO Regions, 1990-2014 [cited 2015, Dec 9]. Available from: http://apps.who.int/gho/data/node.main.NUTWHOREGIONS?lang=en.
- Shisana O, Labadarios D, Rehle T, et al. South African National Health and Nutrition Examination Survey (SANHANES-1). Cape Town: HSRC Press; 2013.
- Kaore A, Kaore BP, Kamdi A, et al. Stature estimation from tibial length. NJIRM. 2012 [cited 2015, Dec 9];3(2):51–6. Available from: http://imsear.li.mahidol.ac.th/bitstream/123456789/152044/1/njirm2012v3n2p51.pdf.
- Auyeung TW, Lee JSW, Kwok T, et al. Estimation of stature by measuring fibula and ulna bone length in 2443 older adults. J Nutr Health Aging. 2009 [cited 2015, Dec 9];13(10): 931–6. Available from: http://www.ncbi.nlm.nih.gov/pubmed/19924356.10.1007/s12603-009-0254-z
- Melo A, De Salles R, Vieira F, et al. Methods for estimating body weight and height in hospitalised adults: a comparative analysis. RBCHD. 2014;16(4):475–84. doi: 10.5007/1980-0037.2014v16n4p47.
- Vintzileos AM, Campbell WA, Neckles S, et al. The ultrasound femur length as a predictor of fetal length. Obstet Gynecol. 1984 Dec;64(6):779–82.
- Van den Berg L, Dannhauser A, Nel M. Agreement between estimated and measured heights and weights in hospitalised patients - A retrospective study. South African J Clin Nutr. 2010 [cited 2015, Dec 9];23(2):S73–S74. Available from: http://www.sajcn.co.za/index.php/SAJCN/article/view/421
- Trivedi A, Saxena S, Morya R, et al. Stature estimation using per-cutaneous tibial length in people of Gwalior region. IOSR J Dent Med Sci. 2014 [cited 2015, Dec 9];13(5):65–70. Available from: http://www.iosrjournals.org/iosr-jdms/papers/Vol13-issue5/Version-1/O013516570.pdf10.9790/0853