
Abstract
Objective: In South Africa, urbanisation is associated with substantial burdens of adolescent overweight and obesity, making teenagers vulnerable to longer-term non-communicable diseases. In addition, as potential future parents, the nutritional status of adolescents is increasingly recognised as a key driver of health and well-being in the next generation. This review reported on the available literature examining nutritional status and dietary intakes and practices, as well as their determinants, in South African adolescents.
Study design and methods: Medline (Pubmed), Web of Science and EMBASE were searched for relevant articles published between 1994 and May 2018. Applicable search terms and phrases were identified in study titles and/or abstracts and full-text articles were reviewed according to inclusion/exclusion criteria. Data were extracted according to specific review objectives.
Results: A total of 67 relevant studies were identified. Only one study used a biochemical marker to describe adolescent nutritional status (vitamin D status; 25(OH)D). Overweight and obesity prevalence increased in South African adolescents over the reference period, with national increases of 6% in boys and 7% in girls between 2002 and 2008. Girls and urban-dwellers were particularly vulnerable to excess adiposity. Dietary intakes demonstrated a transition towards energy-dense, processed foods high in sugar and fat, but low in essential micronutrients. Food choices were driven by the adoption of obesogenic behaviours in the teenage years, including irregular breakfast consumption and fewer family meals, increased snacking and low levels of physical activity.
Conclusion: South African adolescents—particularly girls—are increasingly burdened by obesity as a result of urbanisation-associated shifts in dietary intake and eating behaviours. However, the implications for micronutrient status and long-term nutritional health are not known. Additionally, more data on the clustering of diet, activity and sedentary behaviours in adolescent boys and girls is needed, as well as on behaviour patterns to facilitate healthy growth and reduced adiposity.
Introduction
Adolescence is a period of growth and development that is increasingly being recognised as a critical window for optimising the health and well-being of current and future generations.Citation1,Citation2 While it is principally defined by the puberty-associated physiological changes that characterise a child’s transition to adulthood, adolescence encompasses a range of developmental changes that form the foundation of one’s ability to thrive physically, socially and emotionally as an adult.Citation1,Citation3 In addition, the interplay between early life (prenatal, infant and childhood) growth and development and the physical and social environment experienced during adolescence may play a critical role in shaping the health trajectory of an individual, as well as of any future offspring.Citation2,Citation3
It is widely accepted that optimising growth and development during the first 1 000 days of life can result in substantial benefits, namely: reductions in childhood morbidity and mortality risk; improvements in cognitive and motor development, school performance and economic productivity in adulthood; and reductions in the risk of becoming obese or developing non-communicable diseases (NCDs) in later life.Citation4 While the importance of maternal nutrition and lifestyle in programming early growth and development is well established, research and intervention strategies have focused largely on nutritional status, diet and physical activity during pregnancy when the maternal risk profile is already established and the scope for affecting both maternal and infant outcomes is limited.Citation5–7 In addition, there has been a lack of focus on the role that paternal nutritional status, attitudes and behaviour may have on the offspring both physiologically and at the level of partner and/or parental influence.Citation2,Citation8,Citation9 As shown recently by Patton et al., prioritising adolescent nutritional status in both females and males, as well as promoting healthy attitudes and behaviours around diet, physical activity, substance use and stress in this population, are critical to improving the intergenerational transmission of health and well-being.Citation2 In addition, it provides a window for intervention, during which investment is likely to yield substantial benefits for health, social development and economic growth and capacity.Citation2,Citation10
Adolescents and youth (10–24 years of age) constitute almost one-quarter of the world’s population, with more than 80% of this group living in low- and middle-income countries (LMICs).Citation11 While improvements in childhood nutrition and health, education and rapid technological advancements, as well as access to effective contraception and delayed timing of parenthood, provide a platform upon which adolescents should thrive, their health and well-being face substantial threats during this time.Citation1,Citation3 As individuals progress through adolescence their exposure to social health determinants undergoes a considerable shift. This means that the parental/family-dominated determinants of lifestyle choices in childhood expand to include the influence of peers, the community, culture, education, the media and the economy.Citation10 Within this context, growing levels of independence make adolescents highly susceptible to the adoption of obesogenic behaviours that may persist into adulthood, thereby increasing the risk of obesity and NCDs in later life.Citation1,Citation10,Citation12,Citation13 In LMICs rapid urbanisation exacerbates this by exposing young people to increasingly Westernised diets—high in saturated fat, added sugar, salt, processed/convenience foods and edible oils—in environments characterised by low levels of physical activity.Citation14–16 This is particularly relevant in sub-Saharan Africa where overweight and inactivity rates are comparatively higher than in other LMIC regions.Citation17
In South Africa, where this nutrition transition has progressed considerably, approximately 27% of females and 9% of males are overweight or obese by 15–19 years of age, with those living in urban settings being particularly vulnerable.Citation18 Additionally, since the dawn of South Africa’s democracy in 1994, policy changes around food production, composition and availability, as well as economic accessibility and education, have further reshaped the landscape of food consumption and activity patterns, predominantly in previously restricted black communities.Citation19–21 These policy changes are outlined in . Particularly since 1994 school feeding programmes have been implemented and expanded, and child support grants established, to improve food security at both individual and household levels. In 1995 a multi-sector policy aimed at addressing both clinical (leading to hospitalisation) and sub-clinical malnutrition was introduced and in 2003 a mandatory micronutrient fortification policy for maize and wheat was developed. More recently policies for salt reduction (2016) and sugar-sweetened beverage taxation (2017) were introduced in response to the country’s rising obesity and NCD burdens. While these government policies highlight that nutrition-based issues are on the national agenda, their coverage and effectiveness are widely debated and their impact on adolescent nutrition is less clear.
Table 1: National policy changes that may impact adolescent nutritional status in South Africa (1994–2017)
Although individual studies have explored nutritional status, dietary intake and physical activity, as well as perceptions and attitudes around healthy eating and body image in rural and/or urban South Africa, relationships between these components and their determinants are not known. A comprehensive examination of nutritional health and well-being in the adolescent population is therefore critical to understanding the possible means of addressing the rapidly growing obesity epidemic in this—and future—generations.
In this review our aim was to report on the available literature examining nutritional status and dietary intake and practices, as well as their determinants, in South African adolescents. Data were therefore reviewed according to five specific objectives that summarised the following variables in rural and/or urban South African adolescents (10–20 years):
nutritional status (anthropometric, biochemical and dietary indicators of macro- and micronutrient intakes);
food consumption, dietary patterns and eating habits;
diet, eating habits and demographic and lifestyle factors (age, setting, socioeconomic status (SES) etc.) and their associations with adolescent adiposity (e.g. body mass index [BMI]/fat mass);
body image perceptions and eating attitudes;
qualitative perceptions of, and attitudes towards, healthy eating and physical activity.
Methods
Search strategy
Comprehensive literature searches were performed in March 2018 by a team of researchers. Searches identified all available studies describing adolescent nutritional status, and its determinants, since the establishment of democracy in 1994. Searches were conducted using the following databases: Medline (Pubmed), Web of Science and EMBASE. Searches included the following search terms and phrases, as well as any applicable variations: adolescent and anthropometry/(specific anthropometric measure of interest, e.g. body mass index)/nutrition/(specific nutrient of interest, e.g. protein or iron)/(specific micronutrient deficiency of interest, e.g. anaemia)/(specific nutritional biomarker of interest, e.g. ferritin)/(specific dietary intake assessment method of interest, e.g. food frequency questionnaire) and Africa (full description of search terms is provided in Supplementary Appendix A). Search terms and phrases were used in various combinations for identification in study titles and/or abstracts. Full-text articles were obtained and reviewed to select those meeting the inclusion/exclusion criteria described below. Data were subsequently extracted from relevant publications into appropriate tables.
Selection criteria
Inclusion criteria
Studies conducted in South Africa.
Studies conducted in males and/or females aged 10–20 years.
Any study design.
For observational studies:
studies that described adolescent nutritional status (assessed using anthropometry and/or objectively measured body composition [weight and/or height and/or BMI and/or waist circumference and/or body fat percentage] and/or biochemical indicators and/or reported dietary intakes) as an exposure and/or outcome; and
studies that used quantitative methods to assess attitudes and/or perceptions and/or degree of satisfaction towards nutritional status (body size, composition, diet) or behaviours.
For intervention studies:
nutritional intervention studies done in adolescents (with or without physical activity component(s) incorporated) with dietary values and/or where biochemical indicators from both the intervention and control group could be extracted.
For qualitative studies:
studies that explored thoughts on dietary behaviours and practices (with or without physical activity) and their determinants;
studies that explored perceptions and attitudes towards healthy dietary and lifestyle (e.g. physical activity) practices;
studies using any of the following qualitative research methods: observations, face-to-face interviews, focus-group discussions; and
studies using any qualitative analytical methods.
4. Studies published in peer-reviewed journals and/or as academic dissertations
Exclusion criteria
Studies conducted in animals.
Studies conducted in languages other than English.
Studies published prior to 1994.
Studies which do not describe nutritional status (anthropometry and/or biochemical indicators and/or reported dietary intakes) using aggregate data summarised as mean (SD) and/or median (IQR or 95% confidence interval).
Results
In total, 67 studies met the inclusion/exclusion criteria () and their characteristics are described in .Citation22–88
Figure 1. Flow diagram to illustrate the results of the literature review.
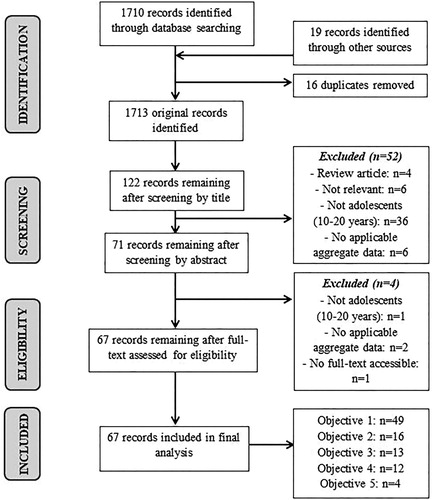
Table 2: Characteristics of studies meeting inclusion and exclusion criteria
The majority of studies were conducted within eight of South Africa’s nine provinces (i.e. the country’s principal administrative districts); specifically: Eastern Cape (n = 3),Citation72,Citation75,Citation76 Free State (n = 1),Citation71 Gauteng (n = 25),Citation22,Citation26,Citation31,Citation32,Citation35–37,Citation40,Citation46,Citation48–52,Citation56–58,Citation61–63,Citation69,Citation77–80 KwaZulu -Natal (n = 3),Citation23,Citation59,Citation60 Limpopo (n = 4),Citation28,Citation29,Citation81,Citation83 Mpumalanga (n = 8),Citation44,Citation45,Citation66–68,Citation73,Citation82,Citation86 North West (n = 9)Citation25,Citation27,Citation30,Citation42,Citation47,Citation64,Citation65,Citation74,Citation88 and Western Cape (n = 8).Citation24,Citation33,Citation41,Citation43,Citation53–55,Citation84 In addition, two studies compared adolescents across provinces (Mpumalanga vs. LimpopoCitation85; Mpumalanga vs. GautengCitation87) and four used national survey data.Citation34,Citation38,Citation39,Citation70 Eleven pairs of studies were based on the same study sample and are therefore presented together.Citation28,Citation29,Citation38,Citation39,Citation44,Citation45,Citation49–54,Citation57–60,Citation66,Citation67,Citation75–78 The publication year ranged from 1997 to 2018. Sixteen studies used quantitative cross-sectional or longitudinal data (various ages between 10 and 19 years) from the Birth-to-Twenty (BTT) cohort, an urban longitudinal birth cohort in Soweto, Gauteng (n = 3273).Citation31,Citation35–37,Citation46,Citation48–50,Citation57,Citation58,Citation61,Citation77–80,Citation87 Of the remaining studies, 47 followed quantitative cross-sectional designs and four were qualitative studies.Citation51,Citation52,Citation68,Citation83 Sample size ranged between 50 and 3 490 for quantitative studies and between 22 and 58 for qualitative studies. 19 studies were conducted in rural contextsCitation23,Citation28,Citation29,Citation44,Citation45,Citation53,Citation54,Citation59,Citation60,Citation66–68,Citation73,Citation75,Citation76,Citation81,Citation82,Citation85,Citation86 and 35 in urban and/or peri-urban contextsCitation22,Citation24,Citation26,Citation31,Citation33,Citation35–37,Citation40–42,Citation46,Citation48–52,Citation55–58,Citation61–65,Citation69,Citation71,Citation72,Citation77–80,Citation84,Citation88; with two studies comparing rural and urban populations.Citation32,Citation87 Ten studies included mixed populationsCitation25,Citation27,Citation30,Citation34,Citation38,Citation39,Citation43,Citation47,Citation70,Citation74 and one did not specify the context.Citation83 Twelve studies included specifically black adolescentsCitation25,Citation27,Citation34,Citation35,Citation37,Citation42,Citation49,Citation50,Citation57,Citation65,Citation79,Citation87 and one specifically white adolescents,Citation69 with the remaining studies using populations of mixed ethnicities.
The results of the included scientific papers are structured and presented below according to the specific review objectives. No weighting was applied across studies and therefore the data presented are actual findings per study.
Adolescent nutritional status
In total, 49 studies met the inclusion criteria for objective one.Citation23–25,Citation27–32,Citation34,Citation35,Citation38,Citation39,Citation42–45,Citation47–50,Citation53,Citation54,Citation56–60,Citation62–67,Citation70–72,Citation74–81,Citation84–87 Of the included studies, all but four described adolescent nutritional status using one or more of the following anthropometric measurements: height and weight, BMI and waist circumference.Citation24,Citation25,Citation27–32,Citation34,Citation38,Citation39,Citation42–45,Citation47–50,Citation53,Citation54,Citation56–60,Citation62–67,Citation70–72,Citation74,Citation77–81,Citation84–87 Where stunting prevalence was included, two studies used the WHO child growth standardsCitation43,Citation71,Citation89 and one used the Centers for Disease Control and Prevention (CDC)/ National Center for Health Statistics (NCHS) growth chartsCitation34,Citation90 to define stunting. Five studies additionally included objectively measured body fat percentage via dual-energy X-ray absorptiometry (DXA),Citation48,Citation77 air displacement plethysmography (ADP)Citation42,Citation65 or bio-impedance.Citation59 One study used a nutritional biomarker (vitamin D status; 25(OH)D)Citation48 and five used reported dietary intakesCitation25,Citation27,Citation30,Citation31,Citation86 in addition to anthropometric assessments. The remaining four studies used reported dietary intakes alone.Citation23,Citation35,Citation75,Citation76
Weight, height and BMI ()
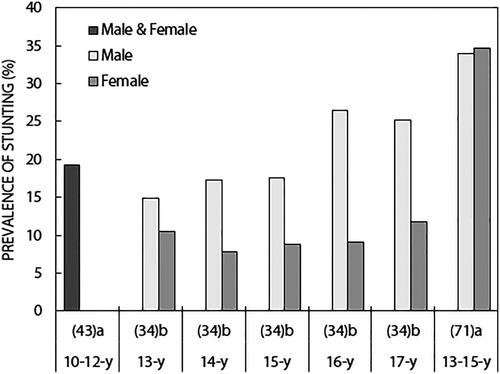
Studies showed an anticipated increase in both height and weight of South African adolescents between 10 and 19 years of age (). Across age categories, white adolescents were taller than both their black and mixed-ancestry counterparts and urban dwellers were taller than those from rural settings.Citation24,Citation31,Citation32,Citation48,Citation66,Citation67,Citation87 Similar results were shown for weight; however, the differences according to ethnicity and rural vs. urban settings were less consistent across studies. While height was similar in boys and girls between the ages of 10 and 13 years, boys were comparatively taller at older ages (15–18 years).Citation48–50,Citation57,Citation58,Citation66,Citation67,Citation77–79,Citation87 In addition, for boys aged 11–12 years, height was substantially higher in those who had reached greater sexual maturity according to Tanner staging.Citation53,Citation54 Although females tended to be smaller in stature than their male counterparts as they aged, they were less likely to be stunted (height-for-age z-score (HAZ) < −2) throughout adolescence ([13 years, stunted: 14.9% (M), 10.5% (F)]; [17 years, stunted: 25.2% (M), 11.8% (F)])Citation34 (). Stunting prevalence was relatively stable across age groups in girls; however, older boys demonstrated approximately 10% higher stunting prevalence than those of younger ages (17 vs. 13 years).Citation34
Figure 2: Results from studies describing height (mean/median) of South African adolescents according to age (years). Abbreviations: UBM, urban black male; UBF, urban black female; UWM, urban white male; UWF, urban white female; RMF, rural male and female; RBM, rural black male; RBF, rural black female; UMAM, urban mixed-ancestry male; UMAF, urban mixed-ancestry female.
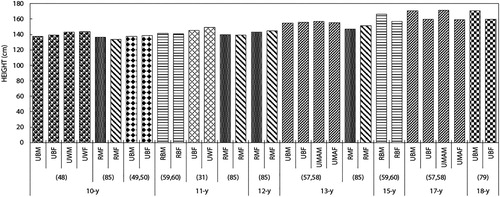
Figure 3: Results from studies describing height (mean/median) of South African adolescents according to age (years; range). Abbreviations: NSBM, non-stunted black male; SBM, stunted black male; NSBF, non-stunted black female; SBF, stunted black female; TS2, Tanner stage 2; TS3, Tanner stage 3; TS4, Tanner stage 4; TS5, Tanner stage 5; RBM, rural black male; RBF, rural black female; UBM, urban black male; UBF, urban black female; UB, urban black; UW, urban white; PUM, peri-urban male; PUF, peri-urban female; RB, rural black; M, male; F, female; UMAF, urban mixed-ancestry female; UM, urban male; UF, urban female.
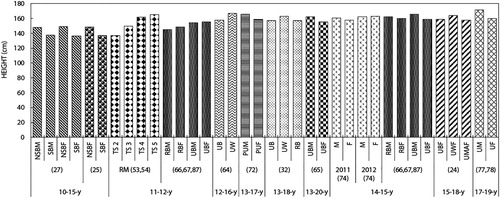
Figure 4: Results from studies describing weight (mean/median) of South African adolescents according to age (years). Abbreviations: UBM, urban black male; UBF, urban black female; UWM, urban white male; UWF, urban white female; RMF, rural male and female; RBM, rural black male; RBF, rural black female; UMAM, urban mixed-ancestry male; UMAF, urban mixed-ancestry female; M, male; F, female.
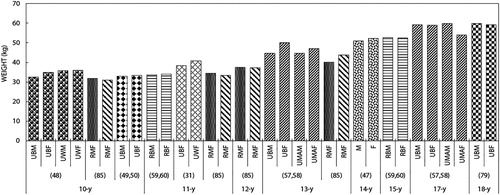
Figure 5: Results from studies describing weight (mean/median) of South African adolescents according to age (years; range). Abbreviations: MF, male and female; NSBM, non-stunted black male; SBM, stunted black male; NSBF, non-stunted black female; SBF, stunted black female; TS2, Tanner stage 2; TS3, Tanner stage 3; TS4, Tanner stage 4; TS5, Tanner stage 5; RBM, rural black male; RBF, rural black female; UBM, urban black male; UBF, urban black female; UB, urban black; UW, urban white; PUM, peri-urban male; PUF, peri-urban female; RB, rural black; M, male; F, female; UMAF, urban mixed-ancestry female; UM, urban male; UF, urban female.
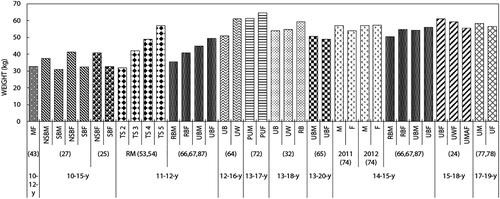
Figure 6: Results from studies describing the stunting prevalence in South African adolescents according to age (years). aWHO child growth standards. Citation89 bCDC/NCHS growth charts. Citation90
National survey data demonstrated an increase in combined overweight and obesity prevalence in South African adolescents (13–19 years) between 2002 and 2008, with substantially higher prevalence in girls in both years ([2002: 7.9% (male, M), 29.3% (female, F)]; [2008: 14.3% (M), 36.5% (F)]) ().Citation38,Citation39 Overweight and obesity were defined using the International Obesity Task Force age- and gender-specific cutpoints for children and adolescents based on BMIs of 25 and 30 kg/m2 respectively at 18 years.Citation91
Cross-sectional studies conducted in various rural and/or urban South African settings showed an overall increase in both BMI and prevalence of combined overweight and obesity as adolescents aged between 10 and 20 years (). This increase was predominantly driven by increased adiposity in girls. Longitudinal data from the BTT cohort similarly showed higher overweight/obesity prevalence in girls at all ages, regardless of ethnicity (black, white and mixed-ancestry participants)Citation57,Citation58,Citation77,Citation78,Citation80 ( and ).
Figure 7: Results from studies describing body mass index (BMI; mean/median) of South African adolescents according to age (years). Abbreviations: UBM, urban black male; UBF, urban black female; UWM, urban white male; UWF, urban white female; RMF, rural male and female; RBM, rural black male; RBF, rural black female; UMAM, urban mixed-ancestry male; UMAF, urban mixed-ancestry female; BM, black male; BF, black female; MF, male and female; M, male; F, female.
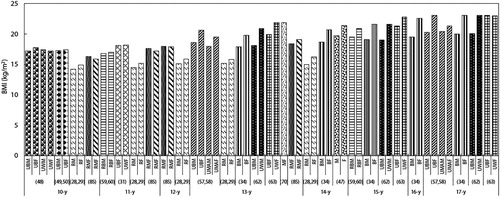
Figure 8: Results from studies describing body mass index (BMI; mean/median) of South African adolescents according to age (years; range). Abbreviations: NSBM, non-stunted black male; SBM, stunted black male; NSBF, non-stunted black female; SBF, stunted black female; M, male; F, female; TS2, Tanner stage 2; TS3, Tanner stage 3; TS4, Tanner stage 4; TS5, Tanner stage 5; UM, urban male; UF, urban female; RBM, rural black male; RBF, rural black female; UBM, urban black male; UBF, urban black female; UB, urban black; UW, urban white; PUM, peri-urban male; PUF, peri-urban female; RB, rural black; MF, male and female; UWF, urban white female; UMAF, urban mixed-ancestry female.
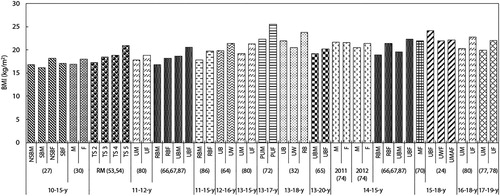
Figure 9: Results from studies describing the combined overweight and obesity prevalence in South African adolescents according to age (years) Abbreviations: UBM, urban black male; UBF, urban black female; UMAM, urban mixed-ancestry male; UMAF, urban mixed-ancestry female; UWF, urban white female; BM, black male; BF, black female; M, male; F, female; RBM, rural black male; RBF, rural black female.
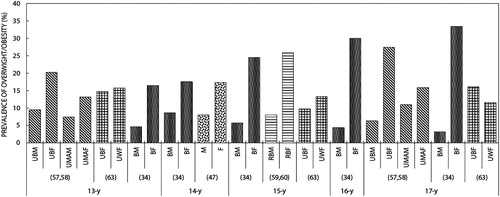
Figure 10: Results from studies describing the combined overweight and obesity prevalence in South African adolescents according to age (years; range). Abbreviations: MF, male and female; UM, urban male; UF, urban female; RMF, rural male and female; M, male; F, female; NS, non-stunted; S, stunted; RM, rural male; RF, rural female; PUM, peri-urban male; PUF, peri-urban female; UBF, urban black female; UWF, urban white female; UMAF, urban mixed-ancestry female.
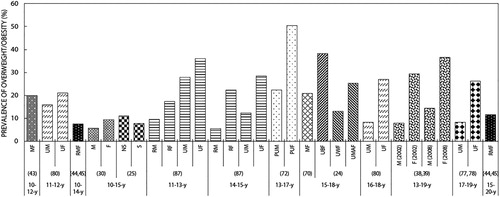
When comparing black and white adolescents in an urban setting, although the overweight/obesity prevalence was similar in black and white girls at 13 years of age (14.8% [black] vs. 15.7% [white]), there was a substantially higher prevalence of overweight/obesity in black girls at 17 years (16.1% [black] vs. 11.6% [white]).Citation63 The opposite was seen in boys (13, 15, 17 years), with higher combined overweight/obesity prevalence in white compared with black boys (28.8% [white] vs. 11.2% [black]).Citation62 Black girls demonstrated higher overweight/obesity prevalence than their mixed-ancestry counterparts at both 13 and 17 years of age (13 years: 20.2% [black], 13.2% [mixed ancestry]; 17 years: 27.5% [black], 15.9% [mixed ancestry]). While this was similar for boys at 13 years of age, mixed-ancestry boys showed higher overweight/obesity prevalence rates than their black counterparts at 17 years (13 years: 9.5% [black], 7.4% [mixed ancestry]; 17 years: 6.3% [black], 11.0% [mixed ancestry]).Citation57,Citation58
In both early (11–13 years) and mid-adolescent (14–15 years) black boys and girls, the combined overweight and obesity prevalence was higher in those from urban ([early adolescent: 27.9% (M), 36.1% (F)]; [mid-adolescent: 12.3% (M), 28.5% (F)]) compared with rural settings ([early adolescent: 9.5% (M), 17.3% (F)]; [mid-adolescent: 5.5% (M), 22.3% (F)]).Citation87
Adiposity ( and )
Across age categories the majority of studies showed higher waist circumference in girls compared with boysCitation64,Citation66,Citation67,Citation72,Citation81,Citation86 (). White adolescents had higher waist circumference than their black counterparts at 12–16 years (65.5 cm [black], 70.4 cm [white])Citation64 and waist circumference tended to be higher in adolescents from urban vs. rural settings.Citation64,Citation66,Citation67,Citation72,Citation81,Citation86 Body fat percentage (%fat) was similarly lower in boys vs. girls throughout adolescence ([11 years: 12.3% (M), 20.3% (F)]; [14 years: 13.7% (M), 20.5% (F)]; [15 years: 9.0% (M), 24.7% (F)])Citation47,Citation59,Citation60 ().
Figure 11: Results from studies describing central adiposity (waist circumference; mean/median) of South African adolescents according to age (years; range). Abbreviations: RM, rural male; RF, rural female; NSBM, non-stunted black male; SBM, stunted black male; NSBF, non-stunted black female; SBF, stunted black female; RBM, rural black male; RBF, rural black female; UB, urban black; UW, urban white; PUM, peri-urban male; PUF, peri-urban female; MNF, male normal body fat percentage (%fat); FNF, female normal %fat; MHF, male high %fat; FHF, female high %fat; UBM, urban black male; UBF, urban black female.
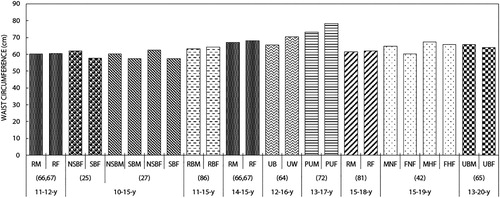
Table 3: Results from studies describing adiposity in South African adolescents.
When stratified according to non-stunted (NS) vs. stunted (S) adolescents, 10–15-year-old stunted boys and girls had lower %fat ([M: 14.2% (NS) vs. 12.5% (S)]; [F: 22.8% (NS) vs. 19.3% (S)]) and waist circumferences ([M: 60.3 cm (NS) vs. 57.5 cm (S)]; [F: 62.4 cm (NS) vs. 57.5 cm (S)]) than their non-stunted counterparts.Citation27
Biochemical markers (data not shown)
The single study describing any biochemical marker of micronutrient status in adolescent South Africans focused on Vitamin D status as assessed by serum 25-hydroxyvitamin D (25(OH)D).Citation48 25(OH)D was higher in white compared with black adolescents (male: 129 ± 37.1 nmol/l [white], 100 ± 34.3 nmol/l [black]; female: 112 ± 34.8 nmol/l [white], 86 ± 31.1 nmol/l [black]). Some 22% and 12% of black and white adolescents respectively had insufficient vitamin D levels (50–74 nmol/l), while 8% and 1% of black and white adolescents respectively were vitamin D deficient (< 50 nmol/l).Citation48
Reported dietary nutrient intakes ()
Of the nine studies reporting dietary nutrient intakes in South African adolescents, seven used 24-hour recallCitation23,Citation25,Citation27,Citation30,Citation31,Citation75,Citation76 and two used a quantitative food frequency questionnaire (QFFQ)Citation35,Citation86 to describe intakes. Where 24-hour recalls were utilised, only two studies used a repeated recall method (one week and one weekend day),Citation75,Citation76 with the remaining five using recall for a single day. However, three of these articles used data from the THUSA BANA study (Transition and Health during Urbanisation of South Africans; BANA, children) which validated its recall method via a repeated recall and a 3-day weighed record in a sub-sample.Citation25,Citation27,Citation30 While MacKeown et al. stated that QFFQs had been demonstrated as valid and reproducible instruments in other South African populations and that the same QFFQ was consistently used across time interceptions, the specific questionnaire was not validated.Citation35 In the case of Pisa et al., a QFFQ developed for the South African population was utilised and included nationally representative food items consumed by at least 3% of the population.Citation73 It also incorporated validated instruments for portion size estimation.Citation73 For studies that assessed reported micronutrient intakes, those of key micronutrients common across studies are presented in .
Table 4: Results from studies describing reported dietary nutrient intakes of South African adolescents
Median energy intakes were similar in rural adolescents at 9–13 and 14–18 years of age (7 172 kJ/d and 7 141 kJ/d respectively); with a slightly higher total fat intake at 14–18 years (48 g/d [9–13 years]; 50 g/d [14–18 years]).Citation75,Citation76 Intakes of most of the micronutrients assessed (iron, magnesium, zinc and folate) were similar across age groups; however, vitamin C intake was higher in the 9–13 year group (23.8 mg/d [9–13 years]; 18.1 mg/d [14–18 years]).Citation75,Citation76 Rural boys demonstrated higher energy intakes than girls at 11–15 years (9 900 kJ/d and 6 670 kJ/d respectively); however, girls had higher fat (32 g/d [M] vs. 37.8 g/d [F]), protein (39 g/d [M] vs. 42 g/d [F]) and cholesterol (25.2 g/d [M] vs. 43 g/d [F]) intakes.Citation86
In the North West province, 10–15-year-old boys and girls had mean energy intakes of 8 014 kJ/d and 7 397 kJ/d respectively.Citation30 Mean fat intake was 56 g/d for boys and 53 g/d for girls, thereby contributing to 26.5% and 27.1% of daily energy intake in boys and girls respectively.Citation75 Energy, macro- and micronutrient intakes were similar in stunted compared with non-stunted 10–15-year-old black adolescents.Citation25,Citation27
Within the BTT cohort, energy and total fat intakes were similar between black and white girls at 11 years of age (energy: 5 422 kJ/d [black], 5 055 kJ/d [white]; fat: 38 g/d [black], 42 g/d [white]).Citation31 For BTT black boys and girls specifically, median energy intakes increased from 1 767 kcal/d to 2 127 kcal/d between the ages of 10 and 13 years; however, 73% and 59% of adolescents had intakes below the recommended dietary allowance (RDA; Food and Nutrition BoardCitation94) at 10 and 13 years respectively.Citation35 Daily intakes of all macro- and micronutrients similarly increased with age; however, increases in protein (56–59 g/d) and fibre (22–23 g/d) intake were small compared with those of carbohydrate (279–323 g/d), fat (51–70 g/d) and added sugar (68–102 g/d).Citation35 Intakes of calcium, iron, zinc, vitamin A, riboflavin and niacin were below the RDA at 10 and 13 years, while vitamin B6 and vitamin C intakes were below the RDA at 10 years only (data not shown).Citation35
Food intakes, diet patterns and eating practices ()
Sixteen studies met the inclusion criteria for Objective 2.Citation23,Citation33,Citation36,Citation37,Citation40,Citation41,Citation43,Citation46,Citation57,Citation61,Citation73,Citation75,Citation76,Citation84,Citation87,Citation88 Data collection was questionnaire based for all studies and included: dietary assessment via FFQ and/or 24-hour recall,Citation36,Citation43,Citation73,Citation75,Citation76,Citation84 as well as data on dietary habits and eating practices,Citation23,Citation33,Citation46,Citation57,Citation61,Citation87 nutrition knowledge,Citation40,Citation41,Citation43,Citation75,Citation76 and fast-food intake/availability.Citation37
Table 5: Results from quantitative studies describing food intakes, diet patterns and eating practices habits in South African adolescents
The odds of higher ‘Unhealthy Dietary Pattern (UDP)’ scores were 2.77 times higher in the lowest vs. highest SES group (SES defined according to a combined scale of annual household income and highest level of parental education).Citation84 In addition, adolescents attending high SES schools had better knowledge of healthy vs. unhealthy foods (p < 0.01) and were more likely to bring a lunchbox to school (p < 0.001).Citation33 Lunchbox usage was associated with younger age and urban school attendance (p < 0.001), as well as higher standards of living (p < 0.001), dietary diversity scores (p = 0.012) and number of meals per day (p < 0.001).Citation43 In addition, adolescents who brought food to school had lower BMI percentiles (p = 0.002) and BMI-for-age (p = 0.034) than those purchasing food at school.Citation43 Overall, ‘unhealthy’ food items were brought to school twice as often as ‘healthy’ foods and 70% of adolescents who purchased food at school reported purchasing no healthy items.Citation33 Many adolescents (47–61%) could not correctly identify less healthy food items (including sugar-sweetened beverages, samosas and pies).Citation33
In urban adolescents, the most commonly consumed food items were: rice, stiff maize-meal porridge, chicken, added sugar, sweets, tea, eggs, full-cream milk, carbonated beverages and oil.Citation36 Consumption of grains, dairy products and fruits and vegetables decreased and consumption of meat and meat substitutes (e.g. chicken, cheese and polony) and oil increased with age.Citation36 Between the ages of 13 and 17 years, regular breakfast consumption and lunchbox usage decreased, with adolescents purchasing more food at school.Citation46,Citation57 Snacking while watching television increased with age (3.6 ± 4.6–6.7 ± 5.9 snacks/week), with girls consuming significantly more snacks than boys (p < 0.01).Citation46 Over two-thirds of adolescents consumed fast foods and sweetened beverages three or more times/week, with median intakes reaching 11 fast-food items per week in both sexes and 8 and 10 sweetened beverages per week in males and females respectively at 17 years.Citation57,Citation61 Confectionery consumption was high across the five-year follow-up (9–10 items/week) and reached 11 items per week in boys and 13 items per week in girls at 17 years.Citation46,Citation61 Approximately three times the American Heart Association (AHA) recommended daily intake of added sugar was consumed via purchased food items (males: 561.6 g/week vs. females: 485.3 g/week; p = 0.02).Citation61,Citation95 These items also contributed over half the AHA recommended daily intake of salt (males: 4 803 mg/week vs. females: 4 761 mg/week; p > 0.05) in adolescents.Citation96 The ‘kota’ (quarter-loaf of white bread filled with chips, a slice of cheese and delicatessen meats and sauces) was the least expensive and most regularly purchased fast food item at 17 years.Citation37 This item alone provided over half the estimated daily energy requirement (ER) containing, on average, 5 970 kJ of energy and 51 g of fat.Citation37,Citation97
Compared with urban adolescents, rural girls and boys demonstrated significantly lower snack consumption while watching TV during early adolescence (EA; 11–13 years) and significantly lower fast food consumption during mid-adolescence (MA; 14–15 years).Citation87 Significantly more rural girls (EA: 51.02%; MA: 48.51%) than boys (EA: 33.33%; MA: 28.57%) consumed their main meal with the family almost every day.Citation87
Consumption of a dietary pattern driven by animal-derived nutrients was higher in rural girls vs. boys and in adolescents with higher SES (based on a Wealth Index) (P < 0.05).Citation73 Some 87.6% of girls and 89.8% of boys had low food variety scores (FVS; < 30 food items consumed per week) and 12.4% of girls and 10.2% of boys had medium FVS (30–60 food items per week).Citation76 FVSs were highest for those with high scores on the nutrition knowledge questionnaire (NKQ).Citation76 Additionally, NKQ scores were inversely associated with carbohydrate, total fat and added sugar intakes and positively associated with protein intake.Citation76
Associations between diet and lifestyle factors and adolescent adiposity ()
Thirteen studies met the inclusion criteria.Citation24,Citation31,Citation32,Citation44,Citation49,Citation57,Citation62,Citation63,Citation71,Citation73,Citation77,Citation82,Citation87 Exposure variables were largely questionnaire based and included assessment of demographics, SES and household food security,Citation44,Citation71,Citation77 dietary intake (FFQ),Citation31,Citation73 dietary habits and eating practices,Citation57,Citation87 physical activity and sedentary behaviour,Citation31 as well as body-image perceptions, satisfaction and dissatisfaction and eating attitudes.Citation24,Citation31,Citation32,Citation62,Citation63,Citation82 Only one study used anthropometry (birth to two years of age) as the exposure.Citation49 Anthropometry was used to assess adolescent adiposity in all studies and measurements included weight, height and BMI. Additionally, two studies included DXA assessed fat mass.Citation49,Citation57
Table 6: Results from quantitative studies of the associations between diet and lifestyle factors and adolescent adiposity in South Africa
Underweight and severe stunting prevalence rates were significantly higher in urban boys vs. girls across adolescence (13–19 years of age). Overweight/obesity prevalence was significantly higher in girls from both rural and urban settings (11–19 years).Citation71,Citation77,Citation82,Citation87 A 1 SD increase in birthweight was associated with 0.22 higher BMI z-score and 1 051 g higher fat-free mass at 10 years of age (p ≤ 0.01).Citation49 Additionally, underweight at one year was associated with lower fat-free mass, and stunting at one and two years was associated with lower fat-free and fat mass at 10 years of age (p ≤ 0.01). A 1 SD increase in weight-for-age z-score (WAZ) between birth and two years of age was associated with adolescent adiposity (BMI and fat mass; p ≤ 0.01).Citation49
Urban black girls had higher BMIs than both their white and mixed ancestry counterparts (black: 24.1 ± 3.3, mixed ancestry: 22.1 ± 3.7, white 21.9 ± 3.0 kg/m2; p < 0.05) between 15 and 18 years of age.Citation24 White girls were significantly taller (p < 0.001), had higher hip circumferences (p < 0.05) and participated in more formal, but less informal, physical activity (p < 0.05), than black girls.Citation31 In black girls only, sedentary time was positively associated with energy intake (p < 0.01) but not with body size.Citation31 Animal-driven nutrient pattern adherence was positively associated with adolescent BMI z-score in 11–15-year-olds (0.13 per + 1 SD; p = 0.02) and longitudinal sweetened beverage consumption was positively associated with BMI z-score and fat mass in boys at 17 years (p < 0.05).Citation57,Citation73 For urban and rural adolescents, higher odds of overweight and obesity was associated with consumption of fewer family-based meals (i.e. eating the main meal with the family on some days or almost all days) and irregular breakfast consumption on weekdays.Citation87
Stunting prevalence (13–15 years) was lowest in adolescents with a high household SES (high SES: 18.1%; medium SES: 30.4%; low SES: 31.4%; tertiles based on occupation and highest education level of the household’s ‘breadwinner’).Citation71 Rural dwelling was associated with lower odds of overweight and obesity; however, this was seen only during early adolescence (11–13 years) (OR: 0.55 [0.32, 0.92]; p ≤ 0.02).Citation87 Odds of a high body fat percentage (%fat; > 85th percentile) at 17–19 years was higher in females who lived in neighbourhoods with a low social support index (OR: 1.59; 95% CI: 1.03, 2.44), as well as in males with higher household wealth index (OR: 0.28; 95% CI: 0.10, 0.78).Citation77
There was an inverse association between body image dissatisfaction and BMI in girls (p= 0.0001); however, overweight girls had a higher tendency towards a disordered body image than their normal-weight counterparts.Citation24,Citation63 Across rural and urban settings, BMI was lowest in those who desired to be larger and highest in those desiring to be thinner (13–18 years).Citation32 A higher overall 26-item Eating Attitudes Test (EAT-26) score in girls (representing a greater tendency towards developing an eating disorder) was positively associated with BMI (white girls: p = 0.0001; black girls: p = 0.038)Citation63 and a higher dieting sub-score was positively associated with weight, BMI and hip circumference in black girls specifically (p < 0.01).Citation31 Underweight girls had significantly lower EAT-26 scores than the other BMI groups.Citation24 For white boys, self-esteem was positively associated and dieting was inversely associated with BMI (p = 0.01 and p = 0.004 respectively), while in black boys lower bulimic and oral control scores were associated with higher BMIs.Citation62
Body image perceptions and eating attitudes ()
Twelve studies met the inclusion criteria.Citation22,Citation24,Citation26,Citation31,Citation32,Citation55,Citation58,Citation62,Citation63,Citation69,Citation70,Citation82 Data collection was questionnaire based and focused on the following: eating attitudes (26-item Eating Attitudes Test; EAT-26),Citation22,Citation24,Citation26,Citation31,Citation58,Citation62,Citation63,Citation69,Citation82 self-esteem (Rosenberg self-esteem questionnaire),Citation58,Citation62,Citation63 body figure perceptions, preferences and ideals,Citation24,Citation32,Citation55,Citation70 body image satisfaction (Stunkard’s silhouettes) and dissatisfaction (Feel-Ideal Discrepancy (FID) scores),Citation62,Citation63 weight-control behavioursCitation58,Citation69 and perceptions of female body silhouettes.Citation58,Citation62,Citation63,Citation82
Table 7: Results from quantitative studies describing body image perceptions and attitudes in South African adolescents
National data showed that 84.5% of adolescents (15–18 years) had distorted body images (i.e. they either under- or overestimated their current body size) and 45.3% were dissatisfied with their body size.Citation70 Overweight and obese adolescents tended to underestimate their body size and desired to be thinner, while normal and underweight adolescents overestimated their body size and desired to be fatter.Citation55,Citation70
Some 16.7% and 38.8% of urban white and black girls respectively had high body image dissatisfaction, with significantly more black vs. white girls being dissatisfied with their body image at 13 (p = 0.04), 15 (p = 0.001) and 17 (p = 0.0001) years.Citation63 In addition, significantly more black girls were at risk of developing an eating disorder (EAT-26 scores ≥ 20) than their white counterparts, with higher reported scores on the bulimia and/or oral control subscales.Citation22,Citation26,Citation63 In contrast, white girls idealised a smaller body size than their mixed-race or black counterparts.Citation24 Low self-esteem and a desire to be thinner was more common in white compared with black girls.Citation32,Citation63
For rural girls, the desire to be thinner was higher in early puberty (Tanner stage ≤ 2) compared with mid- to post-puberty (Tanner stage > 2) (61.4% vs. 55.9%), while the desire to be fatter was lower in early vs. mid- to post-puberty (18.6% vs. 29.7%).Citation82 The majority of males and females in both pubertal groups perceived the underweight silhouettes to be ‘unhappy’ and ‘weak’. In addition, the majority of females (early and mid–post-puberty) perceived the normal silhouette to be the ‘best’. There were no differences in the risk of developing an eating disorder by sex or age; 10.5% and 10.6% of boys and girls respectively had an EAT-26 score ≥ 20 in early puberty, while in mid-puberty 7.1% of boys and 8.0% of girls scored ≥ 20.
For boys at 13, 15 and 17 years of age, body image dissatisfaction and risk of a disordered eating attitude were higher in black vs. white adolescents (dissatisfaction: 37.4% [black] vs. 33.5% [white]; EAT-26 scores ≥ 20: 40.3% [black] vs. 5.2% [white]; p < 0.001).Citation62 The prevalence of low self-esteem was higher in black boys (46.4% [black] vs. 21.4% [white]; p < 0.001), as well as at younger ages (13 years: 43%; 15 years: 35%; 17 years: 23%). The prevalence of low body esteem in mixed-ancestry adolescents increased from 0% at 13 years to 11% and 12.3% in boys and girls respectively by the age of 17.Citation58
Significantly more urban black vs. white adolescents (13, 15 and 17 years) perceived higher BMIs to be the ‘best’, the ‘happiest’ and to have ‘more respect’.Citation62,Citation63 However, in the BTT cohort at 17 years of age, both black and mixed-ancestry adolescents assigned these attributes to a normal weight silhouette.Citation58 Black and mixed-ancestry adolescents perceived the obese silhouette to be the ‘worst’ and to be ‘unhappy’ at 17 years of age.Citation58 However in 13-, 15- and 17-year-old black and white boys, this silhouette also symbolised ‘strength’.Citation62 The underweight silhouette was perceived as the ‘weakest’ by black boys and girls and as getting the ‘least respect’ by black boys only.Citation58,Citation62
Qualitative research: perceptions of, and attitudes towards, dietary and lifestyle behaviours ()
Four qualitative studies met the inclusion criteria, all of which were conducted in girls.Citation51,Citation52,Citation68,Citation83 Data were collected using semi-structured ‘duo-interviews’ (friend pairs) in three studiesCitation51,Citation52,Citation68 and individual in-depth interviews in one study.Citation83
Table 8: Results from qualitative studies describing adolescents: perceptions of, and attitudes towards, dietary and lifestyle behaviours in South Africa
Breakfast consumption in the home was not prioritised and lunchboxes were not commonly used by urban girls.Citation52 Instead, girls preferred to purchase locally prepared convenience foods—commonly ‘kotas’, ‘fat cakes’ (deep-fried dough balls) and other snack foods—from vendors and the school tuck shop.Citation52 Food choices were driven by affordability, convenience and peer influence, as well as popularity of the food items.Citation51
In rural girls the importance of eating breakfast was acknowledged and locally grown, traditional foods—mainly fruits and vegetables—were perceived to be healthy.Citation68 Female caregivers and school meal programmes were viewed as facilitators to eating healthy diets.Citation68 Limited household food availability and accessibility to healthy foods acted as barriers to regular breakfast consumption, as well as drivers of ‘convenient and less healthy food’ consumption.
Active recreational activity was minimal in urban girls, largely due to a lack of facilities and safety concerns.Citation52 Physical activity was more common in rural girls, with various activities—including household chores, walking to school, traditional dancing and extramural activities (e.g. netball, soccer)—reported.Citation68 Many rural girls believed that engaging in these activities was beneficial to their health.
For girls in Limpopo, body dissatisfaction was common, with many desiring to be thinner than they were.Citation83 A variety of factors influenced girls to control their weight, including individual-level body-image dissatisfaction, parental criticism of body size and endorsement of dieting behaviour by peer groups.
Discussion
Using a systematic approach, this review aimed to report on the available data on nutritional status and dietary intake and practices, as well as their determinants, in South African adolescents (10–20 years).
Adolescent nutritional status
Anthropometry and body composition
Using BMI, national data showed an overall increase in overweight and obesity prevalence in South African adolescents over time (2002–2008), with approximately 14% of boys and 36.5% of girls between 13 and 18 years of age being overweight or obese in 2008.Citation38,Citation39 However, this is coupled with persistently high stunting prevalence, affecting as many as a third of 13–15-year-old boys and girls in the urban Free State.Citation71 Dual burdens of under- and overnutrition are widely documented in LMICs and have been linked to rapid urbanisation and a transition towards diets high in saturated fat, sugar, salt and processed foods and low in essential micronutrients, as well as decreased levels of physical activity.Citation4,Citation15,Citation16 In South Africa the coexistence of unyielding chronic undernutrition and increasingly prevalent obesity is well established and documented across the life course even at individual household levels, making tackling malnutrition in this context highly complex.Citation45,Citation98
Sex differences in under- and overnutrition were evident across studies, with the majority showing higher overweight and obesity prevalence—as well as central adiposity (waist circumference), sum of skinfolds and %fat—in girls and higher stunting prevalence in boys. While the differences between girls and boys were shown across age categories, they became more pronounced as adolescents aged, with girls experiencing substantial increases in adiposity from mid- to late adolescence. The disproportionate burden of obesity in adult females is well documented in South Africa—as well as across most LMICs.Citation18,Citation99 These data suggest that adolescence may be a critical period of divergence in risk profiles between sexes, triggering high levels of fat deposition in girls from around the onset of puberty.
Across South Africa, urban adolescents tended to exhibit higher overweight and obesity prevalence than those from rural settings. Such urban–rural differences have been identified across LMICs and are supported by diet and activity changes, which result as food environments and access, infrastructure, occupation and transport become increasingly urbanised.Citation99 However, as the degree of urbanisation becomes more extensive and rural communities are increasingly exposed to obesogenic environments and behaviours, this gap in nutritional profiles is rapidly reduced, with one study documenting higher mean BMI in rural compared with urban black girls from Gauteng province.Citation32 Studies from other LMICs have suggested that, in such cases, the rate of increase in overweight and obesity may be even higher in some rural compared with urban communities.Citation99
Biochemical markers
Only one article was retrieved that described nutritional status using any biochemical marker, highlighting the scarcity of data on adolescent micronutrient status in South Africa. Although this study showed low levels of vitamin D deficiency in both white and black urban adolescents—and adequate vitamin D status has been linked to a range of positive adolescent health outcomes—the levels required for optimal health are widely debated.Citation48,Citation100 In addition, status of any single micronutrient in isolation is not reflective of highly interactive multi-nutrient profiles or dietary micronutrient adequacy, particularly for vitamin D, since diet is not typically the primary source.Citation73,Citation100 This phenomenon is common across African populations, with available data being largely limited to single micronutrients or deficiencies and their associations with particular outcomes of interest in isolated target groups.Citation101 While such studies are useful, they do not take into account the complex nature of micronutrient deficiencies, which tend to occur in combination, particularly in populations of low socioeconomic status with low dietary diversity. More evidence is needed to understand the profiles of multi-micronutrient status and deficiencies in adolescents, as well as the diet and lifestyle determinants and health consequences of these in both the short and longer term.
Reported dietary intake and eating habits
Overall, in both rural and urban settings, energy intakes between 10 and 15 years either met or fell below the ER.Citation97 In rural adolescents, there was no change in energy intake between younger (9–13 years) and older (14–18 years) age groups.Citation75 This was surprising given the increase in adiposity during the later adolescent period, particularly in girls. However, these data were collected in a single rural population where food insecurity is common and almost 90% of adolescents consume diets of low food variety (i.e. < 30 food items per week).Citation76 This suggests that the monotonous diets of low dietary diversity, typically associated with poverty, persist in more isolated rural South African settings and intakes may not be comparable to those of the increasingly urbanised communities.Citation102 This is supported by the dietary habits demonstrated in rural adolescents who maintained more traditional eating behaviours than their urban counterparts, being more likely to partake in family meals and to consume fewer fast-food and snack-food items.Citation87 In addition, during qualitative interviews, rural girls reported household food availability to be a key driver of healthy eating behaviours such as regular breakfast consumption.Citation68
In urban adolescents, energy intake increased with age, predominantly driven by increased intakes of carbohydrate, fat and sugar.Citation35 This was reflected in the types of food consumed, with lower fruit, vegetable and dairy intakes and higher processed meat, oil, fast-food and sugar-sweetened beverage intakes reported at older ages. In addition to changes in patterns of food consumption, older adolescents were less likely to eat breakfast and carry a lunchbox to school and were more likely to purchase food at school and to snack while watching TV. Such dietary behaviours were associated with lower dietary diversity and meal frequency and higher adiposity, as well as increased consumption of convenience food products.Citation43 These purchased items contributed substantially to the total added sugar and salt intakes of adolescents.Citation61 This is supported by studies in both high-income and LMIC settings, which demonstrates the adoption of obesogenic behaviours as adolescents age and gain independence.Citation10,Citation12,Citation103
Poor dietary habits were reflected in the micronutrient intakes of adolescents, which were low across studies in both rural and urban settings. Whether using RDAs or dietary reference intakes (DRI; Institute of Medicine and National Research CouncilCitation104,Citation105), the majority of adolescents did not meet the recommendations for most micronutrients, including iron, zinc, calcium, vitamin A and folate,Citation23,Citation35,Citation75,Citation76 with one study showing an increase in the proportion not meeting recommendations as adolescents aged.Citation35 It must be noted that the studies by Faber et al. and MacKeown et al. were conducted prior to the introduction of micronutrient fortification in 2003 and therefore whether improvements in intakes have occurred is not clear.Citation23,Citation35 However, the persistently low micronutrient intakes documented in later studies suggest that potential benefits of food fortification may be insufficient to allow for substantial changes in the proportion of adolescents meeting recommendations.Citation75,Citation76 In addition, poor micronutrient intakes are documented across South African populations and have been, in part, linked to food insecurity and low accessibility to more expensive high- protein and micronutrient-rich foods.Citation106 This is supported by Manyanga et al., who showed higher odds of an unhealthy dietary pattern in adolescents from the lowest SES group.Citation84 In addition, those with low SES demonstrated lower knowledge around healthy foods, with higher knowledge being associated with increased food variety, as well as lower carbohydrate, fat and added sugar and higher protein intakes. However, South African adolescents demonstrated poor knowledge of unhealthy foods overall, being unable to classify high fat and sugar products such as pies, samosas and sugar-sweetened beverages as unhealthy items. Sugar-sweetened beverage consumption has been identified as one of the key drivers of obesity and was positively associated with adiposity in urban South Africa boys at 17 years. This suggests that interventions aimed at improving education around diet and health may be beneficial in shaping healthier food choices and improving dietary diversity in adolescents. However, this would require multi-sector involvement in prioritising nutrition and health within the education system—potentially at school level—as well as ensuring adequate access to healthy food at home, school and community levels. In addition, encouraging healthy-eating behaviours—such as eating breakfast, carrying lunch to school and eating meals as a family—may be beneficial in improving dietary intake and nutritional status in adolescents and their families.
Although the findings of this review support urbanisation-associated changes in the diets of South African adolescents, which become more pronounced with age, data fail to explain the substantial increases in adolescent adiposity, particularly in girls. While some differences in eating behaviour were identified between boys and girls—with girls consuming more snack and confectionery items than boys—energy, macro- and micronutrient intakes were largely similar. Understanding the interplay between diet and physical activity in adolescents as they age may therefore be an important component in explaining these differences. While studies exploring activity and sedentary behaviour patterns in South African adolescents are limited, available data suggest low activity levels in girls, particularly in urban settings and at older ages.Citation107,Citation108 This is supported by data from high-income countries (HICs), which show that older, female adolescents demonstrate clusters of behaviour defined by low levels of physical activity.Citation12 In addition, data suggest differences in the types of sedentary behaviour adopted by girls and boys, as well as high clustering of unhealthy activity and dietary behaviours.Citation12 These may be important factors in targeting future interventions. Future studies should therefore investigate the clustering of diet, physical activity and sedentary behaviour in South African boys and girls, as well as what may be driving distinct clusters of both healthy and unhealthy behaviour between sexes.
Body-image perceptions and eating attitudes
This review found that, in general, white girls desire to be thinner more commonly than their black or mixed-ancestry counterparts and tend to prefer a smaller body size, with rural black girls having the lowest desire to be thinner. This is supported by the fact that black adolescents believed higher BMIs to be the ‘best’, the ‘happiest’ and to receive the ‘most respect’, while underweight silhouettes were perceived as the ‘weakest’. Similar findings have been documented between black and white girls in HICs, with black girls desiring to be thinner at comparatively higher BMIs.Citation109,Citation110 Ethnic differences around desirable body size are maintained in adulthood and have been associated with cultural ideals, as well as stigmatisation of thinness in African settings.Citation111,Citation112
However, despite a preference towards a higher body size, black South African adolescents had more disordered eating attitudes than their white counterparts, with higher scores for oral control documented across studies. A previous study comparing urban and rural black South Africa women suggested that the EAT-26 may have poor applicability to rural settings, due to misinterpretation of the questionnaire in a food-insecure context.Citation113 This may similarly explain the differences exhibited between black and white adolescents in our review, with disordered eating attitudes reflecting restrictive eating behaviours due to limited food resources, rather than as methods of weight control.
Although cultural perceptions around ideal body size persist in South Africa, there is evidence of a shift in these social norms, with the majority of adolescents perceiving a normal-weight female silhouette to be the ‘best’. In addition, older urban adolescents perceived an obese silhouette as the ‘worst’ and as ‘unhappy’.Citation58 Such changes in desirability have been largely linked to urbanisation and increased exposure to, and adoption of, Western ideals.Citation114 This suggests a possible avenue for intervention in South African adolescents who already exhibit desire towards normal bodyweights—alongside potential declines in the influence of traditional barriers to change.Citation113 However, caution must be taken in promoting a healthy bodyweight while preventing development of more disordered attitudes to eating and weight loss during the vulnerable adolescent period. Research suggests that promotion of physical activity may be a critical component in such interventions, with exercise being associated with improved body-image perceptions, alongside the beneficial effects on adiposity.Citation113,Citation115
Taking into account the perceptions towards activity, as well as the facilitators and barriers, is important,; particularly between rural and urban contexts. Qualitative studies identified in this review showed that, while adolescent girls were aware of the health benefits associated with being active, physical activity was more common in those from rural settings. In urban settings, limited availability of facilities and concerns around safety were reported as key barriers to active recreation. Multi-sectoral approaches that address individual, household, school and community level factors and both encourage, and allow, adolescents to safely partake in physical activity are therefore needed.
Community engagement for intervention development
As previously mentioned, research that explores current diet and activity patterns in South African adolescents, as well as the drivers of these, is critical in developing interventions to promote healthy growth in boys and girls. However, development of targeted and effective interventions will only be successful if adolescents themselves are involved in this process. Studies show that involving teenagers in intervention design has a significant impact on its outcomes, facilitating ownership of, and accountability to, the intervention itself.Citation116 In addition, community engagement facilitates mutual benefit to both the researchers and the community members themselves, helping to identify those interventions for which the priorities of various community members—i.e. adolescents, parents and teachers—overlap.Citation116,Citation117
Limitations
This review provides a comprehensive overview of available literature describing adolescent nutritional status in South Africa, with the inclusion of both quantitative and qualitative data adding a multifaceted understanding to potential determinants. While review findings have, to an extent, been supported by literature from other settings, the strength of and comparability between included studies is limited. Across review objectives substantial differences in study design were identified, with the majority of studies using cross-sectional designs and various exposure and outcome variables measured by multiple techniques at a range of adolescent ages. For example, where SES was described, this was defined by a number of methods, including wealth indices, household income and highest level of education achieved. However, while comparison may be restricted between studies, all have been extensively utilised as proxies for SES at household level and provide useful information on associations between SES and adolescent nutritional status across studies in a South African context. In addition, sample sizes differed substantially between studies and were relatively low in prospective cohort designs. This not only made drawing conclusions across studies difficult but limited the ability to make within-study comparisons—for example in cases where sex- and age-stratified results were not provided, potentially leading to bias in the presented study estimates. Similarly, the lack of comparative data—and longitudinal data in particular—makes it difficult to examine trends in South Africa across the study period. In addition, studies used various international standards and guidelines to both define and assess adequacy of nutritional status, with the standards or guidelines used often dependent on the timing of the study within the review period (for example pre- or post-introduction of the WHO growth standards in 2007 or the DRIs in 2001). Whether these international standards are applicable to African populations is debated and may explain why an unexpected decrease in overweight/obesity prevalence was observed in boys between early and mid-adolescence. Data have shown a delay in the onset of puberty, and therefore skeletal maturity, in black South African boys, which may lead to a degree of misclassification in both stunting and overweight/obesity prevalence in younger boys when compared with international standards.Citation118 However, while use of different guidelines may make direct comparison between studies challenging, these studies still provide useful data describing nutrient adequacy over time. In addition, studies have shown a high degree of comparability between standards of weight classification (i.e. CDC/NCHS, IOTF and WHO growth standards) in adolescents, as well as in their associations with health outcomes, suggesting that the degree of misclassification between studies would be small overall.Citation119 For those studies reporting dietary intakes, all used either 24-hour recall or FFQ methodologies. While these are the most commonly utilised methods in African settings, innate limitations of using reported intakes exist, with strengths and weaknesses between specific methods being commonly acknowledged.Citation120 Recall bias, assumptions around regularity of eating habits, seasonality and inaccuracy in portion size estimation are all limitations of these methodologies and must be considered when interpreting the review findings.Citation121,Citation122
Conclusion
In South Africa, rapid urbanisation over the last two decades has resulted in a substantial rise in adolescent overweight and obesity, with urban females being most affected as they age. Rising adiposity in adolescents is driven by a transition towards increasingly Westernised diets characterised by high intakes of energy-dense, processed and convenience food products high in sugar and fat, but low in essential micronutrients. In addition, the changes in dietary intake demonstrated across South African populations are exacerbated in adolescents as they age and adopt more obesogenic behaviours, including irregular breakfast consumption and fewer family meals, increased snacking and consumption of purchased/fast-food products and reduced levels of physical activity. However, this review highlights a scarcity of data for the implications of these shifting dietary-intake and behaviour patterns on the micronutrient status of adolescents, which may have severe implications for their ability to grow into healthy and productive adults. In addition, little is known about the way in which diet, activity and sedentary behaviours cluster in adolescent boys and girls, as well as the patterns of behaviour that may facilitate healthy growth and reduced adiposity between the sexes.
Authorship
SVW: conceptualisation and methodology, literature search, data extraction and presentation, interpretation of results, writing—original draft, writing—review and editing; TMP: literature search, data extraction and presentation, writing—review and editing; CHF: conceptualisation and methodology, writing—review and editing; SAN: conceptualisation and methodology, interpretation of results, writing—review and editing. All authors gave final approval for the manuscript to be submitted.
Disclosure statement
No potential conflict of interest was reported by the authors.
Additional information
Funding
References
- Patton GC, Sawyer SM, Santelli JS, et al. Our future: a Lancet commission on adolescent health and wellbeing. The Lancet. 2016 Jun 11;387(10036):2423–78.
- Patton GC, Olsson CA, Skirbekk V, et al. Adolescence and the next generation. Nature. 2018 Feb;554(7693):458–66.
- Sawyer SM, Afifi RA, Bearinger LH, et al. Adolescence: a foundation for future health. The Lancet. 2012 Apr 28;379(9826):1630–40.
- Black RE, Victora CG, Walker SP, et al. Maternal and child undernutrition and overweight in low-income and middle-income countries. The Lancet. 2013 Aug;382(9890):427–51.
- The International Weight Management in Pregnancy (i-WIP) Collaborative Group. Effect of diet and physical activity based interventions in pregnancy on gestational weight gain and pregnancy outcomes: meta-analysis of individual participant data from randomised trials. Br Med J. 2017 Jul 19;358:j3119.
- Shepherd E, Gomersall JC, Tieu J, et al. Combined diet and exercise interventions for preventing gestational diabetes mellitus. Cochrane Database Syst Rev. 2017;13(11):CD010443.
- Bain E, Crane M, Tieu J, et al. Diet and exercise interventions for preventing gestational diabetes mellitus. Cochrane Database Syst Rev. 2015 Apr 12;4:CD010443.
- Soubry A. Epigenetic inheritance and evolution: a paternal perspective on dietary influences. Prog Biophys Mol Biol. 2015 Jul 1;118(1):79–85.
- Braun K, Champagne FA. Paternal influences on offspring development: behavioural and epigenetic pathways. J Neuroendocrinol. 2014 Oct;26(10):697–706.
- Viner RM, Ozer EM, Denny S, et al. Adolescence and the social determinants of health. The Lancet. 2012 Apr 28;379(9826):1641–52.
- United Nations Population Fund. World population dashboard [Internet]. (2017). [cited 2018 Mar 14]. Available from: https://www.unfpa.org/data/world-population-dashboard.
- Leech RM, McNaughton SA, Timperio A. The clustering of diet, physical activity and sedentary behavior in children and adolescents: a review. Int J Behav Nutr Phys Act. 2014 Jan 22;11(4):1–9.
- St-Onge M-P, Keller KL, Heymsfield SB. Changes in childhood food consumption patterns: a cause for concern in light of increasing body weights. Am J Clin Nutr. 2003 Dec;78(6):1068–73.
- Popkin BM. Global nutrition dynamics: the world is shifting rapidly toward a diet linked with noncommunicable diseases. Am J Clin Nutr. 2006 Aug 1;84(2):289–98.
- Popkin BM, Adair LS, Ng SW. Global nutrition transition and the pandemic of obesity in developing countries. Nutr Rev. 2012 Jan;70(1):3–21.
- Kac G, Pérez-Escamilla R. Nutrition transition and obesity prevention through the life-course. Int J Obes Suppl. 2013 Jun;3(S1):S6–S8.
- Patton GC, Coffey C, Cappa C, et al. Health of the world—s adolescents: a synthesis of internationally comparable data. The Lancet. 2012 Apr 28;379(9826):1665–75.
- National Department of Health (NDoH), Statistics South Africa (Stats SA), South African Medical Research Council (SAMRC), ICF. South Africa Demographic and Health Survey 2016: key indicators [Internet]. Pretoria, South Africa, and Rockville, Maryland, USA: NDoH, Stats SA, SAMRC, and ICF; 2017 [cited 2017 Jul 24]. Available from: http://dhsprogram.com/pubs/pdf/PR84/PR84.pdf.
- Labadarios D, Mchiza ZJ-R, Steyn NP, et al. Food security in South Africa: a review of national surveys. Bull World Health Organ. 2011 Dec;89:891–9.
- Koch J. The food security policy context in South Africa [Internet]. Brazil: International Policy Centre for Inclusive Growth (IPC-IG); 2011 [cited 2018 Mar 19]. Report No.: 21. Available from: https://www.econstor.eu/bitstream/10419/71767/1/657098043.pdf.
- Sanders D, Chopra M. Key challenges to achieving health for all in an inequitable society: the case of South Africa. Am J Public Health. 2006 Jan 1;96(1):73–8.
- Szabo CP, Hollands C. Abnormal eating attitudes in secondary-school girls in South Africa-a preliminary study. South Afr Med J Suid-Afr Tydskr Vir Geneeskd. 1997 Apr;87(4 Suppl):524–6. 528–30.
- Faber M, Smuts CM, Benadé AJ. Dietary intake of primary school children in relation to food production in a rural area in KwaZulu-Natal, South Africa. Int J Food Sci Nutr. 1999 Jan;50(1):57–64.
- Caradas AA, Lambert EV, Charlton KE. An ethnic comparison of eating attitudes and associated body image concerns in adolescent South African schoolgirls. J Hum Nutr Diet Off J Br Diet Assoc. 2001 Apr;14(2):111–20.
- Kruger HS, Margetts BM, Vorster HH. Evidence for relatively greater subcutaneous fat deposition in stunted girls in the North West Province, South Africa, as compared with non-stunted girls. Nutr Burbank Los Angel Cty Calif. 2004 Jun;20(6):564–9.
- Szabo CP, Allwood CW. A cross-cultural study of eating attitudes in adolescent South African females. World Psychiatry. 2004 Feb;3(1):41–4.
- van Rooyen JM, Kruger HS, Huisman HW, et al. Early cardiovascular changes in 10- to 15-year-old stunted children: the Transition and Health during urbanization in South Africa in Children study. Nutr Burbank Los Angel Cty Calif. 2005 Aug;21(7–8):808–14.
- Monyeki MA, Koppes LLJ, Kemper HCG, et al. Body composition and physical fitness of undernourished South African rural primary school children. Eur J Clin Nutr. 2005 Jul;59(7):877–83.
- Monyeki KD, Kemper HCG, Makgae PJ. The association of fat patterning with blood pressure in rural South African children: the Ellisras Longitudinal Growth and Health Study. Int J Epidemiol. 2006 Feb;35(1):114–20.
- Kruger R, Kruger HS, Macintyre UE. The determinants of overweight and obesity among 10- to 15-year-old schoolchildren in the North West Province, South Africa - the THUSA BANA (Transition and Health during Urbanisation of South Africans; BANA, children) study. Public Health Nutr. 2006 May;9(3):351–8.
- Petersen CD, Norris SA, Pettifor JM, et al. Eating attitudes in a group of 11-year-old urban South African girls. South Afr J Clin Nutr. 2006;19(2):80–5.
- Szabo CP, Allwood CW. Body figure preference in South African adolescent females: a cross cultural study. Afr Health Sci. 2006 Dec;6(4):201–6.
- Temple NJ, Steyn NP, Myburgh NG, et al. Food items consumed by students attending schools in different socioeconomic areas in Cape Town, South Africa. Nutr Burbank Los Angel Cty Calif. 2006 Mar;22(3):252–8.
- Jinabhai CC, Reddy P, Taylor M, et al. Sex differences in under and over nutrition among school-going Black teenagers in South Africa: an uneven nutrition trajectory. Trop Med Int Health. 2007 Aug;12(8):944–52.
- MacKeown JM, Pedro TM, Norris SA. Energy, macro- and micronutrient intake among a true longitudinal group of South African adolescents at two interceptions (2000 and 2003): the Birth-to-Twenty (Bt20) Study. Public Health Nutr. 2007 Jun;10(6):635–43.
- Pedro TM, MacKeown JM, Norris SA. Variety and total number of food items recorded by a true longitudinal group of urban black South African children at five interceptions between 1995 and 2003: the Birth-to-Twenty (Bt20) Study. Public Health Nutr. 2008 Jun;11(6):616–23.
- Feeley AB, Pettifor JM, Norris SA. Fast-food consumption among 17-year-olds in the birth to Twenty cohort. South Afr J Clin Nutr. 2009 Jul 18;22(3):118–23.
- Reddy SP, Resnicow K, James S, et al. Underweight, overweight and obesity among South African adolescents: results of the 2002 National Youth Risk Behaviour Survey. Public Health Nutr. 2009 Feb;12(2):203–7.
- Reddy SP, Resnicow K, James S, et al. Rapid increases in overweight and obesity among South African adolescents: comparison of data from the South African National Youth Risk Behaviour Survey in 2002 and 2008. Am J Public Health. 2012 Feb;102(2):262–8.
- Letlape SV, Mokwena K, Oguntibeju OO. Knowledge of students attending a high school in Pretoria, South Africa, on diet, nutrition and exercise. West Indian Med J. 2010 Dec;59(6):633–40.
- Venter I, Winterbach A. Dietary fat knowledge and intake of mid-adolescents attending public schools in the Bellville/durbanville area of the city of Cape Town. South Afr J Clin Nutr. 2010 Jul 2;23(2):75–83.
- Zeelie A, Moss SJ, Kruger HS. The relationship between body composition and selected metabolic syndrome markers in black adolescents in South Africa: the PLAY study. Nutr Burbank Los Angel Cty Calif. 2010 Dec;26(11–12):1059–64.
- Abrahams Z, de Villiers A, Steyn NP, et al. What—s in the lunchbox? Dietary behaviour of learners from disadvantaged schools in the Western Cape, South Africa. Public Health Nutr. 2011 Oct;14(10):1752–8.
- Kimani-Murage EW, Kahn K, Pettifor JM, et al. Predictors of adolescent weight status and central obesity in rural South Africa. Public Health Nutr. 2011 Jun;14(6):1114–22.
- Kimani-Murage EW. Exploring the paradox: double burden of malnutrition in rural South Africa. Glob Health Action. 2013 Jan 24;6:19249.
- Feeley A, Musenge E, Pettifor JM, et al. Changes in dietary habits and eating practices in adolescents living in urban South Africa: the birth to twenty cohort. Nutr Burbank Los Angel Cty Calif. 2012 Jul;28(7–8):e1–e6.
- Monyeki MA, Neetens R, Moss SJ, et al. The relationship between body composition and physical fitness in 14 year old adolescents residing within the Tlokwe local municipality, South Africa: the PAHL study. BMC Public Health. 2012 May 24;12:374.
- Poopedi MA, Norris SA, Pettifor JM. Factors influencing the vitamin D status of 10-year-old urban South African children. Public Health Nutr. 2011 Feb;14(2):334–9.
- Kagura J, Feeley ABB, Micklesfield LK, et al. Association between infant nutrition and anthropometry, and pre-pubertal body composition in urban South African children. J Dev Orig Health Dis. 2012 Dec;3(6):415–23.
- Chirwa ED, Griffiths P, Maleta K, et al. Postnatal growth velocity and overweight in early adolescents: a comparison of rural and urban African boys and girls. Am J Hum Biol. 2014 Oct;26(5):643–51.
- Voorend CGN, Norris SA, Griffiths PL, et al. ‘We eat together; today she buys, tomorrow I will buy the food’: adolescent best friends— food choices and dietary practices in Soweto, South Africa. Public Health Nutr. 2013 Mar;16(3):559–67.
- Sedibe MH, Feeley AB, Voorend C, et al. Narratives of urban female adolescents in South Africa: dietary and physical activity practices in an obesogenic environment. South Afr J Clin Nutr. 2014 Feb 2;27(3):114–9.
- English RG, Perry M, Lee MM, et al. Farm residence and reproductive health among boys in rural South Africa. Environ Int. 2012 Oct 15;47:73–9.
- Mao J, Dalvie MA. Anthropometric measurements, serum reproductive hormonal levels and sexual development among boys in the rural Western Cape, South Africa. Int J Environ Res Public Health. 2016;13(12):1185.
- Puoane TR, Fourie JM, Tsolekile L, et al. What do black South African adolescent girls think about their body size? J Hunger Environ Nutr. 2013 Jan 1;8(1):85–94.
- Goon DT, Toriola AL, Shaw BS, et al. Body fat percentage of urban South African children: implications for health and fitness. West Indian Med J. 2013 Sep;62(7):582–8.
- Feeley AB, Musenge E, Pettifor JM, et al. Investigation into longitudinal dietary behaviours and household socio-economic indicators and their association with BMI Z-score and fat mass in South African adolescents: the Birth to Twenty (Bt20) cohort. Public Health Nutr. 2013 Apr;16(4):693–703.
- Gitau TM, Micklesfield LK, Pettifor JM, et al. Changes in eating attitudes, body esteem and weight control behaviours during adolescence in a South African cohort. PLoS ONE [Internet]. 2014 Oct 13 [cited 2017 Feb 17];9(10). Available from: http://www.ncbi.nlm.nih.gov/pmc/articles/PMC4195663/.
- Craig E, Reilly J, Bland R. Body fatness or anthropometry for assessment of unhealthy weight status? Comparison between methods in South African children and adolescents. Public Health Nutr. 2013 Nov;16(11):2005–13.
- Craig E, Reilly JJ, Bland R. Risk factors for overweight and overfatness in rural South African children and adolescents. J Public Health Oxf Engl. 2016 Mar;38(1):24–33.
- Feeley AB, Norris SA. Added sugar and dietary sodium intake from purchased fast food, confectionery, sweetened beverages and snacks among Sowetan adolescents. South Afr J Child Health. 2014 Aug 15;8(3):88–91.
- Gitau TM, Micklesfield LK, Pettifor JM, et al. Eating attitudes, body image satisfaction and self-esteem of South African Black and White male adolescents and their perception of female body silhouettes. J Child Adolesc Ment Health. 2014;26(3):193–205.
- Gitau TM, Micklesfield LK, Pettifor JM, et al. Ethnic differences in eating attitudes, body image and self-esteem among adolescent females living in urban South Africa. Afr J Psychiatry. 2014 Jan 1;17:468–474.
- Mamabolo RL, Sparks M, Moss SJ, et al. The association between dyslipidemia and anthropometric indicators in black and white adolescents residing in Tlokwe Municipality, North-West Province, South Africa: the PAHL study. Afr Health Sci. 2014 Dec;14(4):929–38.
- Mamabolo RL, Berti C, Monyeki MA, et al. Association between insulin-like growth factor-1, measures of overnutrition and undernutrition and insulin resistance in black adolescents living in the North-West Province, South Africa. Am J Hum Biol Off J Hum Biol Counc. 2014 Apr;26(2):189–97.
- Micklesfield LK, Pedro TM, Kahn K, et al. Physical activity and sedentary behavior among adolescents in rural South Africa: levels, patterns and correlates. BMC Public Health. 2014 Jan 16;14:40.
- Pedro TM, Kahn K, Pettifor JM, et al. Under- and overnutrition and evidence of metabolic disease risk in rural black South African children and adolescents. South Afr J Clin Nutr. 2014 Jul 5;27(4):194–200.
- Sedibe HM, Kahn K, Edin K, et al. Qualitative study exploring healthy eating practices and physical activity among adolescent girls in rural South Africa. BMC Pediatr. 2014 Aug 26;14:211.
- Visser J, Notelovitz T, Szabo CP, et al. Abnormal eating attitudes and weight-loss behaviour of adolescent girls attending a ‘traditional’ Jewish high school in Johannesburg, South Africa. South Afr J Clin Nutr. 2014 Jul 26;27(4):208–16.
- Mchiza ZJ, Parker W, Makoae M, et al. Body image and weight control in South Africans 15 years or older: SANHANES-1. BMC Public Health [Internet]. 2015 Sep 30;15. Available from: https://www.ncbi.nlm.nih.gov/pmc/articles/PMC4588465/.
- Meko LNM, Slabber-Stretch M, Walsh CM, et al. School environment, socioeconomic status and weight of children in Bloemfontein, South Africa. Afr J Prim Health Care Fam Med. 2015 Mar 31;7(1):751.
- Nkeh-Chungag BN, Sekokotla AM, Sewani-Rusike C, et al. Prevalence of hypertension and pre-hypertension in 13–17 year old adolescents living in Mthatha - South Africa: a cross-sectional study. Cent Eur J Public Health. 2015 Mar;23(1):59–64.
- Pisa PT, Pedro TM, Kahn K, et al. Nutrient patterns and their association with socio-demographic, lifestyle factors and obesity risk in rural South African adolescents. Nutrients. 2015 May 12;7(5):3464–82.
- Toriola OO, Monyeki MA, Toriola AL. Two-year longitudinal health-related fitness, anthropometry and body composition status amongst adolescents in Tlokwe Municipality: the PAHL Study. Afr J Prim Health Care Fam Med. 2015 Oct 30;7(1):896.
- Oldewage-Theron W, Kruger R. The association between diet quality and subclinical inflammation among children aged 6–18 years in the Eastern Cape, South Africa. Public Health Nutr. 2017 Jan;20(1):102–11.
- Oldewage-Theron W, Egal A, Moroka T. Nutrition knowledge and dietary intake of adolescents in Cofimvaba, Eastern Cape, South Africa. Ecol Food Nutr. 2015;54(2):138–56.
- Pradeilles R, Griffiths PL, Norris SA, et al. Socio-economic influences on anthropometric status in urban South African adolescents: sex differences in the birth to Twenty Plus cohort. Public Health Nutr. 2015 Nov;18(16):2998–3012.
- Prioreschi A, Munthali RJ, Kagura J, et al. The associations between adult body composition and abdominal adiposity outcomes, and relative weight gain and linear growth from birth to age 22 in the Birth to Twenty Plus cohort, South Africa. PloS One. 2018;13(1):e0190483.
- Kagura J, Adair LS, Pisa PT, et al. Association of socioeconomic status change between infancy and adolescence, and blood pressure, in South African young adults: Birth to Twenty Cohort. BMJ Open. 2016 Mar 30;6(3):e008805.
- Lundeen EA, Norris SA, Adair LS, et al. Sex differences in obesity incidence: 20-year prospective cohort in South Africa. Pediatr Obes. 2016 Feb;11(1):75–80.
- Monyeki KD, Sekhotha MM. The relationships between height and arm span, mid-upper arm and waist circumferences and sum of four skinfolds in Ellisras rural children aged 8–18 years. Public Health Nutr. 2016 May;19(7):1195–9.
- Pedro TM, Micklesfield LK, Kahn K, et al. Body image satisfaction, eating attitudes and perceptions of female body silhouettes in rural South African adolescents. PLOS ONE. 2016 May 12;11(5):e0154784.
- Tshililo RA, Netshikweta LM, Tshitangano GT, et al. Factors influencing weight control practices amongst the adolescent girls in Vhembe District of Limpopo Province, South Africa. Afr J Prim Health Care Fam Med. 2016 May 31;8(2):e1–e4.
- Manyanga T, Tremblay MS, Chaput J-P, et al. Socioeconomic status and dietary patterns in children from around the world: different associations by levels of country human development? BMC Public Health. 2017;17(1):457.
- Moselakgomo KV, Van Staden M. Diagnostic comparison of Centers for Disease Control and Prevention and International Obesity Task Force criteria for obesity classification in South African children. Afr J Prim Health Care Fam Med. 2017 Aug 31;9(1):e1–e7.
- Pedro TM. The association of nutrition on body composition and metabolic disease risk in rural South African children and adolescents [PhD [dissertation]]. [Johannesburg, South Africa]: University of the Witwatersrand; 2017.
- Sedibe MH, Pisa PT, Feeley AB, et al. Dietary habits and eating practices and their association with overweight and obesity in rural and urban black South African adolescents. Nutrients. 2018 Jan 29;10(2):145.
- Tee L, Botha C, Laubscher R, et al. The intake and quality of breakfast consumption in adolescents attending public secondary schools in the North West province, South Africa. South Afr J Clin Nutr. 2015 Jan 1;28(2):81–8.
- WHO Multicentre Growth Reference Study Group. WHO Child Growth Standards: length/height-for-age, weight-for-age, weight-for-length, weight-for-height and body mass index-for-age: methods and development. Geneva: World Health Organisation; 2006.
- Kuczmarski R, Ogden C, Guo S. 2000 CDC growth charts for the United States: methods and development. Hyattsville (MD): Centers for Disease Control and Prevention, National Center for Health Statistics; 2002.
- Cole TJ, Bellizzi MC, Flegal KM, et al. Establishing a standard definition for child overweight and obesity worldwide: international survey. Br Med J. 2000 May 6;320(7244):1240.
- Boileau RA, Lohman TG, Slaughter MH. Exercise and body composition of children and youth. Scand J Sports Sci. 1985;7(1):17–27.
- Slaughter MH, Lohman TG, Boileau RA, et al. Skinfold equations for estimation of body fatness in children and youth. Hum Biol. 1988 Oct;60(5):709–23.
- Food Nutrition Board. Recommended dietary allowances: 10th Edition [Internet]. Washington, DC: National Academy Press; 1989 [cited 2018 Oct 25]. 302 p. Available from: https://www.nap.edu/read/1349/chapter/1.
- Johnson RK, Appel LJ, Brands M, et al. Dietary sugars intake and cardiovascular health: a scientific statement from the American Heart association. Circulation. 2009 Sep 15;120(11):1011–20.
- Appel LJ, Frohlich ED, Hall JE, et al. The importance of population-wide sodium reduction as a means to prevent cardiovascular disease and stroke: a call to action from the American Heart Association. Circulation. 2011 Mar 15;123(10):1138–43.
- Torun B. Energy requirements of children and adolescents. Public Health Nutr. 2005 Oct;8(7A):968–93.
- Rossouw HA, Grant CC, Viljoen M. Overweight and obesity in children and adolescents: the South African problem. South Afr J Sci. 2012 Jan;108(5–6):31–7.
- Ford ND, Patel SA, Narayan KMV. Obesity in low- and middle-income countries: burden, drivers, and emerging challenges. Annu Rev Public Health. 2017;38(1):145–64.
- Pérez-López FR, Pérez-Roncero G, López-Baena MT. Vitamin D and adolescent health. Adolesc Health Med Ther. 2010 Jan 26;1:1–8.
- Wrottesley SV, Lamper C, Pisa PT. Review of the importance of nutrition during the first 1000 days: maternal nutritional status and its associations with fetal growth and birth, neonatal and infant outcomes among African women. J Dev Orig Health Dis. 2016 Apr;7(2):144–62.
- Onyango AW. Dietary diversity, child nutrition and health in contemporary African communities. Comp Biochem Physiol A Mol Integr Physiol. 2003 Sep;136(1):61–9.
- Moreno LA, Rodríguez G, Fleta J, et al. Trends of dietary habits in adolescents. Crit Rev Food Sci Nutr. 2010 Jan 29;50(2):106–12.
- IOM (Institute of Medicine) and NRC (National Research Council). Dietary reference intakes for vitamin A, vitamin K, arsenic, boron, chromium, copper, iodine, iron, manganese, molybdenum, nickel, silicon, vanadium, and zinc [Internet]. Washington, DC: The National Academies Press; 2001 [cited 2015 Jun 3]. Available from: http://www.nap.edu/download.php?record_id=10026.
- IOM (Institute of Medicine) and NRC (National Research Council). Dietary reference intakes for thiamine, riboflavin, niacin, vitamin B6, folate, vitamin B12, pantothenic acid, biotin and choline [Internet]. Washington, DC: The National Academies Press; 1998 [cited 2018 Oct 25]. Available from: http://www.nap.edu/download.php?record_id=10026.
- Kesa H, Oldewage-Theron W. Anthropometric indications and nutritional intake of women in the Vaal Triangle, South Africa. Public Health. 2005 Apr;119(4):294–300.
- van Biljon A, McKune AJ, DuBose KD, et al. Physical activity levels in urban-based South African learners: a cross-sectional study of 7348 participants. SAMJ South Afr Med J. 2018 Feb;108(2):126–31.
- Mokabane NN, Mashao MM, van Staden M, et al. Low levels of physical activity in female adolescents cause overweight and obesity: are our schools failing our children? S Afr Med J. 2014 Aug 27;104(10):665–7.
- Banitt AA, Kaur H, Pulvers KM, et al. BMI percentiles and body image discrepancy in black and white adolescents. Obesity. 2008; 16(5):987–91.
- Parnell K, Sargent R, Thompson SH, et al. Black and white adolescent females— perceptions of ideal body size. J Sch Health. 1996 Mar;66(3):112–8.
- Chithambo TP, Huey SJ. Black/white differences in perceived weight and attractiveness among overweight women. J Obes [Internet]. 2013 [cited 2018 Jun 7]; Available from: https://www.hindawi.com/journals/jobe/2013/320326/.
- Draper CE, Grobler L, Micklesfield LK, et al. Impact of social norms and social support on diet, physical activity and sedentary behaviour of adolescents: a scoping review. Child Care Health Dev. 2015 Sep;41(5):654–67.
- Prioreschi A, Wrottesley SV, Cohen E, et al. Examining the relationships between body image, eating attitudes, BMI, and physical activity in rural and urban South African young adult females using structural equation modeling. PLoS ONE [Internet]. 2017 Nov 16;12(11). Available from: https://www.ncbi.nlm.nih.gov/pmc/articles/PMC5690598/.
- van Son GE, van Hoeken D, Bartelds AIM, et al. Urbanisation and the incidence of eating disorders. Br J Psychiatry J Ment Sci. 2006 Dec;189:562–3.
- Hausenblas HA, Fallon EA. Exercise and body image: a meta-analysis. Psychol Health. 2006 Feb 1;21(1):33–47.
- Lowes L, Robling MR, Bennert K, et al. Involving lay and professional stakeholders in the development of a research intervention for the DEPICTED Study. Health Expect Int J Public Particip Health Care Health Policy. 2011 Sep;14(3):250–60.
- Twine R, Kahn K, Scholtz A, et al. Involvement of stakeholders in determining health priorities of adolescents in rural South Africa. Glob Health Action [Internet]. 2016 Mar 15;9. Available from: https://www.ncbi.nlm.nih.gov/pmc/articles/PMC4794732/.
- Cole TJ, Rousham EK, Hawley NL, et al. Ethnic and sex differences in skeletal maturation among the Birth to Twenty cohort in South Africa. Arch Dis Child. 2015 Feb 1;100(2):138–43.
- Li K, Haynie D, Palla H, et al. Assessment of adolescent weight status: similarities and differences between CDC, IOTF, and WHO references. Prev Med. 2016 Jun;87:151–4.
- Pisa PT, Landais E, Margetts B, et al. Inventory on the dietary assessment tools available and needed in Africa: a prerequisite for setting up a common methodological research infrastructure for nutritional surveillance, research and prevention of diet-related non-communicable diseases. Crit Rev Food Sci Nutr. 2018 Jan 2;58(1):37–61.
- Johnson RK, Soultanakis RP, Matthews DE. Literacy and body fatness are associated with underreporting of energy intake in US low-income women using the multiple-pass 24-hour recall: a doubly labeled water study. J Am Diet Assoc. 1998 Oct;98(10):1136–40.
- Thompson FE, Subar AF, Loria CM, et al. Need for technological innovation in dietary assessment. J Am Diet Assoc. 2010 Jan;110(1):48–51.