
Abstract
Background
Nutritional screening facilitates the early identification of hospitalised children at risk of malnutrition. Screening tools have scarcely been evaluated in the developing world where the burden of malnutrition is greatest.
Methods
A retrospective study was undertaken of 113 patients admitted to the general paediatric wards at Rahima Moosa Mother and Child Hospital in Johannesburg, South Africa. Children 6 months to 14 years old were screened for malnutrition using anthropometry and correlating WHO z-scores, and retrospectively assessed for nutritional risk using a modified STAMP (mSTAMP).
Results
The mSTAMP identified additional patients at nutritional risk. The majority (87%) of children with normal anthropometry scored as medium and high risk using the mSTAMP. Weight loss and length of hospital stay (LOS) were higher in medium and high risk groups: One (5%) low risk child lost weight, compared with 8 (38%) medium and 12 (57%) high risk children (p = 0.021). Low risk children had a median LOS of two and half days (IQR 1–8) compared with medium and high risk groups, with medians of three (IQR 3–8) and six (IQR 4–9) days respectively (p = 0.04).
Conclusion
The mSTAMP identified more children at risk of malnutrition who may not have been considered for nutritional therapy during the hospital stay using anthropometry screening alone. There is a place for nutritional risk screening in developing world settings, but tools may need to be modified locally. Further studies and validation of these tools in sub-Saharan Africa seem prudent and may result in improved nutrition and outcomes of hospitalised children.
Introduction
Childhood malnutrition impacts negatively on a child’s immunity and growth and development, making it the most important risk factor for the global burden of disease.Citation1 The World Health Organization (WHO) recommends identifying acute malnutrition in children 6–59 months old by measuring weight-for-length/height (WHZ), mid upper-arm circumference (MUAC), and assessing the presence of nutritional oedema.Citation2 Length/height-for-age (HAZ) is used to identify stunting, the most common form of malnutrition in South Africa (SA).Citation3 Measurements are plotted on WHO growth standards charts, where z-scores correlate to a standard deviation of the international reference population.
While identifying children with established malnutrition is important, children at risk of developing malnutrition owing to their admission illness should also be identified as both predisposed to poor outcomes and prolonged hospital admissions.Citation4 Screening for children who are at risk of developing malnutrition in hospital is recommended by the European Society for Paediatric Gastroenterology, Hepatology and Nutrition (ESPGHAN),Citation5 the European Society for Clinical Nutrition and Metabolism (ESPEN),Citation6 and the American Society for Parenteral and Enteral Nutrition (ASPEN).Citation7 Four major nutritional risk screening tools include the Screening Tool for the Assessment of Malnutrition in Paediatrics (STAMP), the Paediatric Yorkhill Malnutrition Score (PYMS), the Screening Tool for Risk on Nutritional Status and Growth (STRONG(kids)), and the Subjective Global Nutritional Assessment (SGNA) for children. There is inconsistent and inconclusive data on which screening tool is superior to others, particularly in paediatrics.Citation8,Citation9
The purpose of nutritional screening is to identify children at risk of developing illness-related or hospital-acquired malnutrition, and to initiate nutritional therapy early—when it can be more effective and less expensive.Citation8 European studies have found that screening tools identified children with acute malnutrition. Huysentruyt et al. demonstrated a significant negative correlation between WHZ and the STRONGkids risk score (ρ = −0.23, p < 0.01).Citation8 These tools also identified children who were at high nutritional risk who may have been missed based on their normal anthropometrics.Citation8,Citation9 These tools have scarcely been studied or validated in a developing world setting.
At Rahima Moosa Mother and Child Hospital (RMMCH), a secondary level hospital in Johannesburg, SA, paediatric departmental protocols comply with WHO recommendations in screening all children for acute malnutrition using anthropometry.Citation2 Admitted children are routinely weighed, measured and screened for acute malnutrition based on these parameters (). Children with acute malnutrition should be referred to dietetics for nutritional rehabilitation, and those with severe acute malnutrition (SAM) with oedema should receive in-patient management as per the WHO ‘10 Steps’.Citation2 Thus, in practice, only children with established malnutrition based on anthropometry are referred to dietetics, while others will rely on the physicians’ opinion of the need for nutritional support. Furthermore, anthropometry is hampered by inconsistencies in the precise measurement of length/height,Citation3 and, due to genetic variations, the MUAC may not accurately depict the nutritional status of the child.Citation10
Table 1: Anthropometric definitions and respective STAMP score
The STAMP tool, developed and validated in the United Kingdom, scores nutritional risk based on parameters already assessed in our setting—anthropometry, nutritional intake and diagnosis. Each parameter is scored out of three. First, it scores the nutritional implications of the admission diagnosis, where 0 is no implications and 3 is definite implications. Then it assesses the nutritional intake of the child and scores this parameter, where no change in nutritional intake is given a score of 0 and a child with no intake a score of 3. Lastly, it scores the child’s anthropometry and corresponding centiles, where 0 is given to children with normal anthropometry and 3 to children with SAM.Citation11 A total score of more than 4 suggests high nutritional risk, requiring dietetics referral for nutritional rehabilitation. A score between 2 and 3 suggests a medium risk, warranting close dietary observation and repeat assessment after 3 days. A score of 0 to 1 suggests a low risk of malnutrition, and these children require repeat scoring weekly during their admission.Citation11 This quick screening tool should be easily and quickly implementable in many settings.
The tool may need to be modified to be more applicable locally, however, as in its current form it does not list illnesses such as human immune deficiency virus (HIV), tuberculosis (TB), pneumonia, and gastroenteritis in its diagnosis table—illnesses among the leading causes of under-five mortality in SA.Citation12
This study aimed to assess whether a nutritional risk screening tool such as an appropriately modified STAMP may assist in identifying children at risk of developing malnutrition while in hospital, in addition to identifying children who are already malnourished using anthropometry alone. This would result in more children being referred for nutritional support during their hospital stay. Our study is the first in the region looking at such screening tools in hospitalised children.
Methods
Study design and population
A retrospective study design was used, and data collected from hospital records of children admitted to the general paediatric wards at RMMCH. Included in the study were children 6 months to 14 years old admitted in February and March 2018. These age limits were determined by the hospital admission policy to the paediatric wards. The STAMP tool was modified as follows:
Inclusion of children from six months old.
Inclusion of HIV and TB as ‘Definite nutritional implications’ and diarrhoeal disease, pneumonia, and meningitis as ‘Possible nutritional implications’ (see Appendix A).
Anthropometry was classified using WHO growth standards charts and correlating z-scores. Where there was more than one admission diagnosis, the diagnosis with the highest score was used. Children with primary surgical diagnoses were excluded as they were not managed by paediatric doctors. Children admitted for overnight observation were excluded.
Data collection
Details of the children in our study population were identified using the hospital database and the files obtained from the records department. The following information was taken from each patient’s admission booklet: age, length of hospital stay in days (LOS), admission diagnoses, nutritional intake, admission weight (kg), length/height (cm), and MUAC (cm), clinician observed nutritional oedema, discharge weight, and outcome. The nutritional intake data were taken from the hospital admission booklet where clinicians would indicate, using the check boxes, if the child’s intake was normal, reduced or very little based on intake recall in the hours prior to presentation within the 24-hour period. Weight loss was determined by a loss of more than a gram from admission weight. Data were captured using REDCap electronic data capture tools hosted at the University of Witwatersrand. Captured data were anonymous, and ethical clearance was obtained from the Human Research Ethics Committee of the University of the Witwatersrand (Clearance number M180311).
Data analysis and statistics
Stata Intercooled version 11 (StataCorp, College Station, TX, USA) was used for statistical analysis. Patients were retrospectively scored using the modified STAMP (mSTAMP), with scores 0–3 given for each of admission diagnosis, nutritional intake and anthropometry (see Appendix A). mSTAMP scores were analysed as categorical data with scores 0–1 as low, 2–3 as medium, and ≥ 4 as high risk. Overweight children were allocated the lowest score for anthropometry (0) as the tool was used specifically for undernutrition. Children with acute malnutrition scored 1 or 3 for moderate acute malnutrition (MAM) and SAM respectively ().
Anthropometric z-scores were calculated using the WHO Anthro and AnthroPlus software programs (WHO, Geneva). The median and 25–75% interquartile ranges (IQR) were calculated for continuous variables. Categorical variables were compared using chi-square tests with Fisher’s exact statistics where appropriate. LOS and change in weight were analysed using the Kruskal–Wallis test, and excluded children who died or were transferred to other facilities.
Results
Baseline characteristics
A total of 262 children aged 6 months to 14 years were admitted during the study period. The 124 patients admitted for overnight observation and nine with surgical diagnoses were excluded from the study. Of the 129 eligible patients, 16 files were not found at the records department after multiple attempts. Therefore, 113 patient records were analysed. The median age of admitted children was 19 months (IQR 9–41), with 81% of children aged under five years (n = 91).
Diagnoses
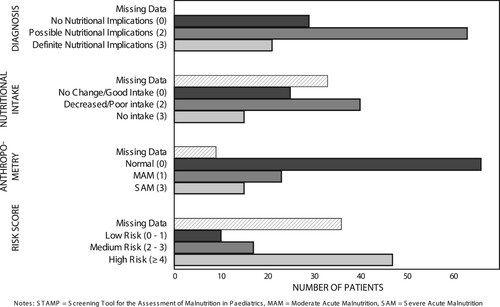
All children had at least one admission diagnosis. Respiratory illnesses made up most of the admission diagnoses (35%, n = 40/113), followed by diarrhoeal diseases (32%, n = 36/113), infections including HIV and TB (32%, n = 36/113) and nutritional illnesses (21%, n = 24). Almost 17% of admitted patients were HIV infected (n = 19/113). Notably, 20% (n = 23/113) of children had an admission diagnosis of acute malnutrition, the majority of whom had SAM. Gastroenteritis, pneumonia, meningitis, HIV and TB—diagnoses added to the STAMP tool—accounted for almost half of the admission diagnoses (47%, n = 89/186). The majority of patients had diagnoses with ‘Possible nutritional implications’ (56%, n = 63/113), and 19% (n = 21/113) had diagnoses with ‘Definite nutritional implications’ ().
Figure 1: Individual components of modified STAMP scores of patients admitted to Rahima Moosa Mother and Child Hospital.
Anthropometry
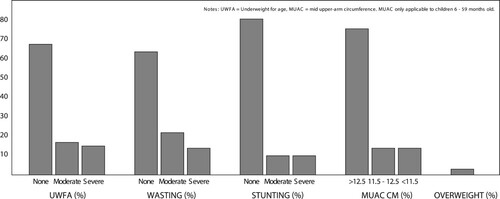
Not all patients had documented anthropometric data. Of the 113 analysed files 111 (98%) had an admission weight, 104 (92%) had both weight and length/height, and of the 91 patients ≤ 59 months, 42 (46%) had a documented MUAC (). The majority (68%) of children had a normal weight-for-age (n = 75/111). A total of 15 children were classified according to the WHO criteria as having SAM on the basis of WHZ < −3, MUAC < 11.5 cm, or the presence of nutritional oedema. Wasting was the most common form of malnutrition. Moderate wasting was seen in 24% of children under five years (n = 20/85), and 14% (n = 12/85) had severe wasting. Of the children under five years with MUAC measurements, 14% (n = 5/42) were < 11.5 cm. Five patients (4%) had nutritional oedema (kwashiorkor). Some 19% (n = 20/104) of children were stunted, half of them severely so. There were three (3%) overweight (WHZ > 2) and no obese (WHZ > 3) children.
Figure 2: Anthropometric classification of patients admitted to the General Paediatric Wards at Rahima Moosa Mother and Child Hospital.
Nutritional intake
Thirty-three children did not have documented intake data (29%) (). Of those with intake data, half had poor or reduced intake (n = 40/80). Nearly 20% of children with intake data had no intake in the hours prior to admission (n = 15/80).
Risk scores
Of the 113 patients, 8% (n = 9/113) had missing anthropometric data and 29% (n = 33/113) had missing intake data. Thus, 39 patients were excluded from the final analysis (three children had both missing intake and missing anthropometric data). The majority of children were classified as high risk using the mSTAMP (64%, n = 47/74) (). An analysis comparing the anthropometric assessment to the mSTAMP score showed that all children with SAM had a high risk mSTAMP score ().
Table 2: Anthropometric classification and modified STAMP scores
More than half of the high risk children had normal anthropometry (n = 24/47). Based on anthropometry alone 29 (39%) children had MAM or SAM, while using the mSTAMP 64 (86%) children were assessed as having either medium or high nutritional risk. Of the 45 children with normal anthropometry 13% (n = 6/45) scored as low risk, 33% (n = 15/45) as medium risk and 53% (n = 24/45) as high risk using the mSTAMP.
Outcomes
and detail the outcomes using the mSTAMP and using anthropometry only respectively. Half of the children were seen by a dietitian (n = 37/74) (). Less than half of the high risk children (as identified by the mSTAMP tool) were seen by dietetics. Of the 38 children with acute malnutrition, 79% (n = 30/38) were seen by a dietitian, while two children with SAM were neither referred to nor screened by dietetics (). All but four children who saw a dietitian received nutritional supplementation.
Table 3: Modified STAMP (mSTAMP) scores and outcomes
Table 4: WHO anthropometric classification and outcomes
There was a statistically significant correlation between increasing LOS and a higher mSTAMP score (). The low risk had a median LOS of 2.5 days (IQR 1–8) compared with medium and high risk groups with medians of 3 (IQR 3–8) and 6 (IQR 4–9) days respectively (Kruskal–Wallis p = 0.04). Discharge weight, and hence weight lost/gained, was available for 71 of the eligible children included in the outcomes analysis using the mSTAMP. Of the 21 children who lost weight during the admission, 1 (5%) had a low-risk mSTAMP score, 8 (38%) medium and 12 (57%) were high risk (p = 0.021). High risk children had the most median weight gain per day compared with the other groups, with children who were medium risk having a median of 25 g weight loss per day (IQR −75–27). There were three deaths reported, none of whom were scored as low risk. Five children were transferred to other facilities.
Comparing the original STAMP tool versus the mSTAMP, the original STAMP would have identified more low risk (13 vs. 10 for STAMP and mSTAMP respectively) and more medium risk (42 vs. 17 for STAMP and mSTAMP respectively), but fewer high-risk patients (19 vs. 47 for STAMP vs. mSTAMP) (). The original STAMP tool did not predict LOS in our sample (p = 0.04 vs. p = 0.55 for mSTAMP and STAMP respectively). Lastly, the original tool classified four of the 11 children with SAM as medium risk compared with all 11 children with SAM classified as high risk using the mSTAMP.
Table 5: Comparing STAMP with the modified STAMP
Discussion
The current practice at Rahima Moosa Mother and Child Hospital, and South African healthcare centres at large, is to refer all children with acute malnutrition (MAM and SAM) to dietetics for nutritional assessment and rehabilitation. This is done using anthropometry and the WHO definition of acute malnutrition.Citation2 Thus, unless otherwise indicated, children with normal anthropometry are generally not referred for nutritional support. Anthropometrics alone do not consider illness and any further deterioration in the nutritional status of a child during illness and/or hospitalisation. The negative effects of poor or deteriorating nutrition in these children have been well described, with poorly nourished children at higher risk of nosocomial and wound sepsis, as well as increased LOS.Citation4,Citation13 It has also been demonstrated that children at higher nutritional risk using a nutritional risk scoring tool have longer hospital admissions.Citation8 Our results support this, showing a statistically significant association between mSTAMP risk score and LOS (p = 0.04).
The top four disease groups in the study mirror the national trends, each being among the leading causes of under-five mortality in SA.Citation12,Citation14 Illnesses added to the STAMP tool accounted for almost half of the total admissions, highlighting the differing disease profile seen in this setting. The use of the WHO z-scores may prevent confusion as local guidelines recommend the use of z-scores, which may improve the compliance of clinicians in completing the risk assessment. It will also allow clinicians to identify children with MAM and SAM.
Many of the patients had missing data, the majority of whom had missing intake data. This may be because the initial history is typically taken by the most junior doctor (such as the intern doctor). These doctors may, perhaps, not appreciate the importance of a dietary history in all children, specifically a 24-hour intake recall in an ill child—this despite poor intake being among the WHO Integrated Management of Childhood Illness (IMCI) ‘Danger Signs’.Citation15 Even more disappointing is the number of children with missing anthropometry, with MUAC most poorly performed in the current study, followed by length/height and then weight. Given that anthropometrics (and correlating WHO z-scores) is the mainstay for malnutrition surveillance in SA, and that dosing in paediatric patients is largely weight-dependent, one would expect 100% compliance for weight.
Despite the reliance on anthropometry for nutritional screening, it remains very poorly performed among clinicians.Citation3 Appropriate equipment is frequently not calibrated or is unavailable in many hospitals, and there are inconsistencies in the plotting and interpretation of growth parameters, with some clinicians using WHO growth standards charts and others using one of many available mobile applications to calculate z-scores. All these issues potentially result in over- or under-estimation of malnutrition. In addition to poorly performed anthropometry, not all children with MAM or SAM were referred to dietetics as recommended by the WHO—six children with an admission diagnosis of MAM and two with SAM did not see a dietitian during their admission.
The results of this study showed that the mSTAMP identified more children at nutritional risk than anthropometry alone. The vast majority of children with normal anthropometry scored as medium to high risk using the mSTAMP, and more than half of the high risk children had normal anthropometry (). This suggests that the screening tool may be useful in identifying at-risk children who, by virtue of having normal anthropometry, would otherwise not receive nutritional support. A third of children with normal anthropometry had weight loss on discharge, compared with 17% and 13% of children with MAM and SAM respectively (). This may likely be explained by the mandatory nutritional rehabilitation offered to the latter two groups. These children would be eligible for discharge once they had gained weight to the satisfaction of the dietitian.
Notwithstanding our sample size being too small to validate the two scores in our setting, these preliminary data show that the unmodified tool may not be appropriate in our setting. The original tool performed worse at predicting LOS and failed to classify four SAM patients as high risk. This may be attributed to the addition of common admission diagnoses with likely nutritional or food intake implications to the modified score.
A final consideration is which member of the healthcare staff will implement the screening. The STAMP tool was designed for use by non-dietetic healthcare professionals, and hence screening may be performed by nursing staff, dietitians or physicians, depending on the local situation and staff availability. However, while the screening may be performed by non-dietetic staff, nutritional rehabilitation is facilitated by clinical dietitians. Thus, as more children are identified for nutritional risk using screening tools such as the mSTAMP, more dietitians and dietetic services are required. This will have financial implications for the health system as it would mean more (and improved) anthropometric equipment and appropriate nutritional supplementations, as well as adequate human capacity. Nevertheless, early and preventative interventions for at-risk children may prove more cost effective and may be required for a shorter period than treating established malnutrition. In addition, improving the nutritional outcomes may result in shorter hospital stays with fewer complications. These assertions should be tested in prospective trials.
Study limitations
Files not found at the records department affected the sample size. Intake, anthropometric and discharge weight data were poorly captured. As this was a retrospective analysis, anthropometric measurement techniques and equipment were not witnessed and cannot be verified. The intake recall data were subjectively assessed as normal, decreased or no intake during the hours prior to admission. Furthermore, no specialised growth charts or corrections were used for children with physical disabilities (e.g. cerebral palsy), ex-premature infants and syndromic children (e.g. Down syndrome). Children admitted to surgical disciplines were excluded, although these children would likely benefit from nutritional screening as they are infrequently screened for malnutrition.
Lastly, our modifications to the STAMP tool are yet to be validated, and further prospective studies are needed in this regard. Similarly, the cost:benefit ratio of nutrition risk screening tools remains to be proven.
Conclusions
Nutritional risk screening tools are recommended globally and enable early detection of nutritional deterioration and treatment. They are yet to be explored as an adjunct to anthropometry in South Africa and sub-Saharan Africa at large. This study shows that we are currently not referring all children at medium and high nutritional risk (as per mSTAMP) for dietetic assessment and/or intervention. Pitfalls in both measurement and interpretation of anthropometry may result in some children not receiving necessary nutritional rehabilitation. It is the authors’ opinion that nutritional risk screening tools, with local modification, may have an important role to play in nutritional care of hospitalised children in the developing world setting. Further prospective studies and validation of these tools in South Africa and sub-Saharan Africa can assist in this respect. Implementing these tools may improve the nutritional status, decrease the length of stay and nosocomial infections, and improve the clinical outcomes of hospitalised children.
What is already known on this topic?
Hospitalised children are at risk of developing malnutrition, which may increase their risk of complications and result in prolonged admissions.
Nutritional screening is recommended by several European and American paediatric expert nutritional societies to identify nutritionally at-risk hospitalised children due to their illness and/or hospitalisation.
Childhood malnutrition is a major public health issue, and sub-Saharan Africa remains heavily burdened, but screening tools are yet to be evaluated in these settings.
What this study adds
Hospitalised children with normal anthropometry may still be at medium or high nutritional risk when using a nutritional screening tool.
Children with acute malnutrition, or those with medium to high nutrition risk using the mSTAMP screening tool, are frequently not being referred for dietetic intervention in the current setting.
Nutrition risk screening tools should be adapted to include the local disease profile, and to cater for other practical implications.
Disclosure statement
No potential conflict of interest was reported by the authors.
References
- International Food Policy Research Institute. Global nutrition report 2016: from promise to impact: ending malnutrition by 2030. Washington (DC): International Food Policy Research Institute; 2016.
- WHO. Guideline: updates on the management of severe acute malnutrition in infants and children. Geneva: World Health Organisation; 2013.
- Brink J, Pettifor JM, Lala SG. The prevalence of malnutrition in children admitted to a general paediatric ward at the Chris Hani Baragwanath Academic Hospital: a cross-sectional survey. SAJCH. 2014;8(3):112–6. https://doi.org/https://doi.org/10.7196/SAJCH.787.
- Chourdakis M, Hecht C, Gerasimidis K, et al. Malnutrition risk in hospitalized children: use of 3 screening tools in a large European population. Am J Clin Nutr. 2016;103(5):1301–10. https://doi.org/https://doi.org/10.3945/ajcn.115.110700.
- Agostoni C, Axelson I, Colomb V, et al. The need for nutrition support teams in pediatric units: a commentary by the ESPGHAN committee on nutrition. J Pediatr Gastroenterol Nutr. 2005;41(1):8–11. https://doi.org/https://doi.org/10.1097/01.mpg.0000163735.92142.87.
- Cederholm T, Barazzoni R, Austin P, et al. ESPEN guidelines on definitions and terminology of clinical nutrition. Clin Nutri. 2017;36(1):49–64. https://doi.org/https://doi.org/10.1016/j.clnu.2016.09.004.
- Wonoputri N, Djais JTB, Rosalina I. Validity of nutritional screening tools for hospitalized children. J Nutr Metab. 2014;2014:143649. https://doi.org/https://doi.org/10.1155/2014/143649.
- Huysentruyt K, Alliet P, Muyshont L, et al. The STRONG kids nutritional screening tool in hospitalized children: a validation study. Nutrition. 2013;29(11–12):1356–1361. https://doi.org/https://doi.org/10.1016/j.nut.2013.05.008.
- Tuokkola J, Hilpi J, Kolho K, et al. Nutritional risk screening—a cross-sectional study in a tertiary pediatric hospital. J Health Popul Nutri. 2019;38(1):8. https://doi.org/https://doi.org/10.1186/s41043-019-0166-4.
- Grellety E, Golden MH. Weight-for-height and mid-upper-arm circumference should be used independently to diagnose acute malnutrition: policy implications. BMC Nutr. 2016;2:10. https://doi.org/https://doi.org/10.1186/s40795-016-0049-7.
- Mc Carthy H, Dixon M, Crabtree I, et al. The development and evaluation of the screening tool for the assessment of malnutrition in paediatrics (STAMP©) for use by healthxare staff. J Hum Nutr Diet. 2012;25(4):311–318. https://doi.org/https://doi.org/10.1111/j.1365-277X.2012.01234.x.
- Reid AE, Hendricks MK, Groenewald P, et al. Where do children die and what are the causes? Under-5 deaths in the Metro West geographical service area of the Western Cape, South Africa, 2011. SAMJ. 2016;106(4):359–64. https://doi.org/https://doi.org/10.7196/SAMJ.2016.v106i4.10521.
- Schaible UE, Kaufmann SHE. Malnutrition and infection: complex mechanisms and global impacts. PLoS Med. 2007;4(5):e115. https://doi.org/https://doi.org/10.1371/journal.pmed.0040115.
- Bamford LJ, Mckerrow NH, Barron P, et al. Child mortality in South Africa: fewer deaths, but better data are needed. SAMJ. 2018;108(3):25–32. https://doi.org/https://doi.org/10.7196/SAMJ.2017.v108i3b.12779.
- WHO. Handbook: integrated management of childhood illness. Geneva: World Health Organisation; 2005.
Appendix A
Table A1: Modified screening tool for the assessment of malnutrition in paediatrics (STAMP)
Table A2: Modified STAMP diagnosis table