
Abstract
Objective:
This study aimed to assess the objective understanding of five front-of-pack label formats, namely the Reference Intake, Multiple Traffic Light label, Nutri-Score, health endorsement logo and warning label, among consumers in Nelson Mandela Bay, South Africa.
Design:
This was a cross-sectional, exploratory study.
Setting:
Interviewer-administered surveys were conducted at 12 randomly selected food retail outlets in an urban setting.
Subjects:
A total of 359 adult participants were included in this study.
Outcome measures:
Objective understanding was measured by asking participants to rank food products according to their nutritional quality, using the displayed front-of-pack label.
Results:
The type of front-of-pack label significantly influenced ranking ability (p < 0.00001). All the evaluative front-of-pack labels significantly improved the participants’ ability to identify healthier food products compared with the no-label control. The reductive Reference Intake, however, showed no significant impact on consumer understanding.
Conclusion:
Evaluative front-of-pack labels significantly improved the participants’ ability to identify healthier food products, when compared with the Reference Intake and no-label control. Future research should test the objective understanding of culturally diverse groups in South Africa, particularly among rural populations.
Introduction
The South African food environment has changed rapidly since the 1990s. Due to the influx of trade and investment by international food and beverage manufacturers and the dominance of chain supermarkets, ultra-processed high fat, sugar and salt (HFSS) foods have become widely available, affordable and acceptable.Citation1, Citation2 The steep increase in the consumption of HFSS foods has contributed to the upward trend of obesity and non-communicable diseases (NCDs).Citation1 In South Africa (SA), the prevalence of overweight and obesity is 68% for women and 31% for men.Citation3 Furthermore, the World Health Organization (WHO) has estimated that 51% of total deaths in SA are due to NCDs.Citation4 To combat the upward trend of overweight and obesity, the South African government released the Strategy for the Prevention and Control of Obesity in South Africa (2015–2020). One of its objectives is to implement user-friendly food labelling that allows consumers to identify and access healthy food options in various settings.Citation5
Effective front-of-pack labels (FoPLs) allow consumers to make accurate conclusions concerning the nutritional quality of a product by translating the back-of-pack nutrition information into an intuitive and abbreviated format.Citation6, Citation7 However, to be effective in purchasing situations, FoPLs need to be consumer-friendly and easy to understand.Citation7 Although multiple taxonomies of FoPLs exist, FoPL systems can be divided broadly into three categories: reductive, evaluative or hybrid.Citation8 Reductive labels display key nutrients from the back-of-pack food label in a reduced snapshot format.Citation8 As opposed to reductive labels, evaluative food labels interpret the nutrient levels, and thereby make conclusions on the overall nutritional quality, of a food product.Citation8–10 Hybrid food labels encompass both reductive and evaluative components.Citation8 Over the years, there have been numerous FoPLs designed that exist within these categories and each differs in the degree to which it provides nutritional information versus nutritional advice to consumers.Citation6,Citation8 Research has shown that South African consumers struggle to understand the quantitative nutritional information presented on purely reductive food labels.Citation11 This is particularly true for low-literate consumers residing in rural areas in SA.Citation12 Evaluative FoPLs, on the other hand, tend to be better understood by consumers, particularly among consumers from lower socioeconomic circumstances and education levels.Citation7, Citation13 This is relevant to SA, as over half (55.5%) of all South Africans live in poverty, according to the upper-bound poverty line of R992 per person per month.Citation14
In SA, food manufacturers and retailers have released a proliferation of food products displaying numerous health claims and logos, which South African consumers find difficult to understand and interpret.Citation10 The dearth of food labelling research conducted,Citation15 specifically in light of the fact that consumers’ understanding of FoPL formats may differ across countries,Citation7 necessitates that more food labelling research be conducted in SA, particularly as international food labelling research may not be applicable to SA.Citation16 The present study intended to address this research gap by determining which FoPL format the South African consumer best objectively understands to inform future food labelling policies and strategies that are tailor-made for the South African consumer.
Methods
A cross-sectional, exploratory study was conducted in the Nelson Mandela Bay (NMB) region within the Eastern Cape province, SA. Quantitative data were collected using an interviewer-administered questionnaire. Ethics approval for the present study was granted by the Faculty Postgraduate Studies Committee, Nelson Mandela University, Port Elizabeth, SA (ethics clearance reference number H18-HEA-DIET-006). During all stages of the study, the ethics guidelines set in the Declaration of Helsinki were followed.
Sampling of food retailers
Cluster sampling was used to identify the study locations. The NMB region is divided into 60 wards. Aerial maps of each ward were analysed and wards that did not have a major food retailer located within the ward were excluded. The remaining wards were then allocated a number (1 to 25). Utilising the random number generator function of Microsoft Excel (Microsoft Corp, Armonk, NY, USA), 12 wards were randomly selected. The sample was checked to ensure that areas servicing all standards of living levels were included. Specific locations of each food retailer were then identified, using the store locator function on each retailer’s webpage. It was noted that a certain major food retail chain had retail food outlets in each of the randomly selected wards. Thus, it was decided to use each of these retail units as study locations. Permission to collect data at the relevant outlets was obtained from the head office, regional head office and from each store manager.
Sampling of participants
Adult participants (≥ 18 years) (N = 359) were recruited after completing their grocery shopping on the days of data collection. A minimum sample size of 271 was required to be within a 5% margin of error and at a 90% confidence level.Citation17 Fieldworkers invited the first person exiting the food retailer to participate in the study. If that person declined, the first person leaving the store thereafter would be approached. After each interview the fieldworker would then once again approach the first person leaving the store. The surveys were conducted at different times to include a wider range of participants.
Data collection methods
Data were collected by first-year BSc Dietetics students at the various study locations over two weekdays during September 2019. Each pair of students was supervised by a dietitian or senior BSc Dietetics student during the survey procedure. Prior to the data collection, the students and supervisors were trained according to a standard operating procedure and were afforded the opportunity to practise the data collection procedure with each other and other students on campus.
On the day of data collection, participants were screened for eligibility and written informed consent was obtained. Participants, however, were not provided with a copy of the consent form. Participants needed to be 18 years or older, reside in NMB and able to read English and provide informed consent. An explanation of what the survey procedure would entail, the aim of the study and the right of the participant to refuse or leave the study at any time was provided to the participants. Since the participants had to provide only their initials and signatures on the consent forms, anonymity and confidentiality were maintained. Face-to-face interviews were conducted in a quiet area near the exit of the food retailer. A light snack was provided at the end of the interviews. The data collection tools and ranking task procedure used in the present study were adapted, with permission, from the French NutriNet-Santé study.Citation18
Questionnaire
A structured interviewer-administered questionnaire was used to conduct the survey. The survey procedure was conducted in English, as food labels in SA predominantly display nutritional information in English.Citation16 The first section of the questionnaire covered demographic information. The second section assessed the objective understanding of participants and the third section ascertained FoPL preferences, which have been reported elsewhere.Citation19 The questionnaire consisted of 25 closed-ended questions and the interview process took an average of 15 minutes to complete. The questionnaire and stimulus material were validated by sending them to an expert in the field of labelling for comment. The questionnaire and survey procedure were further validated via a pilot study. The primary researcher, with the aid of a dietitian and trained BSc Dietetics students, conducted the pilot study in a centrally located shopping mall situated outside the identified study locations. To achieve face validity, the questionnaire was then adapted based on the feedback from the participants and fieldworkers. The results of the pilot study were not used in the main study due to its location, which fell outside the identified study locations.
Design of mock food products
Mock product images were created by a graphic designer, specifically for the present study, to prevent possible product biases. It was decided not to use images of actual food products on the market, as research has indicated that familiar brands are often perceived as healthier than unknown brands.Citation20 The products, however, were representative of products commonly consumed by South AfricansCitation21 and are widely available at major food retailers in SA. The specific product categories were chosen as the food products within the categories generally exhibit wide differences in nutritional content, allowing the products to be clearly ranked according to healthfulness.Citation22 The nutritional values and suggested serving sizes allocated to each of the food products were based on similar food products currently on the market.
Five product categories were selected, namely: chicken burgers, ready-meals, breakfast cereals, dairy products and snacks (crisps). The range of product categories allowed the researcher to assess objective understanding across several product categories.Citation23 Other than the FoPL, no other nutritional information or health claims were displayed on the mock food products, so as not to influence the participants’ perception of the products. The FoPLs all appeared in a consistent location and each covered roughly the same surface area on the product’s packaging.Citation24
Design and allocation of the food labels
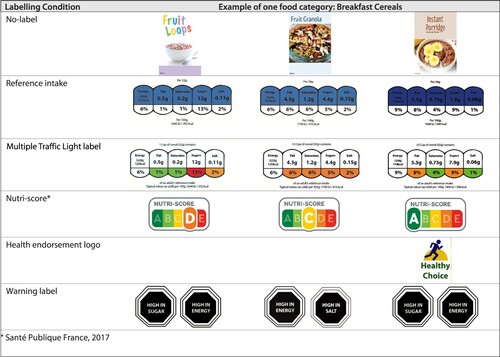
Five FoPL formats were used in the present study: Reference Intake (RI), Multiple Traffic Light (MTL) label, Nutri-Score, health endorsement logo (HEL) and warning label (WL). The design and allocation of the RI was informed by a guide detailing the correct implementation of the RI published in the United Kingdom by the Food and Drink Federation.Citation25 Similarly, the United Kingdom Department of Health’s ‘Guide to Creating a Front of Pack (FoP) Nutrition Label for Pre-packed Products Sold Through Retail Outlets’ was used to design and allocate the MTL labels.Citation26 With regard to the Nutri-Score, permission to use the Nutri-Score was granted by the French Public Health Agency. The HEL was designed specifically for the present study. The design process was guided by current literature, in terms of colours used,Citation27 background saliency,Citation28 use of the words ‘healthy choice’ and graphics related to health.Citation10 The SA nutrient profile model was used to allocate the Nutri-Score and HEL. The Chilean Warning System was utilised as the basis to design the WLs for the present study. The allocation of the WLs was determined by using the Chilean Warning System’s cut-off limits.Citation29
Procedure
After completion of the first section of the questionnaire, participants were given the task to rank three food products, from the five product categories, according to their nutritional quality. Prior to the ranking task, a short explanation of each FoPL was provided to each participant. Participants were then shown images of three food products from the same food category displaying no food label, which served as the no-label control. The participants were then asked to rank the three food products according to their nutritional quality, from least healthy to healthiest. Thereafter, the participants were shown three food products again, but displaying the FoPLs this time, and asked to specifically use the FoPL to rank the food products. An ‘I don’t know’ option was also available. The process was repeated with all five food categories, each category displaying a different FoPL. The products were displayed to participants in varying orders, based on a Latin Square Design,Citation30 to control for potential order effects. shows the FoPL allocations for the breakfast cereal category.
Figure 1: Example of the FoPL allocations for the breakfast cereal category. *Santé Publique France, 2017.
Statistical analysis
The primary researcher captured the data on Microsoft Excel. STATISTICA Version 13 (2017) (TIBCO Software, Palo Alto, CA, USA) was used to analyse the data. The overall ability of participants to rank the products correctly, across all label conditions, was assessed by calculating the number of overall correct answers to obtain a percentage value. To compare the overall ranking ability across subgroups, analysis of variance (ANOVA) tests were performed, using the percentage value as the dependent variable and selected demographic factors as the independent variables. Post hoc analysis was performed, utilizing Tukey’s HSD tests, wherever significant differences were found between groups. Chi-square tests were used to determine associations between the type of FoPL and improvement in ranking ability. Chi-square tests were also used to assess relationships between objective understanding and certain demographic factors. The performance of each FoPL format was compared with the others using Z-tests and odds ratio tests. All tests of significance were two-sided and a p-value < 0.05 was considered statistically significant.
Results
Participant demographics
details the demographic data that were collected from the first section of the questionnaire. The sample numbered 359, with the majority of participants being female (64.7%, n = 232). The mean age of participants was 41.2 years (SD = 16.25, range: 18–87 years). Just under half (47.6%, n = 171) of the participants reported they were single, with the majority (78.3%, n = 281) of the participants reporting to have one or more dependents. A total of 222 (61.8%) participants attended high school, whilst 90 participants (25.1%) reported attaining a post-school qualification. Approximately one-quarter (24.8%, n = 89) of the participants reported a monthly household income of between R1 059 and R4 250, whereas 60 of the participants (16.7%) had an income of below R1 059.
Table 1: Demographic profile of participants (N = 359)
Influence of individual characteristics on the overall ability to rank products according to nutritional quality
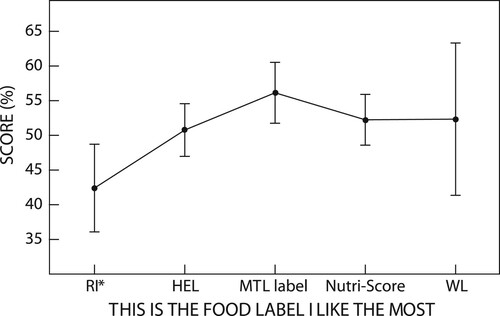
Differences in the ability of subgroups to accurately rank food products, across all label conditions, according to nutritional quality were compared using ANOVA. Significant differences were found in the ranking ability among participants with different education levels (Tukey HSD test, p < 0.003) (). Participants with higher education levels ranked more products correctly, compared with participants who had lower education levels. No significant differences were found in ranking ability between participants in terms of gender and levels of income. It is interesting to note that the participants who indicated that they preferred the MTL label also scored the highest percentage of correct answers across all label conditions during the ranking task (Tukey HSD test, p < 0.03) ().
Figure 2: Mean scores depicting the participants’ level of education and their ability to accurately rank food products according to nutritional quality.
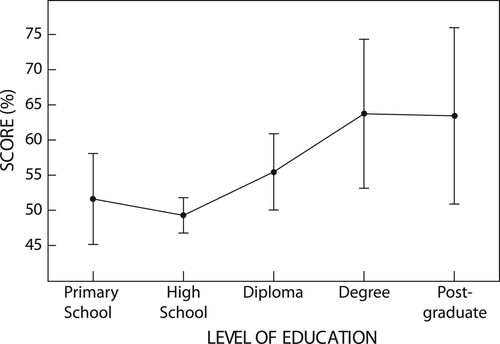
Figure 3: Mean scores comparing participants’ FoPL preference with their overall ability to accurately rank food products. *RI, Reference Intake; HEL, health endorsement logo; MTL, Multiple Traffic Light; WL, warning label.
Objective understanding of the specific FoPL formats
Overall, it was found that the type of FoPL significantly influenced the participants’ ability to accurately rank the food products (p < 0.00001). The Nutri-Score produced the most correct responses, closely followed by the WL, MTL label and HEL (46.2%, 43.1%, 40.7%, 38.7% correct, respectively). The RI elicited the least number of correct answers (28.6%). All the labels, except for the RI, significantly improved the participants’ ranking ability compared with the no-label control. Once again, the Nutri-Score was associated with the best improvement in the score when compared to the no-label control (odds ratio (OR) = 2.7, p < 0.00001). Furthermore, all the evaluative FoPLs significantly outperformed the RI with regard to eliciting correct responses. compares the specific FoPLs with the no-label control, and each other, in terms of improving the ability of participants to accurately identify the healthier food products.
Table 2: Comparisons of the specific FoPL’s influence on ranking ability
Comparison of FoPL performance across subgroups
When comparing the different label formats, in terms of improving ranking ability, significant differences were found among the different ethnicities (p < 0.01). The RI performed poorly among black participants, eliciting fewer correct responses (25%), compared with the mixed-race (38.3%) and white participants (41.0%). The objective understanding of the different FoPLs also significantly differed across education levels. Participants who attended primary school best understood the MTL label, which elicited 46.8% correct responses. Participants with some form of high school and post high school qualification best understood the Nutri-Score (with 44.1% and 56.7% correct responses respectively). Objective understanding of the label formats also significantly differed among different income groups. However, once again no single FoPL emerged as best understood among this subgroup. For participants who earned ≤ R1 508 per month, the WL, MTL label and Nutri-Score produced similar percentages of correct responses (39.7%, 38.3% and 37.6% correct, respectively). For participants who earned between R1 059 and R4 250 and those who earned > R4 250 per month, the Nutri-Score yielded the highest number of correct responses, achieving 51.0% and 54.7% respectively for each subgroup.
Discussion
This study provided new evidence on the objective understanding of five FoPL formats, currently in use worldwide,Citation31 among South African consumers. The overall ability of participants, across all formats, to accurately rank the products according to their nutritional quality significantly differed across education levels. Participants with lower education levels achieved significantly fewer correct responses in the ranking task than participants with higher education levels. In a study conducted in SA, participants completed a quiz to assess their food and nutritional label knowledge.Citation16 It was found that participants with lower levels of education achieved significantly lower scores compared with participants who had higher levels of education. Thus, in the present study, as understanding is dependent on prior knowledge and inferences,Citation13 a lack of baseline nutrition knowledge among participants with lower education levels may have influenced their ability to accurately identify the healthier food products.
With regards to the objective understanding of the specific FoPL formats, four of the five FoPLs significantly improved the ability of the participants to accurately rank food products according to their nutritional quality. The RI was the only FoPL that failed to significantly improve the participants’ ranking ability when compared with the no-label control. Furthermore, all the evaluative FoPLs, namely the MTL label, Nutri-Score, HEL and WL, significantly outperformed the RI in terms of improving ranking ability. This is in line with previous studies, conducted both locallyCitation10 and worldwide,Citation24,Citation32,Citation33 which have shown that consumers struggle to understand the quantitative information presented on non-interpretive food labels.
The Nutri-Score led to the highest improvement in ranking ability, closely followed by the WL. Globally, research conducted on both the Nutri-Score and WLs has shown positive results. The Nutri-Score has performed well in terms of consumer perception, objective understanding, portion sizes and improved nutritional quality of food purchases.Citation24,Citation32,Citation34–36 Furthermore, research conducted in South America has shown the WL to be understandable, helpful in allowing consumers to quickly identify unhealthy products and a useful tool to motivate product reformulation.Citation28,Citation37,Citation38 The HEL emerged as the least effective evaluative FoPL. It may be argued that the HEL easily allowed the participants to identify the ‘healthiest’ food product; however, the participants may have struggled to accurately rank the two products that did not qualify for the HEL. This is consistent with findings from previous research, which suggested that the over-simplified HEL format does not allow consumers to differentiate between products of medium and low nutritional quality.Citation24
For the present study, the monochromatic RI and polychromatic MTL label displayed similar quantitative nutritional information. Thus, it can be ascertained that the addition of interpretive colours to the MTL label significantly increased ranking ability when compared with the RI. Previous research has found that the addition of symbolic colours, green meaning ‘go’ and red meaning ‘stop’, increases consumers’ understanding, motivation and use of FoPLs.Citation8,Citation24,Citation39
Study limitations
The study was conducted in certain wards of the NMB area and therefore results cannot be extrapolated to represent the wider NMB and South African populations. The survey procedure did not represent a real-life purchasing environment because factors that influence consumer understanding, such as the variety of food products available, marketing messages and time pressures, were not accounted for.Citation32
Conclusion
The present study provides novel information on the objective understanding of different FoPL formats among South African consumers. The overarching conclusion is that the evaluative FoPL formats were significantly better understood than the reductive RI format. This is concerning as many food manufacturers currently make use of the reductive Guideline Daily Amounts label in SA. The findings of this study suggest that future labelling policies should include evaluative FoPL formats. Future research should aim to test objective understanding among culturally diverse groups in SA, particularly among rural populations. Furthermore, considering that objective understanding differed among subgroups, focus-group discussions targeting multicultural groups could be conducted in NMB to investigate whether an alternative approach to labelling exists.
Funding sources
No funding source to report.
Ethical standards and disclosure
This study was performed in accordance with the guidelines set in the Declaration of Helsinki. Ethics approval for the study was granted by the Faculty Postgraduate Studies Committee, Nelson Mandela University, Port Elizabeth, South Africa (ethics clearance reference number H18-HEA-DIET-006). Written informed consent was obtained from all participants.
Acknowledgements
The researcher would like to acknowledge the dietitians and students who aided in the data collection.
Disclosure statement
No potential conflict of interest was reported by the authors.
References
- Igumbor EU, Sanders D, Puoane TR, et al. ‘Big Food,’ the consumer food environment, health, and the policy response in South Africa. PLOS Med. 2012;9(7):e1001253. doi:10.1371/journal.pmed.1001253.
- Spires M, Delobelle P, Sanders D, et al. Diet-related non-communicable diseases in South Africa: determinants and policy responses. S Afr Health Rev. 2016;1:35–42. [cited 10 April 2020]. Available from: http://hdl.handle.net/10520/EJC189320.
- South African National Department of Health, Statistics South Africa, South African Medical Research Council and ICF. South Africa Demographic and Health Survey 2016 Key Indicators. 2017. [cited 10 April 2020]. Available from: https://www.statssa.gov.za/publications/Report%2003-00-09/Report%2003-00-092016.pdf.
- World Health Organization. South Africa, World Health Organization – Noncommunicable Diseases (NCD) Country Profiles. (2018). [cited 12 April 2020]. Available from: https://www.who.int/nmh/countries/zaf_en.pdf.
- South African National Department of Health. Strategy for the prevention and control of obesity in South Africa. (2016). [cited 10 April 2020]. Available from: http://www.health.gov.za/index.php/2014-03-17-09-09-38/policies-and-guidelines/category/327-2017po?download=1832:strategy-for-the-prevention-and-control-of-obesity-in-south-africa.
- Van Kleef E, Dagevos H. The Growing role of front-of-pack nutrition profile labeling: A consumer perspective on key issues and controversies. Crit Rev Food Sci Nutr. 2015;55(3):291–303. doi:10.1080/10408398.2011.653018.
- World Health Organization. Guiding principles and framework manual for front-of-pack labelling for promoting healthy diet. 2019. [cited 19 June 2020]. Available from: https://www.who.int/nutrition/publications/policies/guidingprinciples-labelling-promoting-healthydiet.pdf?ua=1.
- Kelly B, Jewell J. What is the evidence on the policy specifications, development processes and effectiveness of existing front-of-pack food labelling policies in the WHO European Region? 2018. [cited 10 April 2020]. Available from: http://www.euro.who.int/en/publications/abstracts/what-is-the-evidence-on-the-policy-specifications,-development-processes-and-effectiveness-of-existing-front-of-pack-food-labelling-policies-in-the-who-european-region-2018.
- European Food Information Council. Global update on nutrition labelling. 2016. [Cited 28 March 2018]. Available from: http://www.eufic.org/images/uploads/files/ExecutiveSummary.pdf.
- Koen N, Wentzel-Viljoen E, Blaauw R. The development of a single health-endorsement logo for South Africa. Public Health Nutr. 2018;21(8):1444–1454. doi:10.1017/S1368980018000034
- Koen N, Wentzel-Viljoen E, Blaauw R. Price rather than nutrition information the main influencer of consumer food purchasing behaviour in South Africa: A qualitative study. Int J Consum Stud. 2018;42(4):409–418. doi:10.1111/ijcs.12434.
- Irvine F. Functionally low-literate consumers’ use of food labels in the rural area of Valspan in the Northern Cape of South Africa [MSc Dissertation]. North-West University. 2014. [cited 26 March 2019]. Available from: https://dspace.nwu.ac.za/bitstream/handle/10394/13336/Irvine_F.pdf?sequenc.
- Grunert KG, Fernandez-Celemin L, Wills JM, et al. Use and understanding of nutrition information on food labels in six European countries. Z Gesundh Wiss. 2010;18(3):261–277. doi:10.1007/s10389-009-0307-0.
- Francis D, Webster E. Poverty and inequality in South Africa: critical reflections. Dev South Afr. 2019;36:788–802. doi:10.1080/0376835X.2019.1666703.
- Koen N, Blaauw R, Wentzel-Viljoen E. Food and nutrition labelling: the past, present and the way forward. South Afr J Clin Nutr. 2016;29(1):13–21. doi:10.1080/16070658.2016.1215876.
- Koen N, Wentzel-Viljoen E, Nel D, et al. Consumer knowledge and use of food and nutrition labelling in South Africa: a cross-sectional descriptive study. Int J Consum Stud. 2018;42(3):335–346. doi:10.1111/ijcs.12422.
- Daniel WW. Biostatistics: A foundation for analysis in the health sciences. 7th ed New York: John Wiley & Sons; 1999.
- Julia C, Hercberg S. Development of a new front-of-pack nutrition label in France: the five-colour Nutri-Score. PANORAMA. 2017;3(4):712–725. [cited 10 April 2020]. Available from: https://apps.who.int/iris/handle/10665/325207.
- Hutton T, Gresse A. South African consumer perception of five front-of-pack label formats. J Consum Sci. 2020;Special Edition Food and nutrition challenges in Southern Africa(5):126–139.
- Orquin JL. A Brunswik lens model of consumer health judgments of packaged foods. J Consum Behav. 2014;13(4):270–281. doi:10.1002/cb.1465.
- McHiza ZJ, Steyn NP, Hill J, et al. A review of dietary surveys in the adult South African population from 2000 to 2015. Nutrients. 2015;7(9):8227–8250. doi:10.3390/nu7095389.
- Ducrot P, Méjean C, Julia C, et al. Effectiveness of front-of-pack nutrition labels in French adults: results from the NutriNet-Sante cohort study. PLOS one. 2015;10(10):e0140898. doi:10.1371/journal.pone.0140898.
- Hodgkins CE, Raats MM, Fife-Schaw C, et al. Guiding healthier food choice: systematic comparison of four front-of-pack labelling systems and their effect on judgements of product healthiness. Br J Nutr. 2015;59(3):806–817. doi:10.1016/j.appet.2012.08.014.
- Egnell M, Talati Z, Hercberg S, et al. Objective understanding of front-of-package nutrition labels: An international comparative experimental study across 12 countries. Nutrients. 2018;10(10):1542. doi:10.3390/nu10101542.
- Food and Drink Federation. Food and drink labelling: A tool to encourage healthier eating. 2014. [cited 4 June 2018]. Available from: http://www.foodlabel.org.uk/corporate_pubs/Food_Drink_Labelling_toolkit.pdf.
- United Kingdom Department of Health. Guide to creating a front of pack (FoP) nutrition label for pre-packed products sold through retail outlets. 2013. [cited 10 April 2020]. Available from: https://www.food.gov.uk/sites/default/files/media/document/fop-guidance_0.pdf.
- Wąsowicz G, Styśko-Kunkowska M, Grunert KG. The meaning of colours in nutrition labelling in the context of expert and consumer criteria of evaluating food product healthfulness. J Health Psychol. 2015;20(6):907–920. doi:10.1177/1359105315580251.
- Cabrera M, Machin L, Arrua A, et al. Nutrition warnings as front-of-pack labels: influence of design features on healthfulness perception and attentional capture. Public Health Nutr. 2017;20(18):3360–3371. doi:10.1017/S136898001700249X.
- United States Department of Commerce’s International Trade Administration. Chile-labeling/marking requirements. 2019. [cited 10 April 2020]. Available from: https://www.trade.gov/knowledge -product/chile-labeling-marking-requirements.
- Daily K. Latin Square design. In: Allen M, editor. The SAGE encyclopaedia of communication research methods. Thousand Oaks: SAGE Publications; 2017. p. 847–849. [cited 10 April 2020]. Available from: https://dx.doi.org/10.4135/9781483381411.n291.
- Talati Z, Egnell M, Hercberg S, et al. Consumers’ perceptions of five front-of-package nutrition labels: An experimental study across 12 countries. Nutrients. 2019;11(8):e1934. doi:10.3390/nu11081934.
- Ducrot P, Méjean C, Julia C, et al. Objective understanding of front-of-package nutrition labels among nutritionally at-risk individuals. Nutrients. 2015;7(8):7106–7125. doi:10.3390/nu7085325.
- Arrúa A, Machín L, Curutchet MR, et al. Warnings as a directive front-of-pack nutrition labelling scheme: Comparison with the Guideline Daily Amount and traffic-light systems. Public Health Nutr. 2017;20(13):2308–2317. doi:10.1017/S1368980017000866.
- Ducrot P, Julia C, Mejean C, et al. Impact of different front-of-pack nutrition labels on consumer purchasing intentions: A randomized controlled trial. Am J Prev Med. 2016;50(5):627–636. doi:10.1016/j.amepre.2015.10.020.
- Julia C, Blanchet O, Méjean C, et al. Impact of the front-of-pack 5-colour nutrition label (5-CNL) on the nutritional quality of purchases: an experimental study. Int J Behav Nutr Phys Act. 2016;13(1):101. doi:10.1186/s12966-016-0416-4.
- Egnell M, Kesse-Guyot E, Galan P, et al. Impact of front-of-pack nutrition labels on portion size selection: an experimental study in a French cohort. Nutrients. 2018;10(9):e1268. doi:10.3390/nu10091268.
- Alonso-Dos-Santos M, Quilodrán Ulloa R, Salgado Quintana Á, et al. Nutrition labeling schemes and the time and effort of consumer processing. Sustainability. 2019;11(4):1079. doi:10.3390/su11041079.
- Ares G, Aschemann-Witzel J, Curutchet MR, et al. Nutritional warnings and product substitution or abandonment: policy implications derived from a repeated purchase simulation. Food Qual. Prefer. 2018;65:40–48. doi:10.1016/j.foodqual.2017.12.001.
- Rohr M, Kamm F, Koenigstorfer J, et al. The color red supports avoidance reactions to unhealthy food. Exp Psychol. 2015;62:335–45. doi:10.1027/1618-3169/a000299.