
Abstract
Objective:
A survey was undertaken to evaluate and compare dietary intakes of first- and third-year female dietetics students.
Design:
This was a cross-sectional survey.
Setting:
The University of Pretoria (UP) was the site of the survey.
Population:
The study encompassed first- (2012–2015) and third- (2012–2017) year female dietetics students (N = 368).
Outcome:
Dietary intake data from multiple-day weighed food records were analysed on nutrient, food group and meal and snacking pattern levels.
Results:
Recorded energy intakes of participants (n = 105 first years, n = 166 third years; response rate: 73.6%) were below Estimated Energy Requirements. Across year groups, intakes exceeded and fell below the Acceptable Macronutrient Distribution Range for fat and carbohydrates respectively; however, third years consumed cereals, grains and starchy vegetables more often. Over 50% of first and third years exceeded Estimated Average Requirements of respectively 3 and 6 of 10 tested micronutrients. Third years recorded higher (all p < 0.001) intakes of protein, magnesium, calcium, zinc and vitamin A than first years. Similarly, their Nutrient Adequacy Ratios were higher (all p < 0.001) for magnesium, calcium and vitamins A, B6 and B12. Average Mean Adequacy Ratios were 70% (first years) and 77% (third years). The year groups differed in terms of food group intake. The number of daily eating occasions decreased over weekends for first and third year students, yet intakes of energy (p < 0.05) and fat (p < 0.001) were higher over weekends.
Conclusions:
Amidst likely under-recording and/or under-eating, UP female dietetics students’ intakes of some micronutrients may be low. Recorded intakes of third years exceeded those of first years. Recorded nutrient intake improved from the first to the third year of the study in dietetics students.
Introduction
There has been an increase in non-communicable diseases (NCDs) worldwide,Citation1 where they are one of the leading causes of death.Citation2 Chronic diseases, traditionally associated with older adults and the elderly, are presenting at an earlier age.Citation3 In South Africa, the general population does not meet dietary recommendations, largely due to a lack of dietary diversity.Citation4
Students in post-secondary education make up a large number of the adult population, and have been found to be a group at risk of NCDs.Citation5 University students tend to consume unhealthy diets. This has been found in international studies,Citation6,Citation7 in the African settingCitation8,Citation9 and also in South Africa.Citation10,Citation11 Eating habits at university can track into later life and may hence be part of an increased risk of developing NCDs.Citation10–13 Poor intakes of fruit, vegetables and dairy have been reported for most students together with high intakes of fats and sweets/sugar.Citation10,Citation11 Poor diets of university students may, additionally, be associated with poor mental healthCitation14 and academic performance.Citation15
Students studying to be healthcare professionals, including dietetics students, can have an impact on the dietary intake and lifestyles of patients and clients when they have graduated and practise as healthcare professionals.Citation10 The professionals’ own dietary intakes are important, because if they are seen to be making healthy food choices their own risk of developing NCDs will decrease and the patient or client may be more inclined to eat a healthier diet,Citation16 thus decreasing their risk for NCDs too. Dietary intake has also been reported to be influenced by nutrition knowledge and improves as students’ studies progress.Citation17,Citation18 Informed by the work of Van der Kruk,Citation17 the researchers hypothesised that diets of dietetics students change as they become more senior and their nutrition knowledge increases.
The aim of this study was to evaluate and compare dietary intakes of first- and third-year female dietetics students at the University of Pretoria (UP). Dietary intake was conceptualised in terms of energy and nutrient intakes, intakes of food groups, and meal and snacking patterns.
Methods
Study design, setting and participants
A cross-sectional study of female students enrolled for the four-year degree in dietetics at the UP was conducted. The study commenced in 2012 and continued for four years for the first-year students and for six years in the third-year group. A total of 368 students were registered in two designated core modules in the specified periods. All these students were invited to participate. For the third-year students, the food recording was an academic activity, but they could volunteer on a confidential basis and without the knowledge of the module lecturer to make their records available for the study. Ethical clearance was obtained from the UP Faculty of Health Sciences Research Ethics Committee in 2011 (S196C/2011) with an amendment in 2018 (2/2018).
Dietary assessment
Data were collected using non-consecutive, multiple-day weighed food records (WFR). Since the target group was dietetics students, the use of WFR records was deemed appropriate as these students could be assumed to possess the necessary nutrition literacy, numeracy and motivation. They would also benefit by gaining food description and quantification skills. Per participant, the recording period included one to two weekdays and one weekend day in the period March to May every year. This allowed first-year students to adjust to university life and suited the third-year students’ semester programme. The individuals who did not pass the previous year were excluded from the study as they had already taken part in the study. Apart from food description, the time and date of food intake had to be indicated in a study-specific recording booklet. Students who did not own a food scale were provided with a digital A5-sized scale for unobtrusive and immediate weighing of food. Detailed written instructions and standardised training – including a demonstration of using the scale’s tare function to correct, for example, for plate weight and waste – were provided. One experienced dietitian entered all data into FoodFinder3Citation19 using consistent coding rules over time, which did not contain fortified foods. Based on the time of food consumption, each intake was assigned to one of seven predefined eating occasions: early morning (before 06:00), breakfast (06:00–10:00), in-between (10:00–12:00), lunch (12:00–15:00), afternoon (15:00–17:00), supper (17:00–21:00) and late-night (after 21:00).
Data analysis
The WFR data were exported via Microsoft Excel (Microsoft Corp, Redmond, WA, USA) to IBM SPSS Statistics 25 (IBM Corp, Armonk, NY, USA).Citation20 Energy and nutrient intakes were evaluated by comparing the mean total daily intakes across the recording days to relevant Dietary Reference Intakes (DRI),Citation21 assuming an active physical activity level (PAL) of 1.6, as dietetics students had to move between two campuses and walk large distances on each campus between classes. In most cases the DRI referred to the Estimated Average Requirement (EAR). Iron was compared with the Recommended Dietary Allowance (RDA), as intakes should not be assessed using the EAR cut-point method in women of childbearing age.Citation22 Nutrient Adequacy Ratios (NAR) were calculated by dividing each participant’s mean daily intake of 10 selected nutrients (calcium, folate, iron, magnesium, riboflavin, vitamins A, B6, B12 and C and zinc) across the recording days by the relevant Recommended Dietary Allowance, expressed as a percentage. Mean Adequacy Ratio (MAR) was calculated by dividing the sum of the NAR (capped at 100%) by 10 (number of nutrients investigated) and multiplied by 100.Citation23,Citation24
Ten food groups were extracted from the codes integral to FoodFinder3, with the following adjustments: legumes and legume products were grouped with nuts and seeds; all eggs, meat and meat products, fish and seafood were grouped together into protein-rich foods; and fruit juices were added to beverages. The other food groups consisted of cereals, grains and starchy vegetables; milk and milk products; fruit; all other non-starchy vegetables; fats, oils; and sugar, sweets and syrups. Meal and snacking patterns were operationalised in terms of the time of day an eating occasion occurred per day,Citation25 where meals referred to breakfast, lunch and supper, and snacks referred to intakes in all other periods. In addition, weekday compared with weekend day intakes formed part of the description of dietary patterns. Following tests for normality (Kolmogorov–Smirnov test), Mann–Whitney U, Pearson’s chi-square and Fisher’s exact tests were performed to compare the first- and third-year groups’ intakes. Wilcoxon 2-sided signed rank test was done to compare nutrient and food group intakes during the week with intakes over the weekend.
Results
Study participants
In total 283 students consented to participate in the study. Four participants were excluded due to incomplete WFRs and eight male records were excluded due to the small number of participants, resulting in a final sample size of 271 (final response rate: 73.6%, including 105 first-year students and 166 third-year students). From the final sample, 38 first-year students and one third-year student recorded only two days’ intake. One weekday record was missing from both year groups. Two and nine weekend days were missing from the first- and third-year groups respectively.
Energy and nutrient intakes
Intakes were not normally distributed and therefore central tendency and dispersion are reported as medians and interquartile ranges (IQR).
From it is evident that the reported median energy intake of first- and third-year students was below the EER (66% and 69% of the EER of first- and third-year students respectively). For both year groups the NAR was lowest (about 50%) for folate, and over 80% for zinc and vitamins B6 and B12. Third-year students recorded higher (all p < 0.001) intakes of protein, magnesium, calcium, zinc and vitamin A than first-year students. The mean MAR for the first-year students was 70% and 77% for the third-year students.
Table 1: Dietary intakes and NAR of first- (n = 105) and third- (n = 166) year students
According to most students fell within the Acceptable Macronutrient Distribution Range (AMDR)Citation21 for protein. Just more than a third of the first-year students and just under half of the third-year students exceeded the AMDR for fat. Conversely, more third-year students fell below the AMDR for carbohydrates compared with first-year students.
Table 2: Number of first0 (n = 105) and third0 (n = 166) year students within and outside acceptable macronutrient distribution range
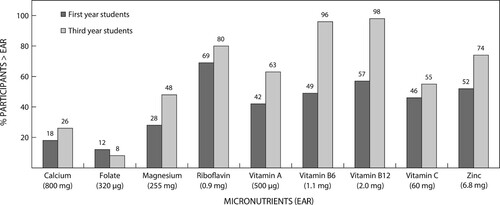
shows the proportion of first- and third-year students who exceeded the EAR for the selected micronutrients. It is evident that, overall, a higher percentage of third-year students’ intakes exceeded the EAR compared with first-year students, yet for calcium, magnesium and folate less than 50% of both year groups’ intakes reached the EAR.
Figure 1: Percentage of first- (n = 105) and third- (n = 166) year students above the EAR for selected micronutrients.
The total median iron intakes were about 10 mg for both first- and third-year students, which is roughly 55% of the age and sex-appropriate RDA of 18 mg.
Food group intakes
shows the median total number of times per day a food group was recorded by the first- and third-year students. Only in respect of the food group ‘sugar, sweets and syrups’ did the year groups not differ significantly from another. For all the other food groups, third-year students’ median total intakes were significantly (at least p < 0.05 for all) higher than those of first-year students.
Table 3: Total number of times food group intake was recorded per day by first- (n = 105) and third- (n = 166) year students
Cereals, grains and starchy vegetables were consumed most often in both year groups, followed by milk and milk products and then protein-rich foods. Fruit and vegetable intakes combined were consumed a median of 1.7 times per day by first-year students and a median of 3.5 by the third-year students.
Meal and snack patterns
shows that on all six eating occasions from breakfast (06:00–10:00) onwards – on week and weekend days – a large percentage of all students recorded food consumption. Throughout, more third- than first-year students recorded intakes (exception: weekday early morning). In nine of the 14 comparisons this difference was statistically significant (at least p < 0.05). Furthermore, per year group, fewer students recorded intakes per eating occasion on the weekend day compared with the first weekday (exception: lunch for first-year students).
Table 4: Number of first- and third-year students recording intakes per eating occasion and day of week
shows that, for all participants, intakes differed significantly for energy and magnesium (p < 0.05) and total fat (p < 0.001) on weekdays compared with weekend days. Specifically, in relation to fat intake, further analyses showed this significant difference referred to saturated, mono-unsaturated, poly-unsaturated and trans fatty acids.
Table 5: Energy and nutrient intakes on weekdays compared with weekend days for the whole group (n = 253)
Discussion
Dietetics students at the UP recorded low total intakes on multiple-day WFR. Differences between first- and third-year students in terms of intakes of nutrients, food groups and dietary patterns were noted.
Energy intakes below recommendations have been noted in previous studies involving students.Citation26 Whilst this can be a true reflection of actual intake on the recording days, it is unlikely to be reflective of usual intakes. Under-eating to simplify the recording process,Citation18 under-reporting as a general trait of females and particularly of weight-aware young females,Citation27 and the assumption of an ‘active’ PAL could explain the finding. The use of anthropometric data or other biomarkers of energy intake (e.g. doubly labelled water)Citation28 would have aided in checking the credibility of recorded intake. As it is not known whether the potential under-recording was of a general nature (i.e. affecting all foods similarly) or of a differential nature (selective under-recording of certain foods or food groups), firm conclusions regarding the (in)adequacy of nutrient intake cannot be made. This is further complicated by uncertainty regarding the number of days necessary to capture usual intake.Citation21 Nonetheless, the three days of intake are generally considered the minimum.Citation21
The energy contribution from the macronutrients is important in evaluating the dietary risk for NCDs.Citation29 Many students (particularly the third-year students) consumed lower carbohydrate and fat intakes. Similar findings have been reported in other studies amongst students.Citation11,Citation30 At the time of data collection a ‘Banting’ style of eating was popular in South Africa and may have also influenced the students’ eating habits to consume lower carbohydrates. The lower percentage contribution of energy from macronutrients indicated, however, a similar proportion of energy from fat in both year groups with a lower energy contribution from the carbohydrates in the third-year group. Third-year students consumed cereals, grains and starchy vegetables more often per day compared with the first-year students, necessitating cautious interpretation.
Micronutrients are not only important in the prevention of nutritional deficiencies, but are also associated with health promotion and the prevention of NCDs.Citation31 Nutritional gaps found in the diets of South Africans include calcium, iron, magnesium, zinc, riboflavin, vitamin B6, vitamin C, folate and vitamin A.Citation32,Citation33 On the one hand, despite low energy intakes, the intakes of many micronutrients exceeded the EAR, but, on the other hand, the large proportion of students with median intakes over the recording days below the EAR for calcium, magnesium and folate may put these individuals at risk of micronutrient deficiencies. This is noteworthy when looking at NCD risk, particularly because this was accompanied by few mentions of dairy, fruit and vegetable consumption. Micronutrient intakes changed over time where intakes improved as the students’ studies progressed. The challenges associated with evaluating iron intake are well known,Citation21 yet the importance thereof in this target group is undisputed.Citation34 Similar to this study, previous researchCitation17,Citation30 reported intakes below recommendations among university students. It is, however, important to note that food and beverage intakes were the focus of the study. Whilst supplement intake will influence the total intake of micronutrients, South African research showed that this was not a common practice among the dietetics students studied.Citation35
The finding of better micronutrient intakes among third-year students, compared with students in the first year of studying dietetics, is consistent with a study in Dutch dietetics students.Citation17 This could be related to improved dietary choices linked to increased nutrition knowledge over time in dietetics students,Citation17 even though Bernado et al.Citation6 found that students studying nutrition did not consume healthier diets when compared with non-nutrition students. Higher motivation to complete an assignment may also have played a role among the third-year students in this study.
A locally relevant evaluation of food group intake, for example the South African Food Based Dietary Guidelines (SAFBDG), is subjective, because neither the SAFBDG nor the researchers’ assessment on food group-level refer to portions or exact quantities consumed. In both year groups, fruit and vegetable intakes combined were less than the common guideline of five times per day, which was also the case in other South African studies where fruit, vegetable and dairy intakes were low in most of the students.Citation10,Citation11 The SAFBDG recommends a daily intake of ‘plenty’ of fruit and vegetables, making a quantitative comparison challenging. Furthermore, the food groupings in the two approaches are not a perfect match. Evaluating food-based dietary data remains a challenge.Citation36 Stroebele-Benschop et al.Citation37 found that most students did not meet the recommendations for most food groups. Based purely on mentions in the food records, we cannot conclude on this. The comparison of first- with third-year students did, however, again highlight changes over time.
Meal and snacking patterns in this study investigated the distribution of food intake within a day (eating occasions) and across days (weekday vs. weekend intakes). Frequent eating was common in this investigation, and significantly more so among the third-year students. Studies involving university students often highlight missing breakfast and frequent snacking of mostly unhealthy foods.Citation38,Citation39 A large proportion of the participants in both the first- and third-year groups reported food intake in the period 06:00–10:00. Gresse et al., using a different dietary assessment methodology, reported that about half the South African Health Care Sciences students they studied did not usually consume breakfast.Citation40 Over weekends dietary intakes changed, which was consistent with the findings by Viljoen et al.Citation10,Citation11 Higher energy – particularly higher fat – intakes were recorded as in other South African studies.Citation10,Citation11 The difference in nutrient intakes between the first- and third-year students may well also have been evident as a difference between weekdays and weekend days, yet this was not statistically analysed.
Limitations, strengths and recommendations
The universal limitations of dietary assessmentsCitation41 and especially of WFR apply to the study. The study assessed only food and beverage intake. Supplement use may have considerably increased the total micronutrient intake.Citation42 The risk of deficiency and adherence to macronutrient distribution ranges should be interpreted with caution, as inter- and intra-individual variance was not adjusted for.Citation43 The comprehensive coverage of many aspects of dietary intake (nutrient, food group and pattern level) and the use of three non-consecutive days of food weighing in this target group are a first in South Africa. Future studies should build on knowledge gained, forming the basis of nutrition-focused interventions targeted specifically at dietetics students. Assessing the credibility of recording, for example by applying the Goldberg cut-off,Citation44 based on more detailed anthropometric measurements, and the comparative advantages of alternative dietary assessments of usual intake, as well as a change in food awareness and knowledge of dietetics students following WFR are needed. This will clarify the role of WFR in this target group as future dietetics nutrition professionals.
Conclusion
Female dietetics students, particularly the first-year students, recorded low intakes. Consumption of a ‘lower-carbohydrate, higher-fat’ type-diet was seen, particularly by the third-year students; however, they consumed cereals, grains and starchy vegetables more often, making interpretation challenging. Eating occasions were frequent among first- and third-year students. The number of eating occasions decreased over weekends, yet intakes of energy, macronutrients and some micronutrients increased. The NAR and MAR point to improved nutrient recording and intakes from the first to the third year of study in dietetics students, showing improved intakes as studies progressed.
Acknowledgements
The students are thanked for their participation in the study.
Disclosure statement
No potential conflict of interest was reported by the authors.
References
- World Health Organization. Noncommunicable diseases [Internet]. 2018 [cited 2018 Aug 27]. Available from: https://www.who.int/news-room/factsheets/detail/noncommunicable-diseases.
- World Health Organization. Global health observatory: NCD mortality and morbidity [Internet]. 2015 [cited 2018 Jan 22]. https://www.who.int/gho/ncd/mortality_morbidity/en/.
- National Research Council and Institute of Medicine. U.S. health in international perspective: shorter lives, poorer health. Washington: The National Academies Press; 2013.
- Labadarios D, Steyn NP, Nel J. How diverse is the diet of adult South Africans? Nutr J. 2011;10(33):1–11. doi:10.1186/1475-2891-10-33.
- Von Bothmer M, Fridlund B. Gender differences in health habits and in motivation for a healthy lifestyle among Swedish university students. 2005;7(2):107–18. doi:10.1111/j.1442-2018.2005.00227.x.
- Bernado G, Jomori M, Fernandes A, et al. Food intake of university students. Rev Nutr. 2017;30(6). doi:10.1590/1678-98652017000600016.
- Irwin C, Desbrow B, Khalesi S, et al. Challenges following a personalised diet adhering to dietary guidelines in a sample of Australian university students. Nutr Health. 2019: 1–10. doi:10.1177/0260106019841247.
- Takomana G, Kalimbira A. Weight gain, physical activity and dietary changes during the seven months of first-year university life in Malawi. S Afr J Clin Nutr. 2012;25(3):132–9. doi:10.1080/16070658.2012.11734417.
- Ukegbu PO, Uwaegbute AC, Echendu CA, et al. Obesity and associated factors in young adults attending tertiary institutions in south-eastern Nigeria. S Afr J Clin Nutr. 2017;30(2):43–8. doi:10.1080/16070658.2016.1259032.
- Viljoen AT, van der Spuy E, du Rand GE. Food consumption, lifestyle patterns, and body mass index of a group of white South African students. Int J Consum Stud. 2018;42(5):533–46.
- Van den Berg V, Abera B, Nel M, et al. Nutritional status of undergraduate healthcare students at the University of the Free State. S Afr Fam Pr. 2013;55(5):445–52. doi:10.1080/20786204.2013.10874394.
- Yahia N, Wang D, Rapley M, et al. Assessment of weight status, dietary habits and beliefs, physical activity, and nutritional knowledge among university students. Perspect Public Health. 2016;136(4):231–44. doi:10.1177/1757913915609945.
- Ranga L, Venter I. The association between dietary fat knowledge and consumption of foods rich in fat among black first-year students in a South African university self-catering residences. JCS. 2017;2:95–112.
- Mochimasu KD, Miyatake N, Hase A. A pilot study of the relationship between diet and mental health in female university students enrolled in a training course for registered dietitians. Environ Health Prev Med. 2016;21(5):345–9. doi:10.1007/s12199-016-0535-1.
- Whatnall MC, Burrows TL, Hutchesson MJ. Higher diet quality in university students is associated with higher academic achievement: a cross-sectional study. J Hum Nutr Diet. 2019;5. doi:10.1111/jhn.12632.
- Kolodinsky J, Harvey-Berino JR, Berlin L, et al. Knowledge of current dietary guidelines and food choice by college students: better eaters have higher knowledge of dietary guidance. J Am Diet Assoc. 2007;107(8):1409–13. doi:10.1016/j.jada.2007.05.016.
- Van Der Kruk JJ, Jager-Wittenaar H, Nieweg RMB, et al. Do Dutch nutrition and dietetics students meet nutritional requirements during education? Public Health Nutr. 2014;17(6):1237–44. doi:10.1017/S1368980013001237.
- Poínhos R, Alves D, Vieira E, et al. Eating behaviour among undergraduate students. Comparing nutrition students with other courses. Appetite. 2015;84:28–33. doi:10.1016/j.appet.2014.09.011.
- Medical Research Council. Foodfinder3 version 1.1.3. Parrow Valley: Medical Research Council; 2002.
- SPSS. SPSS 25.0 for windows. Chicago: SPSS Inc; 2017.
- Institute of Medicine. Dietary reference intakes. Washington: National Academy Press; 2000; 1–285 p.
- American Dietetics Association. Practice paper of the American dietetic association: using the dietary reference intakes. J Am Diet Assoc. 2011;111(5):762–70. doi:10.1016/j.jada.2011.03.022.
- INDDEX PROJECT. Data4Diets: building blocks for diet-related food security analysis. Boston; 2018; https://inddex.nutrition.tufts.edu/data4diets.
- Dubois L, Girard M, Bergeron N. The choice of a diet quality indicator to evaluate the nutritional health of populations. Public Health Nutr. 2000;3(3):357–65. doi:10.1017/S1368980000000409.
- Leech RM, Worsley A, Timperio A, et al. Understanding meal patterns: definitions, methodology and impact on nutrient intake and diet quality. Nutr Res Rev. 2015;28(1):1–21. doi:10.1017/S0954422414000262.
- Kowalkowska J, Slowinska MA, Slowinski D, et al. Comparison of a full food-frequency questionnaire with the three-day unweighted food records in young Polish adult women: implications for dietary assessment. Nutrients. 2013;5(7):2747–76. doi:10.3390/nu5072747.
- Kagawa M, Hills A. Preoccupation with body weight and under-reporting of energy intake in female Japanese nutrition students. Nutrients. 2020;12(830):1–13. doi:10.3390/nu12030830.
- Nieman D. Nutritional assessment. 7th ed New York: McGraw Hill Higher Education; 2019.
- Souza Silveira BK, Silva Oliveira TM, Andrade PA, et al. Dietary pattern and macronutrients profile on the variation of inflammatory biomarkers: scientific update. Cardiol Res Pr. 2018;2018:1–18. doi:10.1155/2018/4762575.
- Fredriksson E, Brekke HK, Ellegård L. Dietary intake in Swedish medical students during 2007–2012. Scand J Public Health. 2016;44(1):77–83. doi:10.1177/1403494815611767.
- Prasad K. Micronutrients in health and disease. 2nd ed. Boca Raton: CRC Press; 2019.
- Mchiza ZJ, Steyn NP, Hill I, et al. A review of dietary surveys in the adult South African population from 2000 to 2015. Nutrients. 2015;7(9):8227–50. doi:10.3390/nu7095389.
- Vorster HH, Oosthuizen W, Jerling JC, et al. The nutritional status of South Africans: a review of the literature. Durban: Health Systems Trust; 1997.
- Mahan LK, Escott-Stump S, Raymond JL. Food and the nutrition care process. 13th ed. Missouri: Elsevier Saunders; 2012.
- Pillay L, Pillay K. Dietary supplement use among dietetics students at the University of KwaZulu-Natal. Heal SA Gesondheid. 2015;24(0):1–6. doi:10.4102/hsag.v24i0.1298.
- Faber M, Wenhold FAM, Macintyre UE, et al. Presentation and interpretation of food intake data: factors affecting comparability across studies. Nutrition. 2013;29(11–12):1286–92. doi:10.1016/j.nut.2013.03.016.
- Stroebele-Benschop N, Dieze A, Hilzendegen C. Students’ adherence to dietary recommendations and their food consumption habits. Nutr Health. 2018: 1–7. doi:10.1177/0260106018772946.
- Gan W, Mohd N, Zalilah M, et al. Differences in eating behaviours, dietary intake and body weight status between male and female Malaysian university students. Malays J Nutr. 2011;17(2):213–28.
- Sira N, Pawlak R. Prevalence of overweight and obesity, and dieting attitudes among Caucasian and African American college students in eastern north Carolina: a cross-sectional survey. Nutr Res Pr. 2010;4(1):36–42. doi:10.4162/nrp.2010.4.1.36.
- Gresse A, Steenkamp L. Eating, drinking and physical activity in faculty of health science students compared to other students at a South African university. S Afr J Clin Nutr. 2015;28(4):154–9. doi:10.1080/16070658.2015.11734555.
- Biro G, Hulshof KFAM, Ovesen L, et al. Selection of methodology to assess food intake. Eur J Clin Nutr. 2002;56(2):S25–S32. doi:10.1038/sj.ejcn.1601426.
- Wiltgren AR, Booth AO, Kaur G, et al. Micronutrient supplement use and diet quality in university students. Nutrients. 2015;7(2):1094–107. doi:10.3390/nu7021094.
- Piernas C, Miles DR, Deming DM, et al. Estimating usual intakes mainly affects the micronutrient distribution among infants, toddlers and pre-schoolers from the 2012 Mexican national health and nutrition survey. Public Health Nutr. 2016;19(6):1017–26. doi:10.1017/S1368980015002311.
- Black AE. Critical evaluation of energy intake using the Goldberg cut-off for energy intake: basal metabolic rate. A practical guide to its calculation, use and limitations. Int J Obes. 2000;24:1119–30. doi:10.1038/sj.ijo.0801376.