
Abstract
Background:
This cross-sectional study examined the relationship between socioeconomic status (SES), dietary knowledge and patterns, and physical activity level with body mass index of urban South African young women.
Methods:
Data were collected on 160 black South African women (aged 18–24 years) and included household SES, food frequency and nutritional knowledge questionnaires, self-reported physical activity and anthropometry. To assess household SES index, 1–7 assets were categorised as a lower household SES and those with 8–13 assets as a higher household SES. Structural equation modelling analysis was used to determine the direct, indirect and total effects on adiposity of household SES, age, education, nutrition knowledge score, dietary patterns and physical activity.
Results:
The prevalence of overweight and obesity was similar among women from high SES households compared with their low SES peers (48.4 vs. 44.8%). More than half (53%) of the women had poor dietary knowledge. Women from low SES households spent more time in moderate to vigorous intensity exercise (MVPA) compared with their high SES counterparts. Two distinct dietary patterns (Western and mixed) were identified. SEM results show that a unit increase in adherence to the ‘Mixed’ dietary pattern compared with ‘Western’ was associated with a 0.81 lower BMI kg/m2 (95% CI −1.54; −0.08), while ≥ 150 minutes’ MVPA per week was associated with a 1.94 lower BMI kg/m2 (95% CI −3.48; −0.41).
Conclusion:
The associations of SES, diet and physical activity on BMI must be taken into account when developing and designing interventions that target improvement in young women’s health.
Introduction
The obesity epidemic continues to rise rapidly in low- and middle-income countries, particularly in Africa, despite the high prevalence of food insecurity and undernutrition.Citation1,Citation2 Currently, South Africa has the highest obesity prevalence in sub-Saharan Africa (SSA),Citation3 with the latest national survey reporting a 68% prevalence of overweight and obesity in adult women, and 40% in young women between 15 and 24 years.Citation4 Using data from the Birth to Twenty Plus cohort in Soweto, Nyati et al.Citation5 also report this rise in combined prevalence from 11 years of age, reaching 46.5% in the 21+ years of age in urban young women. Alongside this, poor nutritional knowledge has also been reported in young South African women.Citation6
The role of a healthy diet and regular physical activity (PA) in the prevention of obesity and associated non-communicable diseases (NCDs) is well documented.Citation7 Research has shown that lifestyle behaviours, including diet, PA, smoking and alcohol intake, during adolescence are often maintained into adulthood, influencing the risk of obesity and NCDs.Citation8 Research data also show that healthier diets are associated with higher socioeconomic status (SES) levels, while there are data to support poorer diets because of choice-constrained conditions, along a continuum representing factors over which the individual has little or no control, to those for which they have greater agency.Citation9,Citation10 Since 1994, the consumption of meat, fats and oils, sauces, dressings and condiments, sweet and savoury snacks and soft drinks has increased in South Africa by more than 30%.Citation11 High consumption of these foods has been associated with weight gain, higher obesity prevalence and other NCDs in adults and children.Citation11
Research has well described upstream factors such as household SES, mass media exposure and urbanisation as important determinants of shifting dietary habits and physical inactivity that are associated with an increased risk of NCDs and premature mortality.Citation12,Citation13 This is exacerbated in African countries that are rapidly urbanising with increased access to energy-dense, low-quality foods, alongside persisting food insecurity.Citation14 Understanding the complexity of the interaction between household SES and health behaviours is necessary to inform public health intervention development to curb the rising obesity prevalence in African women in poor urban settings. The aim of this study was to examine the relationship between household SES, dietary knowledge and patterns, and physical activity (PA) level, with adiposity (body mass index [BMI]) of urban South African young women.
Materials and methods
Study sample and design
This cross-sectional study was conducted at the South African Medical Research Council (SAMRC)/Wits Developmental Pathways for Health Research Unit (DPHRU) at the Chris Hani Baragwanath Academic Hospital (CHBAH) in Soweto. CHBAH is one of the largest hospitals worldwide and a public tertiary care institution that serves the low-income community of greater Soweto in south-western Johannesburg, South Africa. Soweto is one of the most well-known historically disadvantaged townships in South Africa known for its established communities, and its socioeconomic and cultural variations.Citation15
In 2019, as part of a larger package of work by the Global Diet and Activity Research (GDAR) Network, explained in more detail elsewhere,Citation16 we recruited a convenient sample of 160 black young women participants between the ages of 18–24 years from the Soweto household enumeration study,Citation17 which included individuals and household data from over 2 000 households in Soweto. Through this database, research assistants contacted prospective participants using their provided contact details, inviting them to participate. All participants from the Soweto household enumeration study had given consent to be contacted for any future studies. The database also enabled the identification and recruitment of participants from low- and high-income households to ensure socioeconomic diversity.Citation16 All participants gave written informed consent prior to taking part in the study. The Human Research Ethics Committee (HREC) of the Witwatersrand University, under ethics numbers M171137 and M190523, granted ethical approval.
Anthropometry
All measurements were performed with participants in light clothing and without shoes. The participant’s height (in mm) was measured using a Seca 213 portable stadiometer (Seca Deutschland, Hamburg, Germany) and converted to metres (m). Bodyweight was measured to the nearest 0.1 kg using a portable electronic scale. Body mass index (BMI) was calculated as weight in kilograms (kg) divided by height (m)2.
Socioeconomic status
Questionnaires were completed via interview by trained research assistants. To assess the household socioeconomic status (SES), an asset index was determined and comprised the sum of assets out of a possible 13 (electricity, refrigerator, stove, vacuum cleaner, washing machine, digital satellite TV, DVD, car, landline, mobile phone, personal computer, Internet). Young women with 1–7 assets were categorised as having a lower household SES index and those with 8–13 assets as having a higher household index category. This index has been described as a useful method for determining socioeconomic status in this setting.Citation18 All young women were required to report the highest level of education that they had successfully completed, and this was then categorised into some secondary education, completed secondary education and tertiary education.
Dietary assessment
A standardised quantitative food frequency questionnaire (QFFQ), designed for the South African population, was used to collect dietary intake data. The SAMRC developed this tool using results from dietary surveys in both urban and rural areas since 1983.Citation19 The QFFQ comprises 214 food items that represent foods consumed by at least 3% of the population. This tool has been piloted and utilised extensively in Soweto, as described elsewhere.Citation20,Citation21 In order to complete the QFFQ, trained research assistants used high-quality photographs of food items to trigger participants’ memories of all foods and beverages consumed during the previous seven days.Citation20,Citation22 The participants were asked to arrange the cards into three piles: foods eaten in the last seven days, foods eaten occasionally, or foods never eaten, and this was recorded. The QFFQ was then administered and took approximately 40–50 minutes to complete. With food items that were consumed in the past seven days, additional data on the frequency and quantity of consumption was recorded. Portion sizes were estimated using a combination of high-quality two-dimensional drawings of foods, household utensils and three-dimensional food models, which have been described and validated by Steyn et al.Citation22 Estimated portion sizes were converted to grams to allow for calculation of the participant’s average intake of the food items consumed over the previous 7 days. The QFFQ was captured and managed online using REDCap electronic data capture tools hosted at the University of the Witwatersrand.Citation23 Using the South African Food Composition Tables,Citation24 nutrient composition (energy and macronutrients) was calculated from conversion of single food item intakes by the SAMRC.
The nutrition knowledge questionnaire was adapted from previously validated instruments,Citation25 but has not been used in this context previously. Nutritional knowledge was determined using a summative score comprising 4 knowledge components: knowledge of advice from experts, classification of food groups, choosing foods, and diet-related health problems, and was adequate or good when it was ≥ 32 out of the maximum score of 63. Inter-item analysis was used to assess internal consistency (Cronbach’s alpha = 0.80).
Physical activity and sedentary behaviour
The Global Physical Activity Questionnaire (GPAQ), developed for global physical activity surveillance, was completed via interview to ascertain self-reported physical activity.Citation20 Total moderate-to-vigorous intensity physical activity (MVPA) in minutes per week (minutes/week) was calculated by adding occupation, travel-related and leisure-time moderate and vigorous intensity physical activity. MVPA was sufficient if a participant met the World Health Organization’s (WHO) recommendation of ≥ 150 minutes per week.Citation26
Data analysis
Data were analysed for 160 young women with complete data using STATA SE 15.1 (StataCorp, College Station, TX, USA). Descriptive characteristics of the sample are presented as median (interquartile range) and percentages (%) for continuous and categorical variables, respectively. Study characteristics were compared between participants with low household SES index and high household SES index using the Kruskal–Wallis rank test for continuous data and chi-square tests for categorical data. Principal component analysis (PCA) was used to identify dietary patterns. This method groups variables, food items or groups based on the level of correlation with each other to form new linear components that reflect combinations (patterns) of intake in a population. PCA was conducted on the weekly consumption of the food items listed in the QFFQ, which were classified into 49 food groups according to their nutrient composition and usage. These groupings were based on those used and described extensively by Crozier et al.Citation27 PCA was applied using orthogonal (varimax) rotation and the Kaiser–Meyer–Olkin measure of sampling adequacy (0.65), and Bartlett’s test of sphericity (p < 0.001) confirmed PCA to be an appropriate dimension reduction technique to apply in this sample. Eigenvalues, as well as their visual inflections on a scree plot, and the total variance explained (percentages) were used to identify retained patterns (). As described elsewhere, foods or food groups that had factor loading scores ≥ 0.3 on the PCA matrix reflected strong associations with principal components and these were used to name dietary patterns.Citation28
Figure 1: Conceptual framework for the association between household SES, age, education, nutritional knowledge (NKQ), Western dietary pattern (PC1), Mixed dietary pattern (PC2) and MVPA with BMI among young women.
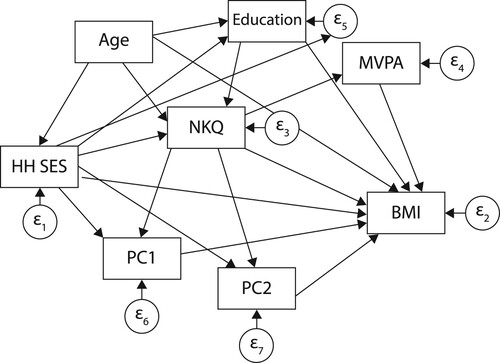
Multivariate linear regression models were computed to assess the association between household SES index, age, education, nutrition knowledge score, Western and mixed dietary patterns, and MVPA as predictors, and BMI as the outcome variable, for the whole group and then stratified by SES group. Collinearity between the variables was checked by calculating the variance inflation factor (VIF), with the highest VIF being recorded at 1.19. A VIF > 10 is considered significant collinearity.
Structural equation modelling (SEM) analysis was used to determine the direct, indirect and total effects of household SES, age, education, nutrition knowledge score, Western and mixed dietary patterns and MVPA on BMI. To evaluate the best fitting model for our data, we reported goodness-of-fit indices including chi-square test, root mean squared error of approximation (RMSEA), Tucker–Lewis index (TLI), coefficient of determination (CD) and standardised root mean squared residual (SRMR). Statistical significance was considered when the p-value was less than or equal to 0.05.
Results
Descriptive statistics of young women living in Soweto
The study included 160 urban black young women with a median age of 21 years. Overall, 46.6% of participants were overweight or obese, with the prevalence being similar among women from high SES households (48.4%) compared with their low SES counterparts (44.8%). More than half (53%) of the women had poor dietary knowledge. In contrast, young women from households with a low SES (range = 163; 840 min/week) spent significantly more time engaging in MVPA compared with their high SES counterparts (range = 105; 540 min/week) ().
Table 1: Descriptive characteristics of young women living in Soweto
Top 10 most frequently consumed foods by young women
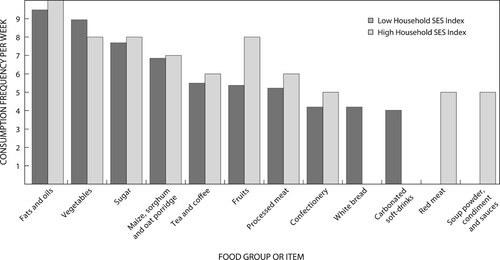
The top 10 most frequently consumed food items data show little variation in consumption frequency between young women from households with high and low SES index in most of the food items consumed but modest differences in intake of fruits and vegetables. Cooking oils, vegetables and sugar were the top three most frequently consumed foods in both low and high SES household groups. However, the data show large differences in consumption of white bread and carbonated soft drinks, which was at least four times per week in young women from households with low SES index compared to zero in young women from households with high SES index, and consumption of red meat and soup powder, condiments and sauces was at least five times per week in young women from households with high SES index compared with zero in young women from households with low SES index ().
Figure 2: Top 10 foods most frequently consumed by young women.
Identification and description of depicted dietary patterns
Two distinct dietary patterns were extracted from the PCA, which together explained 32.9% of the variation in food intake. The first principal component (PC) was characterised by high factor loadings for sugar (0.829), tea and coffee (0.722), cooking fats (0.517), full-fat milk (0.444), breakfast cereals (0.431), red meat (0.407), vegetables (0.371), soup powder, condiments and sauces (0.365), processed meat (0.351), brown wholemeal bread (0.336) and fruit juice (0.336), and was labelled the ‘Western’ dietary pattern (19.8% variance). The second PC had high factor loadings for processed meat (0.559), red meats (0.558), fruits (0.516), vegetables (0.402), yoghurt, buttermilk and maas (0.336), cakes and biscuits (0.335), rice and pasta (0.326), soup powder, condiments and sauces (0.304), and fruit juice (0.301) (13.2% variance). This PC was labelled the ‘Mixed’ dietary pattern (Supplementary Table).
Multivariate linear regression analysis showing correlates with BMI
Overall, age was positively associated (p ≤ 0.001), and the ‘Mixed’ dietary pattern was negatively associated (p < 0.05) with BMI. Among young women from households with a low SES index, the ‘Mixed’ dietary pattern (p < 0.05), and MVPA (p < 0.05) were inversely associated with BMI. For those with a high household SES index, only age (p < 0.05) was associated with BMI ().
Table 2: Multivariate linear regression coefficients for BMI among young women
Structural equation modelling for the direct and indirect effects of household SES, age, education, dietary (knowledge and patterns) and MVPA on BMI
The structural equation model (SEM) for the direct and indirect effects of household SES, age, education, dietary knowledge, the Western and Mixed dietary patterns and MVPA on BMI is presented for the overall sample in and . The model showed a good comparative fit index (CFI) of 0.96 and a good standardised root mean squared residual (SRMR) of 0.05. The SEM showed that age (95% CI 0.19; 1.03, p < 0.01) had a direct effect on BMI. The ‘Mixed’ dietary pattern and MVPA had direct inverse and significant effects on BMI. A unit increase in the ‘Mixed’ dietary pattern was associated with 0.81 lower BMI kg/m2 (95% CI = −1.54; −0.08), while ≥ 150 min MVPA per week was associated with almost a 2 lower BMI kg/m2 (95% CI = −3.48; −0.41, p < 0.05).
Table 3: SEM for the association between household SES, age, education, nutritional knowledge, diet and physical activity and BMI
Discussion
We assessed the relationship between household SES, dietary knowledge and patterns, and physical activity level and the adiposity of urban South African young women. The results have shown that age, the ‘Mixed’ dietary pattern, and MVPA have a significant relationship with BMI. However, these relationships exist only in young women from low SES households compared with those from high SES households. Age was positively and significantly associated with BMI overall. The ‘Mixed’ dietary pattern, with a high intake of meat, fruits, vegetables, processed and energy-dense foods, and MVPA were inversely and significantly associated with BMI in young women from households with low SES index. Using structural equation modelling, the results highlight that the direct and total effect of age (positive), the ‘Mixed’ dietary pattern and MVPA (inverse) on BMI is significant.
The association between age and BMI and the high prevalence of overweight and obesity in this study is in line with previous findings that show the prevalence of overweight/obesity to be increasing with age.Citation29,Citation30 The overall reported prevalence of overweight/obesity in this study (46.6%) is similar to findings reported by Micklesfield et al.Citation30 and Munthali et al.,Citation31 in a cohort of young women from Soweto and Agincourt of a similar age (18–21 years), which found a 46.5% prevalence of overweight/obesity.
While other studies in urban South African women by Gradidge et al.Citation32 and Munthali et al.,Citation31 with the same cohort of women as the Micklesfield study, found associations between SES and BMI, this study’s findings did not provide any substantial evidence of a direct or indirect effect. Instead, this study provided evidence concerning the rising prevalence of overweight and obesity in South African young women in low and high SES groups. Additionally, this study’s findings and those of Micklesfield et al.Citation30 may provide an alert that current health promotion policies such as the 2018 sugar-sweetened beverages (SSB) tax have minimal impact on influence healthy eating behaviour in young South African women.Citation21,Citation33 Similar to findings in the 2013 South African National Health And Nutrition Examination Survey (SANHANES-1),Citation34 more than half of the young women in this study had poor or low nutrition knowledge, which is regarded as one of the reasons for poor food choices and the development of malnutrition that leads to obesity and NCDs.Citation35
The observed inverse associations of the ‘Mixed’ dietary pattern and physical activity with BMI in this study could represent important targets for interventions. Comparable studies evaluating the relationship of dietary patterns and BMI in young adult women are scarce. However, evidence exists from several studies done in South Africa that have reported differently on associations between dietary patterns and BMI increase in adolescents and adult women, whereby the patterns were described as ‘Western pattern’Citation20 or similar ‘animal derived pattern’.Citation36,Citation37 These dietary patterns had high intakes of red meat, processed meat, high-sugar drinks, candy and sweets, fried foods, butter and other high-fat dairy products.Citation20,Citation36,Citation37 The findings of Wrottesley et al.Citation20 are also different from the current study as they show that a ‘mixed dietary pattern’ made up of high intakes of fats and sugars was associated with weight gain during pregnancy in a Soweto study. Whilst the ‘Mixed’ dietary pattern found in this study is heterogeneous, it could be that the high intake of fruits, vegetables and dairy products is a potential driver of the inverse association with BMI. However, as this dietary pattern also has high loadings of processed meat, cakes and biscuits, and red meat, it may be showing a transition towards a high-energy dense and micronutrient-poor diet, which is associated with elevated adiposity.Citation38 In addition, 7/10 and 6/10 (high SES vs. low SES) of the food items consumed by young women in this study are linked to a micronutrient-poor diet.Citation20 Previous research has linked the increasing rate of obesity with a nutrition transition characterised by consumption of Western diets high in refined carbohydrates, added sugar and fat, as well as reduced physical activity, particularly in the African context.Citation37,Citation39–41 More studies have reported associations between fats and sugars with greater adiposity.Citation42–46 In this study, fats and sugars were among the top three foods most frequently consumed by young women.
The relationship between physical activity and SES is complex.Citation47,Citation48 Similar to other studies nationally and internationally,Citation12,Citation49 our study shows that MVPA was higher (6.5 hours per week) in the low household SES group compared with the high household SES group (4 hours per week). While other previous studies found that lower SES status was associated with more sedentary activities such as watching television,Citation50 our results found low household SES index to be associated with more time spent on MVPA and an association between MVPA and BMI. The difference in these findings may be because of young women from households with lower SES index needing to assist more with household chores or walking more than their high SES peers. This further supports findings which showed that individuals who maintain PA at recommended levels have smaller increases in BMI.Citation30,Citation51 However, that almost 60% of young women in the high household SES group do not meet the ≥ 150 minutes per week as recommended by the WHO is of great concern as it shows poor levels of physical activity in this age group. The direct, inverse and significant effect on BMI of moderate-to-vigorous physical activity supports the findings that PA can be incorporated when designing interventions to reduce the risk of overweight and high body fat percentage in a population.Citation52
This study has some limitations. Our study was cross-sectional, and we cannot make robust conclusions concerning causality in the observed associations. Reported dietary data have limitations in misreporting, and they can differ by demographic variables such as age and level of education. Our study focused only on young women. We need similar analyses in young men to identify how sex may influence the relationships and help to target interventions to men and women in South Africa. The methods included clinical measures of BMI and although self-reported measures of physical activity and sedentary behaviour were used, these methods have been validated in similar populations. The strengths also include the use of a validated QFFQ, and the PCA technique used for the present analysis to derive the dietary patterns is known to depict real-world dietary behaviours. Given that individuals do not consume nutrients or foods in isolation, the elucidation of dietary patterns that describe the overall diet, alongside the assessment of structural effects of the different individual, socioeconomic and lifestyle behaviour factors on adiposity are a particular strength of this study.
While the South African government interventions were targeted to reduce the percentage of people who are obese or overweight by 10% in 2020, with current economic and nutrition transitions it is critical that public health interventions foster greater intake of micronutrient-rich foods and maintenance of regular exercise. In a country that is already burdened by inequality, overpopulation in urban areas, high unemployment rates, unhealthy lifestyle behaviours and poor health systems, effective multi-sectoral interventions are warranted. Findings in this study can be useful in updating the current scientific knowledge: for example, an update to the latest obesity prevention and control strategy will show whether the set target was achieved, if the structural interventions to make healthier food and exercise choices were effective, and if household economic protection efforts such as access to farming land and better paid employment opportunities can improve the existing interventions. Thist will further enable the identification of gaps that still need to be addressed for the target to be achieved.
Conclusion
Our study suggests that it is important to consider the obesity risk of young women in the development of health-promotion strategies in South Africa. We recommend that future dietary, physical activity, educational and promotional programmes provide targeted strategies and guidelines suitable for young women with different SES backgrounds. In addition, our findings also suggest that healthy dietary practice, while necessary, is insufficient to facilitate pragmatic behaviour change. In combination with physical activity and dietary knowledge (despite not being associated with BMI), practical strategies are needed to motivate and facilitate behaviour changes that protect health in the short, medium and long term.
Declarations
Ethics approval and consent to participate
The Human Research Ethics Committee (HREC) of the Witwatersrand University, under ethics numbers M171137 and M190523, granted ethical approval.
Consent for publication
All participants gave written informed consent prior to taking part in the study.
Availability of data and materials
The datasets used and/or analysed during the current study are available from the corresponding author on reasonable request.
Supplemental Material
Download PDF (139.9 KB)Acknowledgements
The authors thank the participants who took part in this research and the Soweto GDAR research team whose work they represent here.
Disclosure statement
No potential conflict of interest was reported by the authors.
Supplementary Material
online supplementary material is available at https://doi.org/10.1080/16070658.2022.2076374.
Additional information
Funding
References
- Tzioumis E, Kay MC, Bentley ME, et al. Prevalence and trends in the childhood dual burden of malnutrition in low- and middle-income countries, 1990-2012. Public Health Nutr. 2016;19(8):1375–88.
- WHO. Obesity and overweight. (2016). [cited 2021 18/09]; Geneva: World Health Organisation]. Available from: https://www.who.int/mediacentre/factsheets/fs311/en/.
- Jayawardena R, Jeyakumar DT, Misra A, et al. Obesity: A potential risk factor for infection and mortality in the current COVID-19 epidemic. Diabetes Metab Syndr. 2020;14(6):2199–2203.
- National Department of Health (NDoH), S.S.A.S.S., South African Medical Research Council (SAMRC), and ICF, South Africa Demographic and Health Survey. (2016). Pretoria, South Africa, and Rockville, Maryland, USA: NDoH, Stats SA, SAMRC, and ICF, 2019.
- Nyati LH, Pettifor JM, Norris SA. The prevalence of malnutrition and growth percentiles for urban South African children. BMC Public Health. 2019;19(1):492.
- Steyn NP, Senekal M, Brtis S, et al. Urban and rural differences in dietary intake, weight status and nutrition knowledge of black female students. Asia Pac J Clin Nutr. 2000;9(1):53–9.
- Lachat C, Otchere S, Roberfroid D, et al. Diet and physical activity for the prevention of noncommunicable diseases in low- and middle-income countries: a systematic policy review. PLoS Med. 2013;10(6):e1001465.
- Singh AS, Mulder C, Twisk JWR, et al. Tracking of childhood overweight into adulthood: a systematic review of the literature. Obes Rev. 2008;9(5):474–88.
- Otero G, Pechlaner G, Liberman G, et al. The neoliberal diet and inequality in the United States. Soc Sci Med. 2015;142:47–55.
- Dover RV, Lambert EV. “Choice Set” for health behavior in choice-constrained settings to frame research and inform policy: examples of food consumption, obesity and food security. Int J Equity Health. 2016;15:48.
- Ronquest-Ross L-C, Vink N, Sigge G. Food consumption changes in South Africa since 1994. S Afr J Sci. 2015;111(9/10):1–12.
- Ajayi IO, Adebamowo C, Adami H-O, et al. Urban-rural and geographic differences in overweight and obesity in four sub-Saharan African adult populations: a multi-country cross-sectional study. BMC Public Health. 2016;16(1):1126.
- Romieu I, Dossus L, Barquera S, et al. Energy balance and obesity: what are the main drivers? Cancer Causes Control. 2017;28(3):247–258.
- Townsend MS, Peerson J, Love B, et al. Food insecurity Is positively related to overweight in women. J Nutr. 2001;131(6):1738–1745.
- Ndimande BS. “It is a catch 22 situation”: The challenge of race in post-apartheid South African desegregated schools. International Critical Childhood Policy Studies Journal. 2009;2(1):123–139.
- Odunitan-Wayas FA, Wadende P, Mogo ERI, et al. Adolescent levers for a diet and physical activity intervention across socioecological levels in Kenya, South Africa, Cameroon, and Jamaica: Mixed methods study protocol. JMIR Res Protoc. 2021;10(7):e26739.
- Prioreschi A, Wrottesley SV, Norris SA. Physical activity levels, food insecurity and dietary behaviours in women from soweto, South Africa. J Community Health. 2021;46(1):156–164.
- Filmer D, Scott K. Assessing asset indices. Demography. 2012;49(1):359–92.
- Zingoni C, Norris SA, Griffiths PL, et al. Studying a population undergoing nutrition transition: a practical case study of dietary assessment in urban South African adolescents. Ecol Food Nutr. 2009;48(3):178–98.
- Wrottesley SV, Pisa PT, Norris SA. The influence of maternal dietary patterns on body mass index and gestational weight gain in urban black South African women. Nutrients. 2017;9(7):1–14.
- Wrottesley SV, Stacey N, Mukoma G, et al. Assessing sugar-sweetened beverage intakes, added sugar intakes and BMI before and after the implementation of a sugar-sweetened beverage tax in South Africa. Public Health Nutr. 2021;24(10):2900–2910.
- Steyn NP, Senekal M, Norris SA, et al. How well do adolescents determine portion sizes of foods and beverages? Asia Pac J Clin Nutr. 2006;15(1):35–42.
- Harris PA, Taylor R, Thielke R, et al. Research electronic data capture (REDCap)–a metadata-driven methodology and workflow process for providing translational research informatics support. J Biomed Inform. 2009;42(2):377–81.
- South African Food Database System (SAFOODS). Food Composition database, version 2016. Parow Valley, Cape Town: South African Medical Research Council; 2016.
- Kliemann N, Wardle J, Johnson F, et al. Reliability and validity of a revised version of the general nutrition knowledge questionnaire. Eur J Clin Nutr. 2016;70(10):1174–1180.
- World Health, O. WHO guidelines on physical activity and sedentary behaviour. Geneva: World Health Organization; 2020.
- Crozier SR, Robinson SM, Borland SE, et al. Dietary patterns in the Southampton women's survey. Eur J Clin Nutr. 2006;60(12):1391–9.
- Schwedhelm C, Iqbal K, Knüppel S, et al. Contribution to the understanding of how principal component analysis–derived dietary patterns emerge from habitual data on food consumption. Am J Clin Nutr. 2018;107(2):227–235.
- Malambo P, Kengne AP, Lambert EV, et al. Prevalence and socio-demographic correlates of physical activity levels among South African adults in Cape Town and mount frere communities in 2008-2009. Arch Public Health. 2016;74:54.
- Micklesfield L, Munthali R, Prioreschi A, et al. Understanding the relationship between socio-economic status, physical activity and sedentary behaviour, and adiposity in young adult South African women using structural equation modelling. Int J Environ Res Public Health. 2017;14(10):1–12.
- Munthali RJ, Manyema M, Said-Mohamed R, et al. Body composition and physical activity as mediators in the relationship between socioeconomic status and blood pressure in young South African women: a structural equation model analysis. BMJ Open. 2018;8(12):e023404.
- Gradidge PJ-L, Norris SA, Munthali R, et al. Influence of socioeconomic status on changes in body size and physical activity in ageing black South African women. Eur Rev Aging Phys Act. 2018;15:6.
- Bosire EN, Stacey N, Mukoma G, et al. Attitudes and perceptions among urban South Africans towards sugar-sweetened beverages and taxation. Public Health Nutr. 2020;23(2):374–383.
- Shisana O, Labadarios D, Rehle T, et al. South African National Health and Nutrition Examination survey (SANHANES-1). Cape Town: HSRC Press; 2013.
- Walsh C, Dannhauser A, Joubert G. (1), impact of a nutrition education programme on nutrition knowledge and dietary practices of lower socioeconomic communities in the Free State and northern cape. South African Journal of Clinical Nutrition. 2003.
- Makura-Kankwende CB, Gradidge PJ, Crowther NJ, et al. Nutrient patterns and body composition parameters of black South African women. Nutrients. 2021;13(1):6.
- Pisa P, Pedro T, Kahn K, et al. Nutrient patterns and their association with socio-demographic, lifestyle factors and obesity risk in rural South African adolescents. Nutrients. 2015;7(5):3464–82.
- Fung TT, Rimm EB, Spiegelman D, et al. Association between dietary patterns and plasma biomarkers of obesity and cardiovascular disease risk. Am J Clin Nutr. 2001;73(1):61–67.
- Steyn NP, McHiza ZJ. Obesity and the nutrition transition in Sub-Saharan Africa. Ann N Y Acad Sci. 2014;1311(1):88–101.
- Paradis A-M, Godin G, Pérusse L, et al. Associations between dietary patterns and obesity phenotypes. Int J Obes (Lond). 2009;33(12):1419–26.
- Hyle EP, Martey EB, Bekker L-G, et al. Diet, physical activity, and obesity among ART-experienced people with HIV in South Africa. AIDS Care. 2021: 1–7.
- Ambrosini GL, Johns DJ, Northstone K, et al. Free sugars and Total Fat Are important characteristics of a dietary pattern associated with adiposity across childhood and adolescence. J Nutr. 2015;146(4):778–784.
- Lee AK, Chowdhury R, Welsh JA. Sugars and adiposity: the long-term effects of consuming added and naturally occurring sugars in foods and in beverages. Obes Sci Pract. 2015;1(1):41–49.
- Myers A, Fig D, Tugendhaft A, et al. Sugar and health in South Africa: potential challenges to leveraging policy change. Glob Public Health. 2017;12(1):98–115.
- Vorster HH, Kruger A, Wentzel-Viljoen E, et al. Added sugar intake in South Africa: findings from the adult prospective urban and rural Epidemiology cohort study. Am J Clin Nutr. 2014;99(6):1479–1486.
- Wrottesley SV, Micklesfield LK, Hamill MM, et al. Dietary intake and body composition in HIV-positive and -negative South African women. Public Health Nutr. 2014;17(7):1603–1613.
- Kim S, Symons M, Popkin BM. Contrasting socioeconomic profiles related to healthier lifestyles in China and the United States. Am J Epidemiol. 2004;159(2):184–91.
- De Cocker K, Ottevaere C, Sjöström M, et al. Self-reported physical activity in European adolescents: results from the HELENA (healthy lifestyle in Europe by nutrition in Adolescence) study. Public Health Nutr. 2011;14(2):246–254.
- Moniruzzaman M, Ahmed MSAM, Zaman MM. Physical activity levels and associated socio-demographic factors in Bangladeshi adults: a cross-sectional study. BMC Public Health. 2017;17(1):59.
- Gardner B, Iliffe S, Fox KR, et al. Sociodemographic, behavioural and health factors associated with changes in older adults’ TV viewing over 2 years. Int J Behav Nutr Phys Act. 2014;11:102.
- Blair SN, Archer E, Hand GA. Commentary: luke and cooper are wrong: physical activity has a crucial role in weight management and determinants of obesity. Int J Epidemiol. 2013;42(6):1836–8.
- Kesavachandran C, Bihari V, Mathur N. Can physical activity maintain normal grades of body mass index and body fat percentage? Int J Yoga. 2009;2(1):26–9.