
Abstract
Objective: To describe the dietary intake and its quality of patients with poorly controlled type 2 diabetes mellitus (T2DM) by assessing the dietary variety (DVS), dietary diversity (DDS), nutrient adequacy ratio (NAR) and mean nutrient adequacy ratio (MAR).
Design: This was a descriptive, cross-sectional study.
Setting: Diabetes outpatient clinic at a tertiary hospital in Tshwane district, Gauteng province, South Africa.
Subjects: Adults, aged 40–70 years, with poorly controlled T2DM (HbA1c ≥ 8%).
Outcome measures: Dietary intake data were obtained through two, multi-pass, 24-hour recalls. Individual food items were used to determine the DVS and DDS. The SAMRC FoodFinder III software was used to analyse the macro- and micronutrients, from which the NAR and MAR scores were determined. Descriptive statistics were used to analyse the data.
Results: Seventy-seven patients (60 females) participated. Their mean age was 57.2 (±6.6) years. The DDS was adequate at 4.99 (out of a possible 7 food groups); however, the DVS was low (16%) as well as the consumption of vegetables, fruits and legumes. Mean NAR scores indicated insufficient energy intake. Intakes of vitamin D, calcium, folate and iron were below 50% of the recommended daily intake. MAR scores indicated unsatisfactory micronutrient intake at 0.63 (ideal ≥ 1).
Conclusions: In this tertiary healthcare setting, T2DM patients with poor glycaemic control had sub-optimal dietary quality. Interventions such as nutrition education programmes that provide simple and factual information on the benefits of healthy eating and practical ways of achieving healthy diets among people with T2DM are needed.
Introduction
The burden of type 2 diabetes (T2DM) in Africa is growing,Citation1 with similar trends being observed in South Africa.Citation2 In South Africa, few (< 30%) people living with T2DM have acceptable glycaemic control (HbA1c < 7%).Citation3,Citation4 Optimal glycaemic control can be achieved if people living with T2DM embrace and adopt healthy behaviours including an appropriate diet, exercise and proper use of medication when indicated.Citation5,Citation6 Nutrition therapy is an integral component of diabetes management.Citation4 Current dietary guidelines for diabetes recommend a healthy eating plan based on a variety of nutrient dense, high-quality foods in appropriate portions aimed at overall health, improving metabolic control and preventing complications.Citation5,Citation6
High-quality diets are associated with a reduced risk for all-cause mortality, cardiovascular disease and diabetes.Citation7 This evidence underlines why the diabetes dietary recommendations emphasise quality diets.Citation5,Citation6 For people living with T2DM, low dietary quality was reported in a population from IrelandCitation8 and shown to be associated with poorer glycaemic controlCitation9 and obesityCitation10 in populations from Brazil and China respectively. Assessing the dietary quality of people with poorly controlled T2DM diabetes may help healthcare providers to better understand these patients’ needs and where to focus dietary intervention efforts. However, data on dietary quality among people living with diabetes are very limited in South Africa.
The term ‘diet quality’ describes how well a person’s diet conforms to dietary recommendations.Citation11 Diet quality encompasses several aspects including nutrient adequacy, moderation and balance among energy-yielding nutrients. Further, a high-quality diet should contain many servings of fruits and vegetables, whole grains and limited amount of saturated fat, sodium and refined carbohydrates.Citation11 Dietary diversity and variety alongside nutrient adequacy ratio (NAR) and mean nutrient adequacy ratio (MAR) are diet quality indicators commonly used in developing countries. These indices are simple and useful for assessing the diet quality of both children and adults in developing countries.Citation12
In this study, we assessed the dietary intake and dietary quality of adults with poorly controlled T2DM by assessing the dietary variety score (DVS), dietary diversity score (DDS), NAR and MAR.
This study was part of a larger study investigating the efficacy of a nutrition education intervention on glycaemic control (HbA1c) and other outcomes among people with poorly controlled T2DM (HbA1c ≥ 8%).Citation13
Methods
Study design and setting
The study employed an observational, descriptive and cross-sectional design using relevant baseline data collected for the larger study. The study setting was a diabetes outpatient clinic at a tertiary teaching hospital in the Tshwane district of Gauteng Province, South Africa.
Study population and sampling
The target population was adults, aged 40–70 years, with uncontrolled T2DM (HbA1c ≥ 8%), who received outpatient services at the clinic. Patients who have had T2DM for one year or more, could understand English and who were on any treatment modality were included. Patients were excluded if they were pregnant, lactating, critically ill or had any major diabetes complications for example proliferative retinopathy, severe renal insufficiency (GFR < 15 ml/min per 1.73 m2) and amputations. Patients with other medical conditions such as HIV, cancer and stroke were also excluded.
We used convenience sampling to obtain the sample. Sixty-five participants were required based on the formula by Hulley et al.Citation14 N = 4zα2 S2 ÷ W; where N = total subjects required, S = standard deviation of the variable from the literature, W = the confidence level, and zα = the standard normal deviation for α (which is 1.96 for α = 0.05 in this study).Citation14 We used the standard deviation for DDS, which encompasses standard food groups across studies and different communities,Citation15 unlike the DVS where items in a food group can vary between populations. We selected a standard deviation of 2 for DDS, which was found to yield the largest sample size.Citation16,Citation17
Ethical considerations
Ethical approval was obtained from the Faculty of Natural & Agricultural Sciences, Ethics Committee, University of Pretoria (EC180228-175). All ethical procedures were adhered to while collecting data for the larger study (Reference no. 4/2016).
Data collection
Measurement tools and methods
Baseline data for the main study were used in this study. The data were collected during participant enrolment from January to November 2017, prior to the intervention. Data were collected by a qualified dietitian and trained nutritionists. Data were collected through structured questionnaires completed in an individual interview.Citation13 The data included in this study were demographic, HbA1c values, anthropometric and dietary intake data.
Anthropometry and HbA1c
Participants’ weight and height were taken according to standardised methods.Citation18 We measured two weight and height measurements per participant and used the average to calculate BMI.Citation18 HbA1c was measured from venous blood samples, if there were no recent results (≤ 3 months) from routine clinical files. Blood analysis was done at the National Health Laboratory Services core laboratory.
Dietary intake
Dietary intake data were collected on two separate days, one weekday and one weekend, using the 24-hour recall (24HDR).Citation19 We used a ‘multiple pass’ 24HDR of three passes.Citation19 Food quantities were determined using standardised household portion estimation aids.
Dietary intake data management and analysis
Dietary intake data were double captured and analysed by the principal investigator (a nutritionist) and a qualified dietitian. We compared the results and resolved any discrepancies. For example, if the output from the dietary analysis software showed a difference in energy intake of a participant, the source of the discrepancy was verified (e.g. incorrect food(s) item code used, or quantity captured) from either the meal analysis outputs, or food items code or raw data and corrective measures undertaken.
Dietary quality was described by analysing the food intake, NAR, MAR, DVS and DDS of the participants.
Food and nutrients intake
We determined the frequency of the food items consumed by listing and counting all food items consumed by each participant over two days. Each food item consumed was counted only once, even if was consumed more than once a day. This prevented over-representation of regularly consumed foods.
Nutrient intake was analysed with the South African Medical Research Council FoodFinder III dietary analysis software program. Data were analysed for the energy, macro- and micronutrient intake. Following nutrient analysis, NAR and MAR were calculated.
Dietary variety
In this study, dietary variety was defined as the number of different food items consumed over two different 24-hour periods, out of the total number of possible food items consumed by all participants and was measured by a dietary variety score (DVS).Citation16 Each food item was weighted equally.
Dietary diversity
We calculated DDS as the number of different food groups consumed over 2 different 24-hour periods.Citation15 The seven food groups used in this study were (i) cereals, roots and tubers, for example potatoes and sweet potatoes; (ii) meat, poultry and fish; (iii) eggs; (iv) legumes and nuts; (v) vitamin A-rich fruit and vegetables; (vi) other fruits and vegetables; (vii) milk and dairy. We excluded sugars, fats and oils as they do not significantly contribute to micronutrient intake.Citation15
Nutrient adequacy ratio (NAR)
The NAR was calculated as the ratio between intake of a particular nutrient and its recommended daily intake (RDI).Citation15 We calculated mean (±SD) for different nutrients for the whole population. We used the FAO/WHOCitation20 and WHO/FAOCitation21 guidelines for energy and micronutrients RDI respectively. The Institute of Medicine guidelines were used for protein and fibre,Citation22 while for sugar intake (% total energy) the 2017 Society for Endocrinology, Metabolism and Diabetes of South Africa (SEMDSA) guidelines were used.Citation6
Mean adequacy ratio (MAR)
The MAR score is an average of all the different NAR values of an individual. The NAR values are summed and divided by the number of nutrientsCitation23 to indicate overall nutrient intake. When calculating the MAR, we truncated the NAR values at 1 to ensure that nutrients with a high NAR did not compensate for nutrients with a low NAR. A MAR value of 1 or above indicated that overall nutrient intake was equal to or above the recommended intake.Citation23
Statistical analysis
The SPSS program (version 23.0) was used for statistical analysis IBM Corp, Armonk, NY, USA). Descriptive statistics were performed. Means (SD) and median were calculated for continuous variables as applicable after normality check. Frequencies were computed for categorical data and count of food items/groups.
Results
Participants’ characteristics
Most of the participants were women (79%) (). Participants had a mean age of 57.2 (±6.6) years (). Participants had a mean HbA1c value of 10.45% (±1.9). Their mean BMI was 34.3 (±5.4) kg/m2. Men had a lower BMI (32.6 [±3.5] kg/m2) than women (34.85 [±5.7] kg/m2). Most participants were black African people (57.1%), unemployed (68.3%) and had a high school level of education (88.3%). Hypertension was the most prevalent co-morbidity (96.1%). Most participants reported having previously consulted with a dietitian (79%, n = 61) ().
Table 1: Participants’ characteristics (n = 77)
Dietary intake
Commonly consumed foods
Participants’ 10 most consumed foods (in descending order) were: chicken, tea, brown bread, margarine, white rice, full-cream milk, potatoes, sugar, low fat milk and sifted maize porridge. The frequency of consumption over a two-day period is presented in .
Table 2: Ten most commonly consumed foods by participants over the two-day period (n = 77)
Macro- and micronutrient intake levels and ratios
For the group as a whole, total energy intake comprised carbohydrates (53%), protein (17%), total fats (25%), saturated fats (8%), unsaturated fats (14%) and added sugar (7.8%) (data not shown).
The mean energy and macronutrients intake per day as well as the corresponding NAR values are given in . Daily energy intake was suboptimal, with NAR scores of 0.69 for men and 0.66 for women. Protein intake was close to the recommended levels. Total fibre intake was only 54% of the recommended value in males and 48% in females.
Table 3: Mean energy and macronutrient intake and NAR values of participants (n = 77)
indicates the mean micronutrient intake for males and females and the individual NAR values. We excluded supplements from our analysis. Most micronutrients had NAR values of greater than 0.8 except for calcium, iron, vitamin A (in men), vitamin D and folate. For nutrients that had a NAR of less than 0.8, participants consumed less than 50% of the RDI, except for men’s consumption of vitamin A. Vitamin D had the lowest NAR score for both genders at 22% and 23% for men and women, respectively.
Table 4: Participants’ micronutrient intake and nutrient adequacy ratio (NAR) averaged over two days (n = 77)
The total calculated MAR value (excluding energy and macronutrients) was 0.63 (±0.21); 0,62 (±0.17) and 0.63 (±0.22) for males and females respectively. Only two participants had a MAR value of 1 or more (i.e. at least 100% of RDI).
Dietary variety and dietary diversity
The mean (±SD) DVS was 18.01 (±5.59) out of a possible 113 different food items. This indicates that on average only 15.9% of all possible food items were consumed over a two-day period.
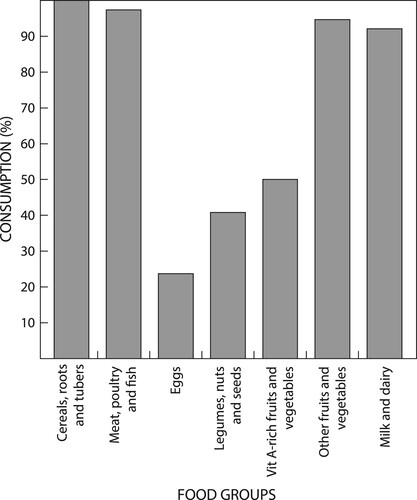
The mean (±SD) DDS was 4.99 (±0.93) out of a possible seven food groups, which excludes fats, oils, sweets, spices and condiments. shows the proportion of participants (%) who consumed each individual food group over the two days. All participants consumed cereals, roots and tubers at least once over two recall days. Nearly all participants (97.4%) consumed meat, poultry and fish at least once over two recall days. The eggs group was the least consumed (23.7%) over the two-day period followed by legumes, nuts and seeds (40.8%). Although we did not analyse these foods as a part of dietary diversity, it is important to note that fats and oils were consumed by 80.3% of participants, and sweets or high sugar-containing products were consumed by over half (57.9%) of participants at least once over two recall days (data not shown).
Figure 1: Proportion of participants (n = 77) who consumed each of the seven food groups over two days.
Discussion
This study assessed dietary intake and the quality thereof among poorly controlled T2DM adults who were assessed to be obese.
Dietary intake
Food items frequency
Major dietary guidelines for T2DM patients stipulate that diets should include fewer fats and refined carbohydrates, and more fibre rich foods including whole grains, vegetables, fruits and legumes, which have various health benefits.Citation5,Citation24 In this study, participants mostly consumed starchy foods, while legumes, fruits and vegetables were less frequently consumed. Similar findings among people with T2DM have been reported in other South African settings.Citation24,Citation25 Although vegetable and fruits consumption tends to be low among adults in South Africa (∼150 g vs. recommended 400 g),Citation26 the quantified intake of the two foods in the study participants was reported to be very low (≤ 1 serving/day; ≤ 80 g/day).Citation13
The results also indicate that the participants’ carbohydrates sources were primarily from refined or low-fibre sources including white rice, potatoes, sifted maize meal and sugar. Additionally, sweets and high sugar foods were consumed by more than half of the participants. The latter and high intake of added sugar explains the participants’ energy intake from total sugar exceeding the SEMDSA recommendations of ≤ 5% of total energy intake.Citation6 Full-cream milk was also among the top 10 consumed food item rather than lower fat milk, contrary to the dietary guidelines for people with T2DM.Citation6 This result corroborates those reported for the general South African adult population.Citation26
Macro- and micronutrient intakes
In our study, participants consumed, on average, 63% of the recommended energy intake. Similar findings were reported in another South African study that reported energy intakes < 70% of RDI among people with T2DM.Citation24 It should be noted, however, that these energy requirements are based on individuals with a healthy BMI. However, among South African adults in general energy intakes also appear to be low,Citation26 considering the high levels of obesity in our study, it is possible that participants under-reported their energy intake. Under-reporting of energy intake is more common in obese individuals,Citation27 especially those with T2DM.Citation28 Additionally, South African adults seem more likely to under-report their energy intake compared with adults from other African countries.Citation27 There is no ideal percentage of energy contribution by macronutrients recommended for people with T2DM.Citation6 Nevertheless, the pattern of intake seen in participants in this study could be considered acceptable as it is within the recommendations by the Institute of Medicine for the general population for reducing the risk of chronic diseases while getting sufficient intake of essential nutrients.Citation22
Fibre intake of participants was low (∼50% of RDI). Previous South African studies have also reported low fibre intake among the general adult populationCitation26 and people with T2DM.Citation24,Citation25 The fibre intake reported here may also be explained by the low consumption of vegetables and fruits, legumes and wholegrains. Fibre aids glycaemic control and forms an important part of the diet in people with diabetes.Citation29 In a systematic review and meta-analysis of RCT, high-fibre diets were shown to reduce absolute values of HbA1c by 0.55%.Citation30 Fibre can also aid in weight loss by enhancing satiety.Citation31 In this obese population, eating more fibre by increasing consumption of vegetables and fruits may aid in weight lossCitation31 and reduce the risk of cardiovascular disease.Citation32
Participants in our study had micronutrient intakes that were greater than or close to their specific RDI values, except for calcium, folate, iron and vitamin D, all of which were consumed in very low amounts. The MAR of 0.63 (±0.14) indicated that overall micronutrient consumption was below recommended levels. Low micronutrient intakes have been reported in people with T2DM from IrelandCitation7 and JapanCitation33 as well as Cape Town, South Africa.Citation34 Sufficient micronutrient intake is important for overall health and to help reduce health risks and complications for T2DM patients. In this study, the low intake of calcium and folate intake is concerning. Calcium is a concern given the high prevalence of hypertension (96.1%). Low serum calcium levels have been shown to be linked to increased blood pressure in T2DM patients.Citation35 Low dietary and blood folate are associated with a higher risk of coronary disease,Citation35 exacerbating the health risks associated with diabetes.Citation36
Dietary variety and diversity scores
In this study, participants had a very low DVS score (18.01, ±5.59). On average, participants consumed only 16% of all possible available food items. Two other South African studies reported similarly low DVS values.Citation37,Citation38 The low dietary variety observed here is not aligned with the South African food-based dietary guidelines (SAFBDGs), which encourage food variety.Citation39
Participants in our study consumed on average 4.99 food groups out of a possible 7 over a two-day period (DDS = 4.99 (±0.93). This value is higher than previously reported for other communities in South Africa, in both urban and rural settings. Mchiza et al.Citation26 reported a DDS value of 4 for South African adults, while two other studies reported mean DDS values of 3.41 and 2.82 for adults in peri-urban settings.Citation37,Citation38 In our study only 4% of participants had DDS < 4, suggesting that people with poor dietary diversity were in the minority. In contrast Labadarios et al.Citation40 reported that 33% of adults in the general population living in Gauteng had poor dietary diversity (DDS < 4). This higher DDS reported in our study may be explained by most participants having received dietary education on the importance of diet in diabetes management.
Overall dietary quality
Participants’ dietary intake seemed balanced because their energy intake was acceptably distributed among the macronutrients. The high DDS also pointed to possible micronutrient adequacy. However, their NAR and MAR scores indicated suboptimal micronutrient intakes. Additionally, despite the high diversity of food groups, food groups including vegetables, fruits, legumes and low-fat dairy that form part of a high-quality diet (SEMDSA 2017)Citation6 were less frequently consumed, or, if consumed, they were consumed in very low quantities as indicated by the low dietary fibre and calcium intake. Furthermore, the DVS score showed low dietary variety, indicating that though the groups were sufficiently diverse, variety within group was not adequate, which could lead to micronutrient deficiencies. Participants also consumed more refined sources of carbohydrates, including added sugar, contrary to recommendations to minimise intake of refined carbohydrates and added sugars.Citation5,Citation6 Their consumption of carbohydrates thus deviated from the guideline to consume nutrient-dense sources that are high in fibre, including vegetables, fruits, legumes and whole grains, as well as low dairy products.Citation5,Citation6
Overall, our results indicate low dietary quality of participants in this study. This result is concerning and warrants further investigation given that most participants (79%) had previously seen a dietitian. As diet is a key factor in T2DM management, adopting a healthy diet is crucial to help reduce the risk of complications and improve glycaemic control.Citation5,Citation6 Globally, non-adherence to healthy diets is mainly driven by food insecurity or insufficient physical and economic access to healthy food,Citation41 which in part could be true for this study population who were mainly unemployed. Among people with T2DM in South Africa, reported barriers to healthy eating include social context such as cultural beliefs, and conflicts in arranging family meals, hunger, financial constraints, lack of knowledge and poor understanding of the disease.Citation24,Citation42
Strengths and limitations of the study
This study adds to the limited knowledge base of the dietary intake and dietary quality of people living with T2DM. Most studies assessing dietary intake and dietary quality do not focus on people with specific conditions such as diabetes. The use of metrics such as DVS and DDS in conjunction with energy and nutrient consumption provides more comprehensive information on dietary quality than when food items or nutrients are used alone. Assessing dietary quality allows for a greater understanding of which areas need to be improved.
This study may be limited by the small sample size. Although we achieved the calculated sample size, the sample was small for effectively assessing food intake and dietary quality. Our findings may also be biased towards women, who were more numerous, which reflects the distribution of diabetes in South Africa.Citation43 Our study was also conducted in only one tertiary setting and included only participants with poorly controlled diabetes. These factors limit generalisation to other settings.
Conclusion and recommendations
In this tertiary healthcare setting, T2DM patients with poorly controlled diabetes have sub-optimal dietary quality. This indicates a need to identify the barriers to the adoption of healthy eating habits, given that most participants had previously consulted a dietitian. Improving the dietary quality of this population will rely on addressing these barriers using practical and simple tools. The SAFBDGs, which encourage food variety, consumption of lots of vegetables and fruit and consumption of dairy products daily, among others,Citation39 coupled with guidelines for portions, may be the best starting point towards improving the quality of diets in this population and in South Africa as a whole.
Ethical considerations
Ethical approval was obtained from the Faculty of Natural & Agricultural Sciences, Ethics Committee, University of Pretoria (EC180228-175).
Acknowledgements
The authors thank Dr Cheryl Tosh for her assistance with language editing. The larger study that availed the data for this study was supported by a research grant from the South African Sugar Association (grant number 251). The funding organisation had no role in any aspect of the production of this manuscript.
Disclosure statement
No potential conflict of interest was reported by the authors.
References
- Peer N, Kengne A-P, Motala AA, et al. Diabetes in the Africa Region: an update. Diabetes Res Clin Pract. 2014;103:197–205. https://doi.org/10.1016/j.diabres.2013.11.006
- Pheiffer C, Pillay-van Wyk V, Joubert JD, et al. The prevalence of type 2 diabetes in South Africa: a systematic review protocol. BMJ Open. 2018;8:e021029. https://doi.org/10.1136/bmjopen-2017-021029
- Pinchevsky Y, Shukla V, Butkow N, et al. The achievement of glycaemic, blood pressure and LDL cholesterol targets in patients with type 2 diabetes attending a South African tertiary hospital outpatient clinic. J Endocrinol Metab Diabetes S Afr. 2015;20:81–6. https://doi.org/10.1080/16089677.2015.1056468
- Webb EM, Rheeder P, Van Zyl DG. Diabetes care and complications in primary care in the Tshwane district of South Africa. Prim Care Diabetes. 2015;9:147–54. https://doi.org/10.1016/j.pcd.2014.05.002
- American Diabets Association. Lifestyle management: standards of medical care in diabetes—2019. Diabetes Care. 2019;42:S46–S60. https://doi.org/10.2337/dc19-S005
- The Society for Endocrinology, Metabolism and Diabetes of South Africa Type 2 Diabetes Guidelines Expert Committee. The 2017 SEMDSA guideline for the management of Type 2 Diabetes guideline committee. J Endocrinol Metab Diabetes S Afr. 2017;21:S1–S196. http://jemdsa.co.za/index.php/JEMDSA/article/view/647
- Schwingshackl L, Hoffmann G. Diet quality as assessed by the Healthy Eating Index, the Alternate Healthy Eating Index, the Dietary Approaches to Stop Hypertension score, and health outcomes: a systematic review and meta-analysis of cohort studies. J Acad Nutr Diet. 2015;115:780–800.e5. https://doi.org/10.1016/j.jand.2014.12.009
- Murray AE, McMorrow AM, O’Connor E, et al. Dietary quality in a sample of adults with type 2 diabetes mellitus in Ireland; a cross-sectional case control study. Nutr J. 2013;12:1–11. https://doi.org/10.1186/1475-2891-12-110
- Antonio JP, Sarmento RA, de Almeida JC. Diet quality and glycemic control in patients with type 2 diabetes. J Acad Nutr Diet. 2019;119:652–8. https://doi.org/10.1016/j.jand.2018.11.006
- Cheung LT, Chan RS, Ko GT, et al. Diet quality is inversely associated with obesity in Chinese adults with type 2 diabetes. Nutr J. 2018;17:1–12. https://doi.org/10.1186/s12937-018-0374-6
- Alkerwi A. Diet quality concept. Nutrition. 2014;30:613–18. https://doi.org/10.1016/j.nut.2013.10.001
- Ruel MT, Harris J, Cunningham K. Diet quality in developing countries. In: Preedy V, Hunter LA, Patel V, editors. Diet quality: nutrition and health. New York: Humana Press; 2013. p. 239–61. https://link.springer.com/chapter/10.1007978-1-4614-7315-2_18
- Muchiri JW, Gericke GJ, Rheeder P. Effectiveness of an adapted diabetes nutrition education program on clinical status, dietary behaviors and behavior mediators in adults with type 2 diabetes: a randomized controlled trial. J Diabetes Metab Disord. 2021;20:293–306. https://doi.org/10.1007/s40200-021-00744-z
- Hulley SB, Cummings SR, Browner WS, et al. Designing clinical research. 3rd ed. Philadelphia: Lippincott Williams & Wilkins; 2001.
- Kennedy G, Ballard T, Dop MC. Guidelines for measuring household and individual dietary diversity. Rome: Food and Agriculture Organization of the United Nations; 2011. https://www.fao.org/publications/card/en/c/5aacbe39-068f-513b-b17d-1d92959654ea/
- Hatløy A, Torheim LE, Oshaug A. Food variety — a good indicator of nutritional adequacy of the diet? A case study from an urban in Mali, West Africa. Eur J Clin Nutr. 1998;52:891–8. https://doi.org/10.1038/sj.ejcn.1600662
- Rathnayake KM, Madushani P, Silva K. Use of dietary diversity score as a proxy indicator of nutrient adequacy of rural elderly people in Sri Lanka. BMC Res Notes. 2012;5:469. https://doi.org/10.1186/1756-0500-5-469
- De Onis M, Onyango AW, Van den Broeck J, et al. Measurement and standardization protocols for anthropometry used in the construction of a new international growth reference. Food Nutr Bull. 2004;25:S27–S36. https://doi.org/10.1177/15648265040251S105
- Rutishauser IH. Dietary intake measurements. Public Health Nutr. 2005;8:1100–7. https://doi.org/10.1079/PHN2005798
- Food and Agriculture Organization of the United Nations, United Nations University, World Health Organization. Human energy requirements: report of a joint FAO-WHO-UNU expert consultation: Rome, 17-24 October 2001. Rome: United Nations University, 2004. https://www.fao.org/3/y5686e/y5686e00.htm
- World Health Organisation, Food and Agricultural Organization of the United Nations. Vitamin and mineral requirements in human nutrition. 2nd ed. Geneva: WHO; 2004. https://apps.who.int/iris/handle/10665/42716
- Institute of Medicine. Dietary reference intakes for energy, carbohydrate, fiber, fat, fatty acids, cholesterol, protein, and amino acids. Washington DC: The National Academies Press; 2005. https://nap.nationalacademies.org/catalog/10490/dietary-reference-intakes-for-energy-carbohydrate-fiber-fat-fatty-acids-cholesterol-protein-and-amino-acids
- Ruel MT. Operationalizing dietary diversity: a review of measurement issues and research priorities. J Nutr. 2003;133:3911S–26S. https://doi.org/10.1093/jn/133.11.3911S
- Nthangeni G, Steyn NP, Alberts M, et al. Dietary intake and barriers to dietary compliance in black type 2 diabetic patients attending primary health-care services. Public Health Nutr. 2002;5:329–38. https://doi.org/10.1079/PHN2002256
- Muchiri JW, Gericke GJ, Rheeder P. Effect of a nutr.ition education programme on clinical status and dietary behaviours of adults with type 2 diabetes in a resource-limited setting in South Africa: a randomised controlled trial. Public Health Nutr. 2016;19:142–55. https://doi.org/10.1017/S1368980015000956
- Mchiza ZJ, Steyn NP, Hill J, et al. A review of dietary surveys in the adult South African population from 2000 to 2015. Nutrients. 2015;7:8227–50. https://doi.org/10.3390/nu7095389
- Orcholski L, Luke A, Plange-Rhule J, et al. Under-reporting of dietary energy intake in five populations of the African diaspora. Br J Nutr. 2015;113:464–72. https://doi.org/10.1017/S000711451400405X
- Salle A, Ryan M, Ritz P. Underreporting of food intake in obese diabetic and nondiabetic patients. Diabetes Care. 2006;29:2726–7. https://doi.org/10.2337/dc06-1582
- Post RE, Mainous AG, King DE, et al. Dietary fiber for the treatment of type 2 diabetes mellitus: a meta-analysis. J Am Board Fam Med. 2012;25:16–23. https://doi.org/10.3122/jabfm.2012.01.110148
- Silva FM, Kramer CK, de Almeida JC, et al. Fiber intake and glycemic control in patients with type 2 diabetes mellitus: a systematic review with meta-analysis of randomized controlled trials. Nutr Rev. 2013;71:790–801. https://doi.org/10.1111/nure.12076
- Vuksan V, Rogovik AL, Jovanovski E, et al. Fiber facts: benefits and recommendations for individuals with type 2 diabetes. Curr Diab Rep. 2009;9:405–11. https://doi.org/10.1007/s11892-009-0062-1
- Zhan J, Liu Y-J, Cai L-B, et al. Fruit and vegetable consumption and risk of cardiovascular disease: a meta-analysis of prospective cohort studies. Crit Rev Food Sci Nutr. 2017;57:1650–63. https://doi.org/10.1080/10408398.2015.1008980
- Kobayashi Y, Hattori M, Wada S, et al. Assessment of daily food and nutrient intake in Japanese type 2 diabetes mellitus patients using dietary reference intakes. Nutrients. 2013;5:2276–88. https://doi.org/10.3390/nu5072276
- Steyn NP, Jaffer N, Nel J, et al. Dietary intake of the urban black population of Cape Town: the cardiovascular risk in black South Africans (CRIBSA) study. Nutrients. 2016;8:285. https://doi.org/10.3390/nu8050285
- Wang Z-M, Zhou B, Nie Z-L, et al. Folate and risk of coronary heart disease: a meta-analysis of prospective studies. Nutr Metab Cardiovasc Dis. 2012;22:890–9. https://doi.org/10.1016/j.numecd.2011.04.011
- Haffner SM. Coronary heart disease in patients with diabetes. N Eng J Med. 2000;342:1040–2. https://doi.org/10.1056/NEJM200004063421408
- Oldewage-Theron WH, Kruger R. Food variety and dietary diversity as indicators of the dietary adequacy and health status of an elderly population in Sharpeville, South Africa. J Nutr Elder. 2008;27:101–33. https://doi.org/10.1080/01639360802060140
- Oldewage-Theron W, Kruger R. Dietary diversity and adequacy of women caregivers in a peri-urban informal settlement in South Africa. Nutrition. 2011;27:420–7. https://doi.org/10.1016/j.nut.2010.05.013
- Vorster HH, Badham J, Venter C. An introduction to the revised food-based dietary guidelines for South Africa. S Afr J Clin Nutr. 2013;26:S5–S12. http://sajcn.co.za/index.php/SAJCN/article/view/740
- Labadarios D, Steyn NP, Nel J. How diverse is the diet of adult South Africans? Nutr J. 2011;10:1–11. https://doi.org/10.1186/1475-2891-10-33
- Shrimpton R, Rokx C. The double burden of malnutrition: a review of global evidence, Health, Nutrition and Population Discussion Paper. Washington DC: World Bank; 2012. https://openknowledge.worldbank.org/handle/10986/27417
- Muchiri JW, Gericke GJ, Rheeder P. Needs and preferences for nutrition education of type 2 diabetic adults in a resource-limited setting in South Africa. Health SA. 2011;17:1–13. https://hsag.co.za/index.php/hsag/article/view/614
- World Health Organization. Diabetes country profiles – South Africa. Geneva: WHO; 2016. https://www.who.int/teams/noncommunicable-diseases/surveillance/data/diabetes-profiles