
ABSTRACT
Objectives: Acute lymphoblastic leukemia (ALL) with CNS2 status predicts inferior outcome and a high rate of CNS relapse, similar to overt CNS leukemia (CNS3). The purpose of this study was to determine if intrathecal (IT) dose intensification during induction would improve outcomes and reduce CNS relapse for CNS2 disease.
Methods: From January 2001 to December 2014, children (1–14 years) with newly diagnosed ALL were treated at the Princess Noorah Oncology Centre (PNOC) following modifications of the Children’s Oncology Group (COG) protocols. We intensified IT methotrexate (ITM) during induction for patients with CNS2 disease. Patients were evaluated for overall survival (OS), disease-free survival (DFS), and cumulative incidence of relapse (CIR).
Results: 449 children with T-cell (14.3%) or B-cell (85.7%) ALL were treated using PNOC-SR or PNOC-HR regimens (Jan 2001- Dec 2007) or CALL08 regimens (Arm A [SR], Arm B [IR], and Arm C [HR]) (Jan 2008 - Dec 2014). The 5-year OS, DFS, and CIR were 87.2 ± 1.6%, 81.7 ± 1.9%, and 13.0 ± 1.7%, respectively. The OS and DFS of patients with CNS2 were significantly superior to that of patients with CNS3 (P = 0.025 and P = 0.019, respectively). Patients with CNS2 had similar OS and DFS to those with CNS1. None of the patients with CNS2 at initial diagnosis experienced CNS relapse.
Conclusions: ITM intensification during induction was associated with elimination of CNS recurrence in patients with CNS2 disease and childhood ALL. Controlled studies are needed to confirm this observation.
| Abbreviations | ||
| ALL, | = | acute lymphoblastic leukemia |
| BM, | = | bone marrow |
| CIR, | = | cumulative incidence of relapse |
| CNS, | = | central nervous system |
| CR, | = | complete response |
| DFS, | = | disease free survival |
| DI, | = | dose intensification |
| F, | = | female |
| HD-MTX, | = | high dose methotrexate |
| HR, | = | NCI high risk category |
| ID, | = | induction death |
| IR, | = | intermediate risk |
| IRB, | = | internal review board |
| IT, | = | intra-thecal |
| ITM, | = | intra-thecal methotrexate |
| M, | = | male |
| MRD, | = | minimal residual disease |
| N, | = | number of patients |
| NCI, | = | National Cancer Institute |
| OS, | = | overall survival |
| RBC, | = | red blood cells |
| RA, | = | relapsed and still alive |
| RD, | = | relapsed and died |
| SD, | = | standard deviation |
| SE, | = | standard error |
| SR, | = | NCI standard risk category |
| WBC, | = | white blood cells |
Introduction
Low levels of central nervous system (CNS2) leukemia are associated with inferior survival outcomes and higher rates of CNS relapse in patients with acute lymphoblastic leukemia (ALL) [Citation1]. The use of more intense systemic therapy and intrathecal (IT) therapy has been shown to decrease the risk of CNS relapse [Citation2–5].
The identification of different CNS risk categories has allowed the tailoring of CNS therapy to risk of disease recurrence. These adaptations have led to improved overall survival (OS) and disease-free survival (DFS) rates in patients with high risk disease, a decrease in treatment intensity in patients with low risk of disease recurrence without loss of good outcomes, and elimination of the use of cranial radiation in most patients [Citation2,Citation4,Citation5].
Early single-centre reports from international studies showed poor outcomes for patients with CNS2/traumatic lumbar puncture status at diagnosis of ALL [Citation6]. The overall early outcomes from our centre [Citation7] were inferior to those reported by leading leukemia cooperative groups and we hypothesized that CNS risk stratification with early intensification of IT therapy for CNS2 would improve outcomes. Therefore, since 2001, CCG1991 and CCG1961 were modified with this in mind to treat children with ALL at the Princess Noorah Oncology Center (PNOC) [Citation8]. All patients with CSN2 status at diagnosis had intensification of intrathecal methotrexate (ITM) treatments during induction.
Early results showed that children with ALL and CNS2 disease treated from 2001 to 2007 had survival outcomes that were superior to patients with overt CNS leukemia (CNS3) and comparable to patients with no evidence of CNS disease at presentation (CNS1) [Citation8]. From January 2008 to December 2014 we prospectively treated patients using modifications of the COG AALL0331 and COG AALL0232 but including the same intensification approach for intrathecal methotrexate during induction as that used in patients with CNS2 status during 2001–2007 [Citation1,Citation9,Citation10]. We combined data from both studies to evaluate whether early intensification of ITM during induction would improve the outcome and reduce the risk of CNS relapse in patients with CNS2 disease.
Methods
The records of all pediatric patients (1–14 years of age) with newly diagnosed, previously untreated ALL evaluated at PNOC, King Abdulaziz Medical City-Jeddah from January 2001 to December 2014 were reviewed. The cutoff age limit for the pediatric age group in the healthcare system in Saudi Arabia is 14 years of age. In addition, infants (12 months of age or younger) with ALL were treated on separate protocols and were excluded from this study. Similarly, patients with high risk cytogenetics, defined as the BCR-ABL1-fusion transcript (determined by FISH or RT–PCR), t(9;22)(q34;q11) ALL, hypodiploidy (less than 44 chromosomes), and/or DNA index < 0.81, were excluded from this study as they were treated with different protocols.
Patients were classified according to gender, NCI risk criteria, immunophenotype, CNS disease status at diagnosis, bone marrow (BM) response, and presence of extra-medullary disease, as previously described [Citation1,Citation11,Citation12]. CNS classification was based on cerebrospinal fluid (CSF) white blood cell (WBC), red blood cell (RBC), and leukemic blast findings plus radiological and physical examination findings. In the absence of CSF blasts and CNS signs of leukemia, CNS status was classified as CNS1. CNS2 was defined as a CSF count of less than 5 WBC/mm3 with leukemic blasts present in a non-traumatic lumbar puncture (i.e. less than 10 RBC/ mm3 in the CSF), a CSF count less than 5 WBC/mm3 with leukemic blasts present in a traumatic lumbar puncture (≥10 RBC/mm3), or a CSF count ≥5 WBC/mm3 with leukemic blasts present in a traumatic lumbar puncture that was not consistent with CNS3 using the Steinherz/Bleyer algorithm [Citation1]. CNS3 was defined when leukemic blasts were present in the CSF with ≥5 WBC/mm3 or ≥10 RBC/mm3 with excess WBC not proportional to RBC using the Steinherz/Bleyer algorithm [Citation1]. Furthermore, the presence of clinical/radiological signs of CNS leukemia was classified as CNS3 regardless of CSF results. Immunophenotype was determined using flow cytometry. The B-cell phenotype was classified according to NCI-risk criteria. Patients with the T-cell phenotype received high-risk (HR) four-drug induction regardless of National Cancer Institute (NCI)-risk. Treatment regimens were approved by the King Abdullah International Medical Research Center and Ethics Review Committee (KAIMRC ref. #:RC08-053/J). Consent for treatment was provided for by the patient’s legal guardians.
Treatment
Patients were treated according to NCI criteria [Citation1] and rapidity of response using the PNOC-SR or PNOC-HR regimens between Jan 2001- Dec 2007 (Era 1) [Citation8]. Patients treated with PNOC-SR had NCI-standard risk (initial WBC count <50,000/µl; age 1.0-9.99 years), rapid early response (RER), and no steroid pre-treatment. Patients treated with PNOC-HR had NCI-High risk (initial WBC count ≥50,000/ul or age ≥10 years), slow early response (SER), T-cell immunophenotype regardless of NCI-risk or response, or steroid pre-treatment. PNOC-SR is a modification of CCG 1991 [Citation13] and PNOC-HR is a modification of CCG 1961 [Citation14]. These modifications have been previously described (summarized in Supplemental Table 1) [Citation8]. Response was assessed using BM morphology and CSF cytospin samples at day 8, 15, and 29 of induction. SER was defined as 5% blasts or more in the bone marrow on induction days 8 or 15.
Patients were treated using CALL08 regimens (Arm A, Arm B, and Arm C with/without HD-MTX) between Jan 2008 - Dec 2014 (Era 2). Arm A was used to treat patients with NCI-standard risk and B-cell phenotype, RER, no steroid pre-treatment, no KMT2A-rearrangement, and no CNS3 or testicular disease at diagnosis. Arm B was used to treat patients with NCI-high risk and B-cell phenotype, no KMT2A-rearrangement, no steroid pre-treatment, RER, and no CNS3 or testicular disease at diagnosis. Arm C (with/without HDMTX) was used to treat patients with SER, steroid pre-treatment, KMT2A-rearrangement and RER, T-cell phenotype, or CNS3 or testicular involvement at diagnosis. Arm A was modified from the COG AALL0331 protocol [Citation1,Citation9], Arm B from the COG AALL0232 protocol [Citation1,Citation10], and Arm C (with/without HDMTX) from the COG AALL0232 and COG AALL0434 protocols [Citation1,Citation10,Citation15]. Response assessment was conducted on days 15 and 29 of induction using BM morphology and flow-based minimal residual disease (MRD) measurement. SER was defined as 5% or greater blasts in the BM at day 15 or MRD ≥0.01% at the end of induction. Only the end-of-induction CSF sample was documented for remission/blasts clearance as per protocol criteria used in this study. The rapidity of blast clearance was not used to change therapy. However, patients with persistent blasts at end-of-induction assessment were considered induction failure.
Induction therapy
Standard risk induction regimens (PNOC-SR and the CALL08 Arm A) consisted of three systemic drugs (dexamethasone, vincristine, and PEG asparaginase) with three IT doses on days 1, 15, and 29 for CNS1. Patients with CNS2 received an additional two ITM doses on days 8 and 22.
High risk induction regimens (PNOC-HR, CALL08 Arm B, and CALL08 Arm C) consisted of four drugs (dexamethasone, vincristine, PEG asparaginase, and daunorubicine) with three IT doses on day 1, 15, and 29 for CNS1 and an additional two doses on days 8, and 22 for CNS2 (IT dosing summarized in Supplemental Table 2). All patients with CNS3 status at diagnosis received the same number of IT doses during induction as those with CNS2.
Post-induction intensification (Single vs. Double)
Post-induction therapy was categorized into single intensification (Arm A and Arm B with one delayed intensification and one interim maintenance phase) and double intensification regimens (PNOC-SR, PNOC-HR, and Arm C with double delayed intensification and double interim maintenance). Patients with CNS1 or CNS2 status at diagnosis were treated based on the initial risk and response-based stratification detailed above. Patients with CNS3 status at diagnosis were administered a double post-induction intensification regimen in addition to cranial irradiation, regardless of their risk and response-based stratification at diagnosis.
Cranial radiation
Cranial radiation therapy was used only in CNS3 patients in our centre. All patients with CNS3 at diagnosis received 18Gray cranial irradiation in 10 divided daily fractions. The timing of cranial radiation for patients with CNS3 was during the consolidation phase in the PNOC-SR and PNOC-HR regimen and during the delayed intensification phase in the Arm C regimen. Prophylactic cranial radiation was not used.
Intrathecal therapy
Intrathecal therapy consisted of IT cytarabine for the first dose in all patients, followed by ITM in all subsequent doses. Patients with CNS2 status received two additional ITM doses during induction (i.e. weekly ITM regardless of rapidity of clearance of blasts on serial CSF cytospin sample analyses). Patients with CNS3 received the same number of IT doses as patients with CNS2 during induction. The total number of post-induction ITM doses (dose intensity) varied by regimen, gender, and CNS status at diagnosis (Supplemental ).
The number of post-induction ITM doses for patients with CNS3 receiving cranial irradiation was adjusted as follows: for PNOC-SR, two IT doses during consolidation were omitted; PNOC-HR, three doses (2 in consolidation and 1 in delayed intensification) were omitted; Arm C, seven (2 in consolidation, 1 in delayed intensification, and 4 during the first year of maintenance) were omitted. The IT dose intensity of each regimen was categorized into three groups based on the post-induction intensity; standard IT intensity (Arm A and PNOC-SR regimens), intermediate IT intensity (Arm B and PNOC-HR regimens), and high IT intensity (Arm C regimen).
Definitions
Overall survival (OS) was defined as the interval between diagnosis and the last date of follow-up or death from any cause. Complete remission (CR) was defined as less than 5% blasts in the BM, the absence of leukemic blasts in blood and CSF, and no evidence of localized disease after completion of induction therapy. Disease-free survival (DFS) was defined as the interval between the date of first remission (CR) and the date of first event (relapse, second malignancy, or death from any cause).
Statistical analysis
Continuous variables were presented as the mean ± standard deviation (SD). Count data was expressed as a number and percentage. A Mann–Whitney U test was used to compare two groups of quantitative data. A Chi-square test was used to compare categorical variables. Fisher’s exact test was used to compare categorical variables when one of the values was 0. All tests evaluated 2-sided P values. P < 0.05 was considered statistically significant. Survival was estimated using Kaplan Meier testing. Ten patients that died during induction therapy were excluded from the post-induction DFS and CIR analyses. Survival was compared using a 1-sided log rank test. Cumulative Incidence of Relapse (CIR) was calculated from the date of CR until relapse at any site, taking into account death in CR as a competing risk using Gray’s test. Statistical analyses were performed using R version 3.4.2 (9-28-2017).
Results
Patient characteristics
Four hundred and forty-nine children with newly diagnosed ALL were evaluated and treated with one of five different regimens during the study period. Sixty-four (14.3%) had T-cell and 385 (85.7%) had B-cell ALL. Of the 449 patients, 252 were male and 197 female. Three hundred and sixty-six (81.7%) patients had CNS1 status at diagnosis, 43 (9.6%) CNS2, and 39 (8.7%) CNS3. CNS status was not available for 1 patient. Of the CNS2 patients, 29 had traumatic lumbar puncture with leukemic blasts and 14 met CNS2 criteria with no evidence of traumatic lumbar puncture.
Patients with T-cell ALL, NCI-HR, and high WBC count at initial diagnosis were more likely to have CNS disease (). Patients with CNS2 disease shared several high-risk clinical characteristics with CNS3 patients, findings that occurred less frequently in patients with CNS1. These findings included a similar incidence of T-cell ALL as patients with CNS3 (Chi square test, CNS2 vs. CNS3, P > 0.05; CNS1 vs. CNS3, P < 0.00001; CNS1 vs. CNS2, P = 0.0005), a similar incidence of NCI-HR as patients with CNS3 (Chi square test, CNS2 vs. CNS3, P > 0.05; CNS1 vs. CNS3, P = 0.0006; CNS1 vs. CNS2, P = 0.0243), a similar incidence of WBC ≥50,000/µL as patients with CNS3 (Chi square test, CNS2 vs. CNS3, P > 0.05; CNS1 vs. CNS3, P = 0.0003; CNS1 vs. CNS2, P = 0.004).
Table 1. Patient characteristics.
Overall, six main chromosomal abnormalities were identified; hyperdiploidy (N = 82), ETV6/RUNX1 (N = 25), t(1;19) (N = 13), KMT2A (N = 9), intrachromosomal amplification of chromosome 21 (iAMP21) (N = 5), and normal cytogenetic (N = 55). There was no significant difference in the CNS distribution of each cytogenetic subgroup (Supplemental Table 3).
Four (1.6%) patients had testicular involvement, 248 had no testicular involvement, and 197 were female. Twelve (2.67%) patients were pre-treated with steroids. Two hundred and eighty-eight (64%) patients had NCI-SR clinical features and 160 (36%) NCI-HR. Seventeen (3.79%) children had Down syndrome.
Overall survival and disease-free survival
The 5-year OS and DFS for all patients were 87.2 ± 1.6% (SE) and 81.7 ± 1.9%, respectively. Three hundred eighty four (85.5%) of the patients had a durable CR after treatment, 34 (7.6%) relapsed and died, 21 (4.7%) relapsed and are still alive, and 10 (2.2%) died during induction. Mean overall follow-up was 6.02 ± 2.76 years (range: 0.02-11.7). No second malignancies were diagnosed during follow-up.
Deaths were more common in patients with the KMT2A-rearrangment (KMT2A vs. ETV6/RUNX1, 4/9 vs. 1/25, P = 0.0033; KMT2A vs. hyperdiploidy, 4/9 vs. 6/82, P = 0.00723; KMT2A vs. normal cytogenetics, 4/9 vs. 5/55, P = 0.000468). However, there was no difference in the number of deaths in patients having KMT2A ALL vs. t(1:19) ALL (4/9 vs. 3/13, P = 0.29).
The OS and DFS of patients with CNS2 at initial presentation were significantly better than that of patients with CNS3 (,(A)). In contrast, the OS and DFS of patients with CNS2 were comparable to CNS1 regardless of gender, immunophenotype, or NCI-risk category (,(B–D)). Female patients with CNS3 had a significantly worse OS and DFS than those with CNS1 or CNS2 (). OS and DFS for all patients treated in the two treatment eras were similar (P > 0.05 for all 3 CNS groups). Subgroup analysis of patients with CNS2 status by traumatic (N = 29) vs. non-traumatic (N = 14) showed similar OS (P > 0.05) and DFS (P > 0.05) rates for both subgroups.
Figure 1. (A) Disease-free survival for all patients by CNS status. Patients with CNS1 and CNS2 status at initial diagnosis had similar outcomes. (B) Disease-free survival by gender. Male and female patients with CNS2 status at initial diagnosis had similar outcomes (P > 0.05, log rank test). (C) Disease-free survival by immunophenotype. Patients with CNS2 status at initial diagnosis and B- or T-cell ALL had similar outcomes (P > 0.05, log rank test). (D) Patients with B-cell ALL and CNS2 status at initial diagnosis with NCI-SR or NCI-HR had similar disease free survival (P > 0.05, log rank test).
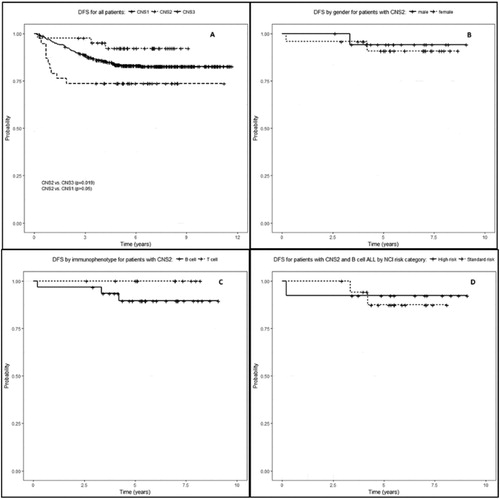
Table 2. 5-year Overall Survival (OS) and Disease Free Survival (DFS) by CNS status at presentation.
Evaluation of post-induction therapy
Patients with CNS2 treated with different post-induction chemotherapy- and IT-intensification regimens generally experienced similar OS and DFS (, Supplemental Figure 1A and 1B, P > 0.05). Patients with CNS2 treated with single post-induction intensification regimens had similar OS and DFS to that of patients with CNS1. Double intensification regimens also resulted in comparable OS and DFS for CNS1 and CNS2 disease, while patients with CNS3 had significantly inferior survival outcomes ( and Supplemental Figure 1C; DFS: CNS2 vs. CNS3, P = 0.028).
Patients with CNS2 treated with standard, intermediate, and high post-induction IT dose-intensity regimens had similar DFS (Supplemental Figure 1B, P > 0.05). Patients with CNS1 and CNS2 that were treated with standard IT dose-intensity regimens had similar OS and DFS (). Of the patients treated with intermediate IT dose-intensity, those with CNS2 had similar OS and DFS as patients with CNS1 and better DFS than patients with CNS3. The OS and DFS of patients treated with high IT dose-intensity did not vary by CNS status (). Patients with CNS2 had favourable outcomes, similar to those with CNS1 status (), regardless of the post-induction systemic chemotherapy intensification regimen or the post-induction IT-dose intensity used. These findings suggest that early ITM intensification during induction favourably impacted patient outcome.
Relapse
The 5-year CIR for all patients was 13.0 ± 1.7%. The 5-year CIR for patients with isolated CNS relapse was 3.4 ± 0.9%, and 3.2 ± 0.9% for those with combined CNS + BM relapse. The cumulative incidence of any relapse that involved the CNS (CIR-anyCNS) was 6.6 ± 1.23%. Of the 55 (12.3%) patients that relapsed after induction, 26 (47.3%) relapsed in the BM, 14 (25.5%) in the CNS, 13 (23.6%) in the CNS and BM, 1 (1.8%) in the testes, and 1 (1.8%) in the skin.
Patients with CNS2 at initial presentation experienced no CNS relapse (CIR-anyCNS = 0%) (), and had less relapse than patients with CNS3 (). Females with CNS1 at presentation experienced fewer relapses than those with CNS3 (). Patients with T-cell ALL that were CNS1 at presentation experienced fewer relapses than those with CNS3 (). No other differences in relapse by CNS status were seen.
Figure 2. Cumulative incidence of any CNS relapse by CNS status at initial presentation. CNS relapse was less frequent with CNS2 at in initial presentation than with CNS3 (P = 0.029, log rank test).
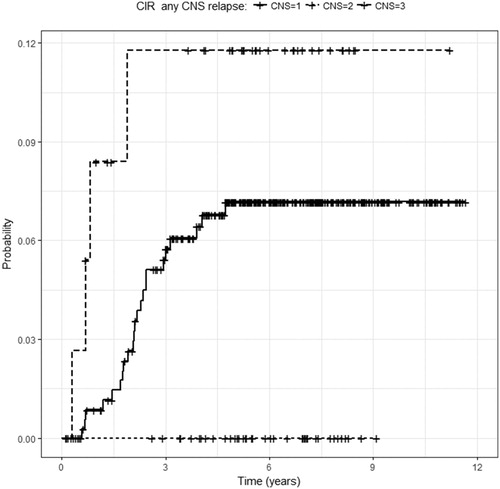
Table 3. 5-year Cumulative Incidence of Relapse (CIR) of CNS disease alone, CNS plus Bone Marrow (BM) disease, or any CNS relapse by CNS disease at presentation.
Post-induction chemotherapy- and IT-intensification schemes showed no difference in CNS relapse by CNS status for each treatment regimen (). Notably, no patient with CNS2 status at initial presentation experienced a relapse involving the CNS. These findings further support our hypothesis that the main difference in patient treatment outcomes in patients with CNS2 was the use of early ITM intensification during induction.
Table 4. 5-year Cumulative Incidence of Relapse (CIR) of CNS alone disease, CNS plus Bone Marrow (BM) disease, or any CNS disease by CNS disease at presentation.
Death events
Sixty-one patients died (13.6%); 10 (2.2%) during induction, 3 (0.7%) in consolidation, 10 (2.2%) during delayed intensification, 4 (0.9%) during maintenance, and 34 (7.6%) with relapse. Death as first event (induction death [ID] and death in first CR) was further analyzed as a crude estimate for treatment toxicity.
ID occurred in 10 (2.2%) of 449 patients. Similar ID rates were observed by CNS category (CNS1 = 2.19%, CNS2 = 2.33%, CNS3 = 2.56%; Chi square test, P = 0.988), NCI risk status (1.74% of NCI-HR patients vs. 3.13% of NCI-SR patients; Chi square test, P = 0.3) and by treatment era (Era 1 vs. Era 2, 2.8% vs. 1.7%, Chi square test, P = 0.43). One (5.9%) of 17 patients with Down syndrome had an ID and 9 (2.1%) of 430 patients without Down syndrome had an ID (Chi square test, P = 0.30).
Of the patients with death in CR, 3.35% (15/448) had CNS1, none had CNS2, and 0.45% (2/448) had CNS3. 2.24% (3/124) of these patients received PNOC-SR, 5.49% (5/91) PNOC-HR, 0.88% (1/114) Arm A, 7.32% (3/41) Arm B, 3.13% (1/32) Arm C, and 9.1% (4/44) Arm C plus high dose methotrexate. Thirteen (76.5%) of 17 patients who experienced death in CR received a double intensification regimen. The majority of these deaths (71.4%, 10/17) occurred during the delayed intensification phase with infection being the most common cause of death. There was no difference in the frequency of death as first event after CR in each CNS category at diagnosis (Chi square test, P > 0.05 for all 3 comparisons).
Discussion
We treated 449 children with newly diagnosed ALL at a single centre over 14 years. Given the reported inferior outcomes and increased risk of CNS relapse of patients with CNS2 disease in major cooperative studies, including the COG, we used modified COG treatment protocols and augmented induction ITM therapy for CNS2 disease with the goal of improving the outcomes of patients with CNS2 disease.
Several risk factors for poor outcome have been described for patients with ALL including NCI-HR (age ≥ 10 years, WBC count at diagnosis ≥ 50,000/µL), CNS2 or CNS3 status at diagnosis, and T-cell ALL [Citation1,Citation16]. Patients we treated with CNS2 status at diagnosis had a similar incidence of NCI-HR, WBC ≥50,000/µL, and T-cell ALL as patients with CNS3, and a more frequent occurrence than patients with CNS1 (). In spite of the high-risk demographic features and lack of prophylactic cranial radiation in patients with CNS2, patients with CNS2 in our study had similar outcomes to those with CNS1 disease and significantly improved outcomes compared to patients with CNS3 disease.
Most recent protocols have reported ID rates of approximately 1.1% [Citation17]. The higher ID rate of 2.2% seen in our patients was not associated with CNS category, NCI-risk, Down syndrome, or treatment Era. Improvement in supportive care over time has improved ID rates in patients we previously reported [Citation18]. Improvement was also seen in patients reported here (Era 1, 2.8% vs. Era 2, 1.7%), although this difference was not significant. Importantly, the addition of extra ITM during induction for CNS2 status was not associated with increased ID rates.
We used the COG backbone protocols reported in Winick N et al. [Citation1] and intensified induction for CNS2 status at diagnosis by the addition of two extra doses of ITM during induction to treat our patients. Patients in our study with CNS2 at presentation had similar 5-year OS, DFS, CIR CNS and CIR CNS + BM as patients with CNS1 and the 5-year OS and DFS of patients with CNS2 was superior to those with CNS3, regardless of post-induction treatment intensity. Outcomes of CNS2 patients we treated were also improved over those of previous reports that did not use early intensification of ITM therapy during induction (Supplemental Table 4) [Citation1,Citation19].
The absence of CNS relapse in patients with CNS2 at initial diagnosis treated with any of the treatment regimens is noteworthy (,). We attribute this improved outcome of patients to the early intensification of ITM therapy during induction. Patients with CNS2 status at diagnosis received two additional ITM doses during induction but post-induction systemic chemotherapy and the protocol regimen were not otherwise changed for this criterion. These findings support those of Pui et al that intensification of induction and post-induction IT therapy for patients with ALL and high risk of CNS relapse could improve outcomes and eliminate the need for prophylactic cranial irradiation [Citation15,Citation18,Citation20].
The effect of clinical risk factors on outcome was evaluated. We found that even when accounting for gender, NCI-risk, or immunophenotype, patients with CNS2 had outcomes comparable to that of patients with CNS1. Female patients received four IT doses less in the maintenance phase of post-induction therapy than male patients. Despite this, male and female patients with CNS1 and CNS2 ((B)) and patients with B-cell ALL and NCI-SR or NCI-HR had similar OS and DFS by CNS status ((D)). In addition, patients with CNS2 and T-cell ALL had comparable outcomes to those with CNS1 when using the same ITM intensification approach during induction ((C)). These finding further support the hypothesis that ITM intensification during induction benefits patients with CNS2 regardless of gender, NCI-risk, or immunophenotype.
Approximately 9% of our patients had CNS3 at diagnosis, higher than the <5% reported by other groups [Citation1,Citation19,Citation21]. Patients with CNS3 we treated with PNOC-HR and Arm C had similar OS and DFS, suggesting a balance in their response to early cranial irradiation during consolidation (PNOC-HR) and delayed cranial irradiation with a greater number of post-induction IT doses (Arm C). However, patients with CNS3 had inferior 5-year OS and DFS rates compared to those with CNS1 or CNS2 disease (,). Outcomes of patients with CNS3 also varied by gender and immunophenotype. Female patients with CNS3 had worse OS and DFS than those with CNS1 and CNS2, and worse CIR-CNS than those with CNS1. Patients with CNS3 and T-cell ALL had significantly worse 5-year DFS than those with CNS2 disease. Thus, despite the intensification of systemic chemotherapy and the use of cranial irradiation for patients with CNS3, further improvement in the treatment approach for patients with CNS3 disease is warranted.
Conclusions
Improved outcomes were observed in patients with CNS2 disease treated on a COG backbone protocol. We attribute this improved outcome to the early intensification of ITM therapy during induction incorporating two additional ITM doses. Notably, none of the patients with CNS2 had a CNS relapse on long term follow-up and patients with CNS2 had comparable outcomes to those with CNS1 disease. Controlled studies are needed to confirm these findings. Further improvements in treatment are needed for patients with CNS3 disease.
Disclosures
The authors report no conflict of interest.
Acknowledgements
The authors would like to acknowledge the clinical and research teams for providing care and collecting data.
Disclosure statement
No potential conflict of interest was reported by the authors.
ORCID
Wasil Jastaniah http://orcid.org/0000-0002-2495-8796
Aeshah A. AlAzmi http://orcid.org/0000-0002-2761-7559
Additional information
Funding
Related Research Data
References
- Winick N, Devidas M, Chen S, et al. Impact of initial CSF findings on outcome among patients with national cancer institute standard- and high-risk B-cell acute lymphoblastic leukemia: a report from the children’s oncology group. J Clin Oncol Off J Am Soc Clin Oncol. 2017;35(22):2527–2534. doi: 10.1200/JCO.2016.71.4774
- Hill FGH, Richards S, Gibson B, et al. Successful treatment without cranial radiotherapy of children receiving intensified chemotherapy for acute lymphoblastic leukaemia: results of the risk-stratified randomized central nervous system treatment trial MRC UKALL XI (ISRC TN 16757172). Br J Haematol. 2004;124(1):33–46. doi: 10.1046/j.1365-2141.2003.04738.x
- Hudson MM, Neglia JP, Woods WG, et al. Lessons from the past: opportunities to improve childhood cancer survivor care through outcomes investigations of historical therapeutic approaches for pediatric hematological malignancies. Pediatr Blood Cancer. 2012;58(3):334–343. doi: 10.1002/pbc.23385
- Salzer WL, Devidas M, Carroll WL, et al. Long-term results of the pediatric oncology group studies for childhood acute lymphoblastic leukemia 1984-2001: a report from the children’s oncology group. Leukemia. 2010;24(2):355–370. doi: 10.1038/leu.2009.261
- Richards S, Pui C-H, Gayon P. Systematic review and meta-analysis of randomized trials of central nervous system directed therapy for childhood acute lymphoblastic leukemia. Pediatr Blood Cancer. 2013;60(2):185–195. doi: 10.1002/pbc.24228
- Gajjar A, Harrison PL, Sandlund JT, et al. Traumatic lumbar puncture at diagnosis adversely affects outcome in childhood acute lymphoblastic leukemia. Blood. 2000;96(10):3381–3384.
- Fryer C, Felimban S, Paltiel C, et al. Acute lymphoblastic leukemia in children: a fifteen year experience at the princess Nourah Oncology Center, Jeddah. Saudi Arabia. Austral - Asian J Cancer. 2006;5(4):199–204.
- Jastaniah W, Elimam N, Abdalla K, et al. Does the early intensification of intrathecal therapy improve outcomes in pediatric acute lymphoblastic leukemia patients with CNS2/TLP+ status at diagnosis? Hematol Amst Neth. 2015;20(10):561–566.
- Mitchell H-R, Lu X, Myers RM, et al. Prospective, longitudinal assessment of quality of life in children from diagnosis to 3 months off treatment for standard risk acute lymphoblastic leukemia: results of children’s Oncology group study AALL0331. Int J Cancer. 2016;138(2):332–339. doi: 10.1002/ijc.29708
- Larsen EC, Devidas M, Chen S, et al. Dexamethasone and high-dose methotrexate improve outcome for children and young adults with high-risk B-acute lymphoblastic leukemia: a report from children’s oncology group study AALL0232. J Clin Oncol Off J Am Soc Clin Oncol. 2016;34(20):2380–2388. doi: 10.1200/JCO.2015.62.4544
- Smith M, Arthur D, Camitta B, et al. Uniform approach to risk classification and treatment assignment for children with acute lymphoblastic leukemia. J Clin Oncol Off J Am Soc Clin Oncol. 1996;14(1):18–24. doi: 10.1200/JCO.1996.14.1.18
- The Lancet. Steinherz/Bleyer algorithm method of evaluating traumatic lumbar puncture. [Oct 2014]. Available from: http://www.thelancet.com/cms/attachment/2025028614/2044736503/mmc1.pdf.
- Matloub Y, Bostrom BC, Hunger SP, et al. Escalating intravenous methotrexate improves event-free survival in children with standard-risk acute lymphoblastic leukemia: a report from the children’s oncology group. Blood. 2011;118(2):243–251. doi: 10.1182/blood-2010-12-322909
- Seibel NL, Steinherz PG, Sather HN, et al. Early post-induction intensification therapy improves survival for children and adolescents with high-risk acute lymphoblastic leukemia: a report from the children’s oncology group. Blood. 2008;111(5):2548–2555. doi: 10.1182/blood-2007-02-070342
- Winter SS, Devidas M, Chen S, et al. Capizzi-style methotrexate with pegasparagase (C-MTX) is superior to high-dose methotrexate (HDMTX) in T-lineage acute lymphoblastic leukemia (T-ALL): results from Children's Oncology Group (COG) AALL0434. Blood. 2015;126(23):794.
- Schultz KR, Pullen DJ, Sather HN, et al. Risk- and response-based classification of childhood B-precursor acute lymphoblastic leukemia: a combined analysis of prognostic markers from the pediatric Oncology group (POG) and children’s cancer group (CCG). Blood. 2007;109.
- Seif AE, Fisher BT, Li Y, et al. Patient and hospital factors associated with induction mortality in acute lymphoblastic leukemia. Pediatr Blood Cancer. 2014;61(5):846–852. doi: 10.1002/pbc.24855
- Jastaniah W, Abrar MB, Khattab TM. Improved outcome in pediatric AML due to augmented supportive care. Pediatr Blood Cancer. 2012;59(5):919–921. doi: 10.1002/pbc.24195
- Moricke A, Reiter A, Zimmermann M, et al. Risk-adjusted therapy of acute lymphoblastic leukemia can decrease treatment burden and improve survival: treatment results of 2169 unselected pediatric and adolescent patients enrolled in the trial ALL-BFM 95. Blood. 2008;111(9):4477–4489. doi: 10.1182/blood-2007-09-112920
- Pui CH, Mahmoud HH, Rivera GK, et al. Early intensification of intrathecal chemotherapy virtually eliminates central nervous system relapse in children with acute lymphoblastic leukemia. Blood. 1998;92(2):411–415.
- Pui C-H, Campana D, Pei D, et al. Treating childhood acute lymphoblastic leukemia without cranial irradiation. N Engl J Med. 2009;360(26):2730–2741. doi: 10.1056/NEJMoa0900386