
ABSTRACT
Objectives: To evaluate the value of Wilms’ tumor 1 mRNA (WT1) expression in the differential diagnosis of childhood myelodysplastic syndrome (MDS) and aplastic anemia (AA).
Methods: This study compared WT1 expression levels in children of MDS and AA to evaluate its value in differential diagnosis.
Results: WT1 overexpression rate and mean WT1 expression level were significantly higher in MDS compared to AA (P = 0.000 and P = 0.013, respectively). Patients with RCC and normal cytogenetics exhibited significantly greater portion of patients exposing WT1 overexpression, compared to all AA subtypes (P = 0.001, P = 0.000 and P = 0.001, respectively). ROC curve analysis revealed that WT1 expression could differentiate between RCC with normal cytogenetics and non-severe AA. Based on a cut-off value of 1.45%, WT1 expression provided a sensitivity of 23.2% and a specificity of 100%.
Discussion: In the present study, WT1 overexpression rate was gradually decreased in RAEB group, RCC group and AA subtypes, and the mean WT1 expression level of the MDS patients was significantly higher than that of the AA group. It is very difficult to differentiate between RCC with normal cytogenetics and NSAA in children. Our results showed significant differences in WT1 overexpression rate between these two groups. When we set the cut-off value as 1.45%, WT1 expression levels could be used to differentiate between cases of RCC with normal cytogenetics and NSAA in children.
Conclusion: WT1 expression might be useful for distinguishing between myelodysplastic syndrome and aplastic anemia in children.
Introduction
Myelodysplastic syndrome (MDS) in children is a heterogeneous collection of clonal hematopoietic stem cell disorders, which is characterized by bone marrow failure and an increased probability of developing acute leukemia [Citation1]. Acquired childhood aplastic anemia (AA) is another clinical syndrome which is characterized by fatty replacement of the bone marrow, a nearly absence of hematopoietic precursor cells and peripheral blood pancytopenia [Citation2]. Because the clinical manifestations of these two syndromes are very similar in childhood, it is difficult to differentiate between MDS and AA and to give appropriate treatment according to an accurate diagnosis.
Pediatric MDS is typically diagnosed based on unexplainable cytopenia which is refractory to therapy and accompanied by morphological dysplasia, as defined by the French-American-British group [Citation3]. However, many factors may affect the diagnosis of MDS in children. Firstly, younger children exhibit less obvious dysplastic manifestations. Secondly, MDS in children is usually associated with decreased marrow cellularity, which makes it difficult to differentiate between MDS and AA [Citation4]. Thirdly, several conditions may closely mimic MDS in children, such as viral infection, reactions to medication and nutritional deficiencies [Citation5]. Moreover, cytogenetic abnormalities are only present in approximately one-half of MDS cases, which further complicates the differentiation between childhood AA and low-risk MDS [Citation6]. Therefore, several markers have been developed for differentiating between MDS and AA in children, although they have low reliability and are not widely used.
The Wilms’ tumor 1 (WT1) gene is responsible for the development of Wilms’ tumor, and encodes a zinc finger transcription factor which is important for cell proliferation and differentiation [Citation7]. The WT1 gene frequently overexpresses in many neoplasms, such as acute leukemia and MDS [Citation8–11]. WT1 overexpression had also been found in the majority of pediatric acute myeloid leukemia cases [Citation12,Citation13]. Ueda et al. have reported that WT1 mRNA expression levels could provide useful information regarding disease progression and facilitate risk assessments in patients with MDS [Citation14]. Qin et al. have also reported that the WT1 and PRAME (preferentially expressed antigen of melanoma) transcripts may be a good molecular combination for monitoring minimal residual disease in patients with MDS [Citation15]. Woehlecke et al. have also reported that WT1 expression before transplantation is an independent prognostic factor for monitoring minimal residual disease [Citation16]. Moreover, Tamura et al. have found that high titers of anti-WT1 antibodies independently predicted longer survival based on the expression of WT1 mRNA in patients with MDS [Citation17]. These findings suggest that WT1 expression increase in high-grade MDS and acute leukemia. The high WT1 mRNA-overexpression rates in each stage of MDS also suggest that WT1 mRNA levels may be useful for differentiating between refractory anemia (RA) and AA. However, Iwasaki et al. reported that there was no significant difference in WT1 expressions when they compared AA and RA cases, and suggested that WT1 expression level was not useful for differentiating between these two conditions [Citation8]. Nevertheless, that study only evaluated a small sample of adult patients (7 patients with AA), and the usefulness of WT1 expression for differentiating between childhood MDS and AA remains unclear. Therefore, the present study evaluated WT1 expression levels in various subgroups of childhood MDS and AA and examined whether these values were useful for differentiating between MDS and AA.
Methods
Patients and samples
This retrospective study evaluated 94 children with MDS (83 patients with refractory cytopenia of childhood [RCC], 6 patients with refractory anemia with excess blasts [RAEB], and 5 patients with juvenile myelomonocytic leukemia [JMML]) who were treated at the Department of Paediatrics in People’s Hospital Peking University between February 2008 and July 2014. These patients all fulfilled the ‘minimal diagnostic criteria’ for MDS [Citation18], which were based on the French-American-British morphological criteria, bone marrow biopsy, immunophenotyping and chromosome karyotyping. We excluded children with therapy-related MDS. Eighty-two patients with MDS-RCC received cyclosporine and androgen as their first-line therapy. All patients and/or their guardians had provided informed consent for treatment.
We also evaluated 124 children with acquired AA (77 patients with non-severe AA [NSAA], 27 patients with severe AA [SAA], and 20 patients with very severe AA [VSAA]) who were treated at People’s Hospital Peking University between January 2008 and July 2014. The severity of their AA was defined according to Camitta et al.’s criteria [Citation19]. These patients all received immunosuppressive therapy (IST) and/or bone marrow transplantation. All these patients were screened using chromosomal breakage/genetic testing to exclude congenital bone marrow failure diseases, such as Fanconi anemia. All samples were collected with the informed consent of the patients and/or their guardians.
This study’s design was approved by the Institutional Review Board of People’s Hospital Peking University.
RNA extraction and cDNA synthesis
Mononuclear cells were isolated from bone marrow samples using Ficoll-Hypaque gradient centrifugation. According to the manufacturer’s instructions, TRIzol (Invitrogen, USA) and a NucleoSpin RNA XS kit (Machere-Nagel, Germany) were used to extract total RNA from the mononuclear cells. The reverse transcription from RNA into cDNA was performed as previously described [Citation20], using random hexamer primers (final concentration: 5 ng/μL; Promega, USA), Moloney murine leukemia virus reverse transcriptase (final concentration: 10 U/μL; Promega), and the total RNA (2 μg/20 μL).
Real-time quantitative PCR
The PCR reactions and fluorescence measurements were performed using an ABI PRISM 7500 real-time PCR system (PE Applied Biosystems, USA). Levels of WT1 transcripts were measured using a TaqMan-based real-time quantitative PCR assay, as previously described [Citation20]. The ABL gene was used as the control gene, and samples with <3 × 10⁴ copies of ABL were considered poor quality. All experiments were performed in duplicate, and the quantitative WT1 expression levels were calculated as: WT1 copies/ABL copies (%).
Definition of WT1 overexpression
We have previously established that the upper limit of normal for WT1 expression levels in bone marrow is 0.5% [Citation20]. Therefore, we defined 5 × 10⁻³ as the cut-off value for bone marrow, and all samples with higher values were defined as ‘overexpression’. The portion of patients exposing a WT1 mRNA overexpression was defined as ‘WT1 overexpression rate’.
Statistical analysis
Patient characteristics were evaluated using descriptive statistics. The rates of positivity were compared using chi-square test or Fisher’s exact test, and qualitative variables were assessed using Student’s t-test. All P-values were two-sided and values of ≤0.05 were considered statistically significant. All analyses were performed using SPSS software (version 16; SPSS Inc., Chicago, IL).
Results
WT1 expression in children with MDS
The patients’ characteristics at their diagnosis are shown in . Ninety-four children with MDS were categorized according to their disease subtype, and their WT1 mRNA levels and overexpression rates are shown in . Three MDS-RCC cases were excluded because they provided weak results for the control gene (ABL). Among the remaining 80 evaluable patients with MDS-RCC, 31 patients (38.75%) exhibited WT1 overexpression and 49 children (61.25%) exhibited normal WT1 expression. All 6 patients with MDS-RAEB (100%) and 3 patients with JMML (60%) exhibited WT1 overexpression. There was significant difference in the WT1 overexpression rate for the RCC and RAEB subgroups (P = 0.005), while the difference was not significant between RCC and JMML (P = 0.313). However, there were no significant differences in the mean WT1 expression levels for the RCC, RAEB and JMML subgroups (P = 0.178, P = 0.501 and P = 0.485, respectively). ()
Table 1. Characteristics of the patients with myelodysplastic syndrome and aplastic anemia at their diagnosis.
Table 2. Wilms’ tumor 1 mRNA expression in bone marrow from patients with myelodysplastic syndrome and aplastic anemia.
WT1 expression in MDS-RCC cases with/without clonal chromosomal aberration
Twenty-four out of 80 children with MDS-RCC (30%) exhibited clonal chromosomal aberrations, based on the chromosome banding analyses and/or fluorescence in situ hybridization. Six of these patients (25%) exhibited WT1 overexpression, compared to 25 of 56 patients (44.64%) without clonal chromosomal aberrations (). The difference in the overexpression rate was not significant when we compared childhood MDS-RCC cases with and without abnormal cytogenetics (P = 0.079, χ2 = 2.731). showed that the mean WT1 expression levels were not significantly different when we compared MDS-RCC cases with and without clonal chromosomal aberrations (P = 0.459).
Table 3. Wilms’ tumor 1 mRNA expression in bone marrow from patients of refractory cytopenia of childhood with normal or abnormal cytogenetics and with hypoplastic or hyperplastic bone marrow.
WT1 expression in MDS cases with hypocellular or hypercellular bone marrow
Twenty-nine out of 80 children with MDS-RCC (36.25%) exhibited hypocellular bone marrow and 11 of these patients (37.93%) exhibited WT1 overexpression. Similarly, 20 of the 51 patients (39.22%) with hypercellular bone marrow exhibited WT1 overexpression (). This difference was not significant (P = 0.910, χ2= 0.013). Furthermore, the mean expression values for WT1 were not significantly different when we compared MDS-RCC cases with hypocellular or hypercellular bone marrow (P = 0.574).
WT1 expression in children with AA
The 124 children with AA were categorized according to their disease subtype, and their mean WT1 mRNA expression levels were shown in . Thirteen of the 73 patients (17.81%) with NSAA exhibited WT1 overexpression, although 4 patients with NSAA were excluded because of weak results for the control gene (ABL). Twenty-six of the 27 patients (96.3%) with SAA exhibited evaluable results, although only 1 of 26 patients (3.85%) with SAA exhibited WT1 overexpression. There were 17 evaluable results among patients with VSAA, although none of these patients exhibited WT1 overexpression. There were no significant differences when we compared WT1 overexpression rate between NSAA and SAA cases (P = 0.069) and between NSAA and VSAA cases (P = 0.052). The mean WT1 mRNA expression levels of the different subgroups had also been compared. showed that the NSAA cases exhibited significantly higher WT1 expression levels, compared to SAA cases (P = 0.028) and VSAA cases (P = 0.002). Furthermore, WT1 expression levels were significantly higher in SAA cases, compared to VSAA cases (P = 0.002).
Comparing WT1 expression between RCC cases and the AA subtypes
The WT1 overexpression rates and expression levels for the RCC, NSAA, SAA and VSAA groups are shown in . The WT1 overexpression rate of RCC was 38.75% and the rate of NSAA, SAA and VSAA was 17.81%, 3.85% and 0% respectively. Significant differences in the overexpression rates (all, P < 0.05) were observed when we compared the RCC group with the AA subtypes. However, no significant differences in the mean WT1 expression levels were observed when we compared the RCC group with the AA subtypes (P = 0.156, P = 0.373 and P = 0.455, respectively).
Table 4. Comparing Wilms’ tumor 1 mRNA positivity and expression levels in the refractory cytopenia of childhood and aplastic anemia subtypes.
Comparing WT1 expression between AA and RCC with or without abnormal cytogenetics
Among the 80 patients with MDS-RCC and evaluable WT1 results, 24 patients (30%) had RCC with abnormal cytogenetics and 56 patients (70%) had RCC with normal cytogenetics. Patients with RCC and normal cytogenetics exhibited significantly greater WT1 overexpression, compared to the AA subtypes (all, P < 0.05) (). However, there were no significant differences in the mean levels of WT1 expression when we compared cases of RCC with normal cytogenetics and the AA subtypes (all, P > 0.05). Similarly, patients with RCC and abnormal cytogenetics exhibited greater WT1 overexpression, compared to the AA subtypes except of the NSAA subgroup. The patients with RCC and abnormal cytogenetics also exhibited higher WT1 expression levels, compared to the AA subtypes (all, P < 0.05) ().
Table 5. Comparing Wilms’ tumor 1 mRNA positivity and expression levels between refractory cytopenia of childhood (with normal or abnormal cytogenetics) and aplastic anemia subtypes.
Identifying a cut-off value to differentiate between RCC and NSAA
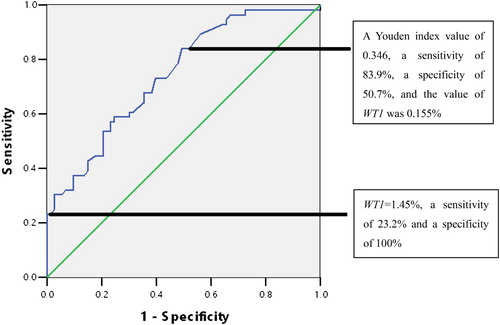
We performed receiver operating characteristic (ROC) curve analysis, and found that WT1 mRNA expression in bone marrow was useful for differentiating between RCC with normal cytogenetics and NSAA. These analyses revealed a Youden index value of 0.346, a sensitivity of 83.9%, a specificity of 50.7% and the value of WT1 expression was 0.155%. When the cut-off value for WT1 expression was set at 1.45%, it provided a sensitivity of 23.2% and a specificity of 100% (). The AUC (area under curve) was 0.743.
Figure 1. The receiver operating characteristics (ROC) curve for identifying refractory cytopenia of childhood (RCC) with normal cytogenetics and non-severe aplastic anemia (NSAA) (AUC: 0.743). A Youden index value of 0.346, a sensitivity of 83.9%, a specificity of 50.7% and the value of WT1 was 0.155%.
Comparing WT1 expression levels in AA and MDS after IST or bone marrow transplantation
We also followed 20 children with AA and 35 children with MDS () to evaluate their changes in WT1 transcript expression after IST or bone marrow transplantation. Patients with MDS-RCC who failed the IST exhibited significantly higher WT1 expression levels after the treatment compared to before the IST (P = 0.029).
Table 6. Wilms’ tumor 1 mRNA expression levels before and after immunosuppressive therapy.
Discussion
Several studies found that WT1 expression appears to be up-regulated in patients with MDS, and the level of expression increases with disease progression [Citation10,Citation11,Citation17]. Baba et al. and Cilloni D et al. have reported that patients with RA exhibited significantly lower WT1 expression levels, compared to patients with RAEB [Citation10,Citation21]. The same relationship is observed in childhood MDS cases [Citation22,Citation23]. In the present study, WT1 overexpression was observed in 38.75% of the children with RCC and in all children with RAEB. The difference is statistically significant. But the mean WT1 expression level of the RCC group was a little higher than that of the RAEB group and there was no significant difference. This result is contrary to the results of previous studies, which may be attributed to the small number of children in the RAEB group.
Nagasaki et al. and Cilloni et al. have shown in adult patients that the presence of poor prognostic chromosomal rearrangements and high IPSS score is associated with overexpression of WT1 mRNA. [Citation10,Citation24] But in the present study, no significant difference was found between the two groups of RCC patients with normal or abnormal cytogenetics, regardless of WT1 overexpression rate or WT1 expression level. The probable reason is that among the 24 RCC children with abnormal cytogenetics, only 2 children have cytogenetic abnormalities associated with poor prognosis, such as chromosome 7 deletion and complex chromosomal abnormalities.
On the other hand, there is little information regarding WT1 expression in patients with AA, especially in childhood AA cases. Whether the expression of WT1 is different in AA and MDS patients is also unclear. Yamauchi et al. evaluated WT1 expression in peripheral blood of 6 adults with AA and 13 patients with non-hematological conditions and found normal WT1 mRNA expression in 90% (17/19) of these patients [Citation11]. Iwasaki et al. have also reported that AA (7 cases) and RCC exhibit overlapping values for WT1 expression [Citation8]. In the present study, the WT1 overexpression rate in AA was only 12.07%, which was significantly lower than that of patients with MDS. The mean WT1 expression level of AA patients was also significantly lower than that of MDS. Therefore, WT1 gene detection may have certain clinical significance for the differential diagnosis of children with AA and MDS.
Interestingly, as shown in , we found gradually decreasing rates of positivity in the NSAA, SAA and VSAA cases (17.81%, 3.85% and 0%, respectively), as well as gradually decreasing expression levels (0.27%, 0.13% and 0.03%, respectively). These results suggest that WT1 expression in children with AA may be related to the degree of bone marrow hyperplasia. But when we compared the WT1 expression in RCC children with hypocellular or hypercellular bone marrow, no significant differences were found. Perhaps we can speculate that WT1 overexpression in MDS-RCC patients may offset the effect of bone marrow proliferation on WT1 levels.
RCC is the earliest subtype of MDS in children, and is very difficult to differentiate between RCC and NSAA in this population, especially between RCC with normal cytogenetics and NSAA [Citation25]. Our results showed that WT1 expression may be useful for differentiating between NSAA and RCC, based on the significant differences in WT1 overexpression rate when we compared RCC and the AA subtypes, and RCC with normal cytogenetics and the AA subtypes. Although there was no significant difference in WT1 expression levels between these groups, if we set the cut-off value to 1.45%, it could provide a sensitivity of 23.2% and a specificity of 100%. Thus WT1 expression levels could be used to differentiate between cases of RCC with normal cytogenetics and NSAA in children.
In conclusion, the current study reveals the different characteristics of WT1 expression in children with MDS and AA, suggesting that WT1 expression may be a useful marker for differentiating between MDS and AA among children.
To the best of our knowledge, ours is the largest study to evaluate WT1 expression levels among children, although their complex clinical situation warrants a larger prospective clinical trial to identify the optimal diagnostic cut-off value and its stability after IST or bone marrow transplantation treatment.
Acknowledgments
This work was supported by a grant from the National Natural Science Fundation of China (81100339).
Disclosure statement
No potential conflict of interest was reported by the authors.
Additional information
Funding
References
- Hasle H, Niemeyer CM. Advances in the prognostication and management of advanced MDS in children. Br J Haematol. 2011;154:185–195. doi: 10.1111/j.1365-2141.2011.08724.x
- Young NS, Scheinberg P, Calado RT. Aplastic anemia. Curr Opin Hematol. 2008;15:162–168. doi: 10.1097/MOH.0b013e3282fa7470
- Elghetany MT. Myelodysplastic syndromes in children: a critical review of issues in the diagnosis and classification of 887 cases from 13 published series. Arch Pathol Lab Med. 2007;131:1110–1116.
- Koh Y, Lee HR, Song EY, et al. Hypoplastic myelodysplastic syndrome (h-MDS) is a distinctive clinical entity with poorer prognosis and frequent karyotypic and FISH abnormalities compared to aplastic anemia (AA). Leuk Res. 2010;34:1344–1350. doi: 10.1016/j.leukres.2010.03.001
- Mckenna RW. Myelodysplastic syndrome and myeloproliferative disorders in children. Am J Clin Pathol. 2004;122(Suppl 1):S58–S69.
- Niemeyer CM, Baumann I. Classification of childhood aplastic anemia and myelodysplastic syndrome. Hematology Am Soc Hematol Educ Program 2011;2011:84–89. doi: 10.1182/asheducation-2011.1.84
- Drummond IA, Madden SL, Rohwer-Nutter P, et al. Repression of the insulin-like growth factor II gene by the Wilms tumor suppressor WT1. Science. 1992;257:674–678. doi: 10.1126/science.1323141
- Iwasaki T, Sugisaki C, Nagata K, et al. Wilms’ tumor 1 message and protein expression in bone marrow failure and acute leukemia. Pathol Int. 2007;57:645–651. doi: 10.1111/j.1440-1827.2007.02153.x
- Boublikova L, Kalinova M, Ryan J, et al. Wilms’ tumor gene 1 (WT1) expression in childhood acute lymphoblastic leukemia: a wide range of WT1 expression level, its impact on prognosis and minimal residual disease monitoring. Leukemia. 2006;20:254–263. doi: 10.1038/sj.leu.2404047
- Cilloni D, Gottardi E, Messa F, et al. Significant correlation between the degree of WT1 expression and the international prognostic scoring system score in patients with myelodysplastic syndromes. J Clin Oncol. 2003;21:1988–1995. doi: 10.1200/JCO.2003.10.503
- Yamauchi T, Matsuda Y, Takai M, et al. Wilms’ tumor-1 transcript in peripheral blood helps diagnose acute myeloid leukemia and myelodysplastic syndrome in patients with pancytopenia. Anticancer Res. 2012;32:4479–4483.
- Shimada A, Taki T, Koga D, et al. High WT1 mRNA expression after induction chemotherapy and FLT3-ITD have prognostic impact in pediatric acute myeloid leukemia: a study of the Japanese Childhood AML Cooperative Study Group. Int J Hematol. 2012;96:469–476. doi: 10.1007/s12185-012-1163-1
- Ho PA, Alonzo TA, Gerbing RB, et al. The prognostic effect of high diagnostic WT1 gene expression in pediatric AML depends on WT1 SNP rs16754 status: report from the Children’s Oncology Group. Pediatr Blood Cancer. 2014;61:81–88. doi: 10.1002/pbc.24700
- Ueda Y, Mizutani C, Nannya Y, et al. Clinical evaluation of WT1 mRNA expression levels in peripheral blood and bone marrow in patients with myelodysplastic syndromes. Leuk Lymphoma. 2013;54:1450–1458. doi: 10.3109/10428194.2012.745074
- Qin YZ, Zhu HH, Liu YR, et al. PRAME and WT1 transcripts constitute a good molecular marker combination for monitoring minimal residual disease in myelodysplastic syndromes. Leuk Lymphoma. 2013;54:1442–1449. doi: 10.3109/10428194.2012.743656
- Woehlecke C, Wittig S, Arndt C, et al. Prognostic impact of WT1 expression prior to hematopoietic stem cell transplantation in children with malignant hematological diseases. J Cancer Res Clin Oncol. 2015;141:523–529. doi: 10.1007/s00432-014-1832-y
- Tamura H, Dan K, Yokose N, et al. Prognostic significance of WT1 mRNA and anti-WT1 antibody levels in peripheral blood in patients with myelodysplastic syndromes. Leukemia Res. 2010;34:986–990. doi: 10.1016/j.leukres.2009.11.029
- Baumanm I, Niemeyer CM, Bennett JM, et al. International agency for research on cancer. WHO classification of tumors of haematopoietic and lymphoid tissue. Geneva, Switzerland: World Health Organization; 2008; p. 104–107.
- Camitta BM, Thomas ED, Nathan DG, et al. Severe aplastic anemia: a prospective study of the effect of early marrow transplantation on acute mortality. Blood. 1976;48:63–70.
- Qin YZ, Zhu H, Jiang B, et al. Expression patterns of WT1 and PRAME in acute myeloid leukemia patients and their usefulness for monitoring minimal residual disease. Leukemia Res. 2009;33:384–390. doi: 10.1016/j.leukres.2008.08.026
- Baba M, Hata T, Tsushima H, et al. The level of bone marrow WT1 message is a useful marker to differentiate myelodysplastic syndromes with low blast percentage from cytopenia due to other reasons. Intern Med. 2015;54:445–451. doi: 10.2169/internalmedicine.54.3123
- Cheng YF, Zhang LP, Liu YR, et al. Clinical significance of the Wilms’ tumor 1 mRNA expression in childhood myelodysplastic syndrome. Zhonghua Xue Ye Xue Za Zhi. 2012;33:536–540. [in Chinese].
- Bader P, Niemeyer C, Weber G, et al. WT1 gene expression: useful marker for minimal residual disease in childhood myelodysplastic syndromes and juvenile myelo-monocytic leukemia? Eur J Haematol. 2004;73:25–28. doi: 10.1111/j.1600-0609.2004.00260.x
- Nagasaki J, Aoyama Y, Hino M, et al. Wilms tumor 1 (WT1) mRNA expression level at diagnosis is a significant prognostic marker in elderly patients with myelodysplastic syndrome. Acta Haematol. 2017;137(1):32–39. doi: 10.1159/000452732
- Glaubach T, Robinson LJ, Corey SJ. Pediatric myelodysplastic syndromes: they do exist!. J Pediatr Hematol Oncol. 2014;36:1–7. doi: 10.1097/MPH.0000000000000046