
ABSTRACT
Objective: Buffy coat and ficoll of bone marrow (BM) are viable options for the study of minimal residual disease (MRD) in multiple myeloma (MM). As yet, there is no data about the superiority of either sample types. Herein, we aimed to address this issue.
Methods: Forty pairs of ficolled BMs and BM buffy coats of 19 MM patients were studied for MRD by allele-specific oligonucleotide real-time quantitative PCR, with patient-specific primers/probes whenever appropriate.
Results: There were 41 pairs of MRD data for comparison analysis due to one patient with biclonal disease. MRD levels in ficolls and buffy coats were highly concordant (rs = 0.936, P < 0.0001), with 31 (76%) and seven (17%) pairs being concomitantly MRD-positive or -negative. On the other hand, apart from the 16 pairs being both MRD-negative, or -positive but not quantifiable in ficolls and buffy coats, majority (n = 22, 88%) had higher MRD levels in ficolled BMs than BM buffy coats. Furthermore, in 17 pairs, in which MRD was quantifiable in both, MRD levels in ficolled BMs were 3.1 times those of BM buffy coats (median, 567/105 vs. 184/105, P = 0.001).
Conclusion: Taken together, ficolled BM is more sensitive than BM buffy coat for MRD detection in MM, hence should be recommended.
Introduction
Bone marrow (BM) buffy coat and ficolled BM samples are two viable options for the detection of minimal residual disease (MRD) in multiple myeloma (MM) [Citation1–5]. BM buffy coat is obtained by a simple centrifugation of the BM aspirate, and contains most of the nucleated cells, including lymphocytes, monocytes and granulocytes, with all at various stages of maturation. On the other hand, ficolled BM, i.e. BM mononuclear cells, a mixture of differentially matured lymphocytes and monocytes, is isolated from the BM aspirate through density gradient centrifugation using a medium, e.g. Ficoll-Paque PLUS solution, whereby granulocytes are removed. Theoretically, compared with BM buffy coat, ficolled BM of MM is more concentrated with mononuclear cells including plasma cells, hence a preferred option for MRD study. However, ficolled BM sample may have incomplete recovery of all mononuclear cells [Citation6], hence loss of tumor cells left over in the residual mononuclear layer. There is as yet no systematic studies on the superiority of either sample types for MRD detection in MM. Herein, MRD levels in paired ficolled BMs and BM buffy coats were detected by allele-specific oligonucleotide real-time quantitative PCR (ASO RQ-PCR), using patient-specific primers/probes where appropriate [Citation7].
Materials and methods
Patient samples
Forty follow-up samples with paired ficolled BMs and BM buffy coats, of 19 MM patients who had identified clonality and ASO RQ-PCR applicable, were selected for this study. Samples were collected at various stages during treatment, including before autologous stem cell transplantation (ASCT, n = 12), after ASCT (n = 18), and after post-ASCT consolidation (n = 10). This study was approved by the Institutional Review Board of the University of Hong Kong/Hospital Authority Hong Kong West Cluster (reference number: UW 16-111) with informed consents.
BM buffy coats were obtained through centrifugation of whole BMs at 1800 g for 10 min. To obtain ficolled BMs, whole BMs were carefully layered on the top of Ficoll-Paque PLUS solution (GE Healthcare, Uppsala, Sweden) and centrifuged at 400 g for 40 min with brake off. And the second (from top) layer, which was thin and white, was extracted and washed once by 1× phosphate-buffered saline. Genomic DNA was extracted using QIAamp DNA Blood Mini Kit (Qiagen, Hilden, Germany), according to the manufacturer’s instructions.
MRD detection by ASO RQ-PCR
Clonality was detected by stepwise PCR for IGH VDJ, IGH DJ, and IGK VJ rearrangements as previously described [Citation7], or sequentially by IGH VDJ FR1 and FR2 multiplex [Citation8], FR3 singleplex [Citation9], IGH DJ multiplex [Citation8] and IGK VJ multiplex [Citation7] PCR reactions. ASO forward primer approach was adopted [Citation9, Citation10], with patient-specific reverse primers/probes used where appropriate [Citation7]. Plasmid DNA cloned with the patient-specific immunoglobulin (Ig) rearrangement was used to construct RQ-PCR standard curves. MRD was normalized by the albumin gene and finally expressed as the number of clonal Ig rearrangements per 105 cells [Citation7]. Data were interpreted according to the EuroMRD guidelines [Citation11].
Statistics
Because of the lack of normal distribution in MRD levels, the Spearman’s correlation, which is nonparametric, was adopted to analyze the correlation between MRD in paired ficolled BMs and BM buffy coats. The Wilcoxon signed-rank test was used to compare the difference of MRD levels between paired ficolled BM and BM buffy coats. P values were all two-tailed, and statistical significance was considered if P < 0.05. All statistics tests were performed on the IBM SPSS Statistics 19.0.0 (IBM Corporation, NY, U.S.A.).
Results
MRD levels detected by ASO RQ-PCR
As mentioned before, clonality was identified in all 19 MM patients. One patient had biclonal disease, in which two different Ig rearrangements were adopted as MRD targets. Hence, ASO RQ-PCR was performed for totally 20 Ig rearrangements. With the use of patient-specific primers/probes in majority (n = 12) and plasmid DNA for constructing standard curves, the sensitivity of ASO RQ-PCR was down to 10−5 (10−5 in eight, 5 × 10⁻⁵ in seven, and 10−4 in five). And the quantitative range was down to 5 × 10⁻⁵ (5 × 10⁻⁵ in two, 10−4 in 10, and 5 × 10⁻⁴ in eight), with a median slope of the standard curve being −3.52 (from −3.33 to −3.65).
In addition, there were three consecutive follow-up samples of the patient with biclonal disease. Therefore, there were totally 43 pairs of MRD data for the 40 paired samples. However, two pairs were not included for further analysis, because of the high deviation of CT among replicates (ΔCT > 1.5) when average CT was still within quantitative range of RQ-PCR standard curve. Therefore, 41 pairs of MRD data were used for comparison of MRD levels between ficolled BMs and BM buffy coats ().
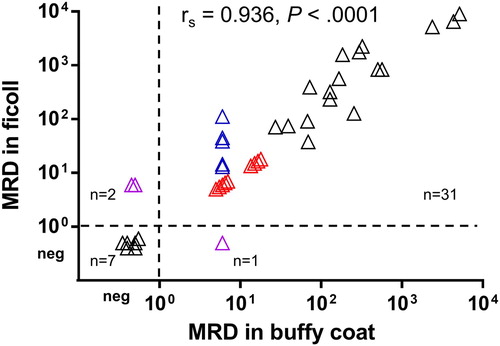
Figure 1. Correlation between MRD levels in paired ficolled BMs and BM buffy coats. Samples with MRD being PNQ were assigned values, as explained in main text, and shown in colors (blue, PNQ in buffy coats but quantifiable in ficolls; red, PNQ in both buffy coats and ficolls; pink, PNQ in either but MRD-negative in another). The result of Spearman’s correlation was shown. neg, MRD-negative. MRD levels were expressed as the number of clonal Ig rearrangements per 105 cells.
Correlation between MRD levels in paired ficolled BMs and BM buffy coats
To analyze the overall correlation between MRD levels in ficolled BMs and BM buffy coats of all these 41 pairs, samples with MRD being positive but not quantifiable (PNQ), as MRD levels were beyond the quantitative range of RQ-PCR, were assigned an MRD value of 6/105 for 10 samples, i.e. between the quantitative range (down to 1 × 10⁻⁴) and sensitivity (at least 5 × 10⁻⁵) of RQ-PCR in these cases; or 15/105 for another four samples, as the quantitative range and sensitivity of RQ-PCR in these case were 5 × 10⁻⁴ and 10−4, respectively.
Overall, MRD levels in paired ficolled BMs and BM buffy coats were highly concordant (rs = 0.936, P < 0.0001; ). Thirty-one (76%) pairs were both MRD-positive and seven (17%) were both MRD-negative. While the other three (7%) pairs had discordant MRD status, with MRD-positive in ficolled BMs but negative in BM buffy coats (n = 2), or vice versa (n = 1). Hence, the concordance of MRD status in paired ficolls and buffy coats was 93% ().
Differences in MRD levels between paired ficolled BMs and BM buffy coats
Firstly, among MRD-positive samples, MRD was quantifiable in some but read as PNQ in others when MRD levels were beyond the quantitative range of RQ-PCR standard curve. Indeed, there were 31 pairs being MRD-positive in both the BM buffy coats and ficolled BMs, in which MRD was both quantifiable in 17 pairs, both PNQ in nine, and quantifiable in the ficolled BMs but PNQ in the BM buffy coats in five pairs (). Of these 17 pairs with MRD levels being both quantifiable, MRD levels were higher in ficolled BMs than BM buffy coats in 15 pairs (). In addition, in another two pairs, MRD was PNQ in the ficolled BM but negative in BM buffy coats (). Overall, compared with BM buffy coats, ficolled BMs either yielded higher MRD levels or were more informative (PNQ vs MRD-negative) in 22 (54%) pairs. On the contrary, MRD levels were lower in ficolled BMs than BM buffy coats in three pairs, of which MRD levels in ficolled BMs were half of those in BM buffy coats in two pairs of samples from the same patient (# 9), in addition to being MRD-negative in the ficolled BM but PNQ in BM buffy coat in another pair ( and ).
Figure 2. Comparison of MRD levels in ficolled BMs and BM buffy coats in the 17 pairs of samples, in which MRD were quantifiable in both the ficolled BM and BM buffy coats. MRD levels in the BM buffy coat were set to 1.
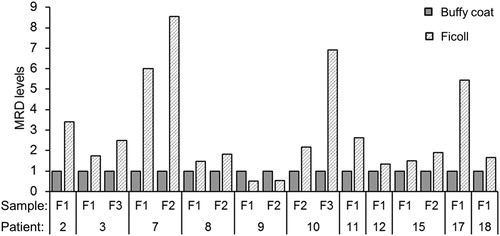
Table 1. Correlation between MRD levels in paired ficolled BM and BM buffy coat.
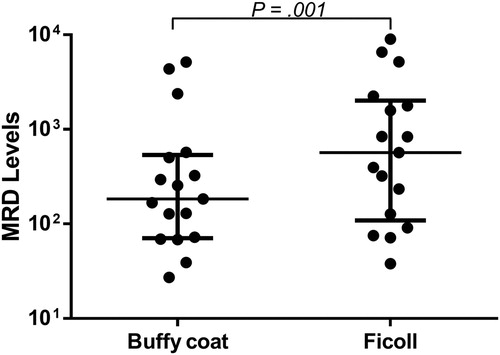
Furthermore, when the analysis was restricted to the 17 pairs with MRD both quantified, MRD levels in ficolls were 3.1 times those of paired buffy coats (median 567/105 vs. 184/105, P = 0.001; ).
Figure 3. MRD levels between paired ficolled BMs and BM buffy coats in the 17 pairs with MRD both quantified. Medians and interquartile ranges were indicated. P value was from Wilcoxon signed-rank test. MRD levels were expressed as the number of clonal Ig rearrangements per 105 cells.
Discussion
Sample preparation methods that enrich for mononuclear cells may affect the quantification of residual disease. As myeloma tumor DNA is likely to be concentrated by ficoll preparation that retains DNA from mononuclear cells only, the technique may impact on MRD level. Assuming 100% efficiency, hence all tumor DNA is recovered by either method, the concentration of myeloma DNA will be higher in ficolled BMs than BM buffy coats due to the dilution of tumor DNA by the more abundant DNA inherent with normal buffy coats. Therefore, when subjecting triplicates of 0.5 microgram DNA for ASO RQ-PCR, a lower MRD level would be expected in the BM buffy coats. The implication is that to compare the MRD levels in a cohort of patients, the same sample preparation method has to be utilized. For instance, when stratifying patients to high- or low-MRD groups based on a threshold, all MRD levels have to be determined by either ficolled BMs or BM buffy coats. Moreover, potentially some patients with positive but not quantifiable MRD in BM buffy coats will become quantifiable when using ficolled BMs. However, as our data show, MRD escalation by ficoll is modest only and unlikely to cause a 10-fold difference.
To the best of our knowledge, this is the first systematic study to compare the performance of ficolled BM and BM buffy coat for MRD detection, with ficolled BM shown to be more sensitive than BM buffy coat. As ficolled BM does not contain granulocytes, myeloma plasma cells would be concentrated and hence account for a higher proportion in ficolled BM than BM buffy coat. In this study, apart from the 16 pairs of samples that were not informative for comparison because of being both MRD-negative or PNQ in the ficolled BMs and BM buffy coats, majority (n = 22, 88%) of the informative pairs (n = 25) had higher MRD levels in ficolled BMs than paired BM buffy coats. Moreover, in the 17 pairs, in which MRD was quantifiable in both, MRD levels in ficolled BMs were about three times as high as those in BM buffy coats. Therefore, ficolled BM should be the preferred sample for MRD detection in MM.
Nonetheless, there are still limitations or considerations of ficolled BM. For instance, based on our experience, the amount of DNA extracted from ficolled BMs was generally lower than that from BM buffy coats, precluding some ficolled BMs with insufficient DNA for MRD detection. This may be accounted for by the exclusion of granulocytes and the probable poor recovery rate during ficoll preparation [Citation6]. Therefore, practically, ficolled BM would be recommended for MRD detection, while BM buffy coat should still be reserved as a backup in case that DNA is not sufficient for MRD detection in the ficolled BM. In addition, conceivably, there will be changes in the number of mononuclear cells during regeneration of the bone marrow after intensive chemotherapy such as autologous stem cell transplantation, hence a different relative concentration of myeloma tumor DNA during different time points of the clinical course. Therefore, MRD study is usually performed on Day 90 post-ASCT when marrow recovery has been complete, hence MRD interpretation generally comparable across samples and studies [Citation1, Citation3, Citation12]. On the other hand, red cell lysis method is popular in some laboratories [Citation13], which may potentially recover all nucleated cells, hence a higher tumor cell recovery than buffy coat preparation. Therefore, comparative studies of MRD detection with samples simultaneously prepared by red cell lysis and ficoll preparation are warranted.
In conclusion, our data showed that as compared with BM buffy coat, ficolled BM led to an apparent increase of sensitivity for MRD detection in MM due to the concentration of the myeloma tumor DNA.
Disclosure statement
No potential conflict of interest was reported by the authors.
Notes on contributors
Dr Yinlei Bai completed his PhD program on minimal residual disease detection in multiple myeloma under the supervision of Prof Chim. Currently, he is a postdoctoral research fellow in Tsinghua University, doing research in immunology.
Prof Chor Sang Chim is the SH Ho Professor in Hematology & Oncology at the University of Hong Kong, and Honorary Consultant to the Department of Medicine at Queen Mary Hospital. His research interests include epigenetic alterations in hematological malignancies and minimal residual disease detection in multiple myeloma. Moreover, Prof Chim is an international myeloma expert. He is a member of the International Myeloma Working Group (IMWG), Executive Council Member of Asian Myeloma Network (AMN), invited founding member of International Academy of Clinical Hematology (IACH), invited member of the Global Committee of the European Society for Blood & Marrow Transplantation (EBMT) & research advisor of the Nanyang Academy of Science. Locally, he is the Founding & current Chairman of the Hong Kong Society of Myeloma (HKSOM), and has spearheaded the establishment of the myeloma patient group, the Hong Kong Myeloma Care & Share.
ORCID
Chor Sang Chim http://orcid.org/0000-0003-2427-915X
Additional information
Funding
References
- Sarasquete M, Garcia-Sanz R, Gonzalez D, et al. Minimal residual disease monitoring in multiple myeloma: a comparison between allelic-specific oligonucleotide real-time quantitative polymerase chain reaction and flow cytometry. Haematologica. 2005;90(10):1365–1372.
- Silvennoinen R, Lundan T, Kairisto V, et al. Comparative analysis of minimal residual disease detection by multiparameter flow cytometry and enhanced ASO RQ-PCR in multiple myeloma. Blood Cancer J. 2014;4:e250. doi: 10.1038/bcj.2014.69
- Ladetto M, Ferrero S, Drandi D, et al. Prospective molecular monitoring of minimal residual disease after non-myeloablative allografting in newly diagnosed multiple myeloma. Leukemia. 2016;30(5):1211–1214. doi: 10.1038/leu.2015.269
- Ladetto M, Donovan JW, Harig S, et al. Real-Time polymerase chain reaction of immunoglobulin rearrangements for quantitative evaluation of minimal residual disease in multiple myeloma. Biol Blood Marrow Transplant. 2000;6(3):241–253. doi: 10.1016/S1083-8791(00)70006-1
- Rasmussen T, Poulsen TS, Honore L, et al. Quantitation of minimal residual disease in multiple myeloma using an allele-specific real-time PCR assay. Exp Hematol. 2000;28(9):1039–1045. doi: 10.1016/S0301-472X(00)00514-2
- Posel C, Moller K, Frohlich W, et al. Density gradient centrifugation compromises bone marrow mononuclear cell yield. PLoS One. 2012;7(12):e50293. doi: 10.1371/journal.pone.0050293
- Bai Y, Wong KY, Fung TK, et al. High applicability of ASO-RQPCR for detection of minimal residual disease in multiple myeloma by entirely patient-specific primers/probes. J Hematol Oncol. 2016;9(1):107. doi: 10.1186/s13045-016-0336-4
- van Dongen JJ, Langerak AW, Bruggemann M, et al. Design and standardization of PCR primers and protocols for detection of clonal immunoglobulin and T-cell receptor gene recombinations in suspect lymphoproliferations: report of the BIOMED-2 Concerted Action BMH4-CT98-3936. Leukemia. 2003;17(12):2257–2317. doi: 10.1038/sj.leu.2403202
- Verhagen OJ, Willemse MJ, Breunis WB, et al. Application of germline IGH probes in real-time quantitative PCR for the detection of minimal residual disease in acute lymphoblastic leukemia. Leukemia. 2000;14(8):1426–1435. doi: 10.1038/sj.leu.2401801
- van der Velden VH, de Bie M, van Wering ER, et al. Immunoglobulin light chain gene rearrangements in precursor-B-acute lymphoblastic leukemia: characteristics and applicability for the detection of minimal residual disease. Haematologica. 2006;91(5):679–682.
- van der Velden VH, Cazzaniga G, Schrauder A, et al. Analysis of minimal residual disease by Ig/TCR gene rearrangements: guidelines for interpretation of real-time quantitative PCR data. Leukemia. 2007;21(4):604–611. doi: 10.1038/sj.leu.2404586
- Korthals M, Sehnke N, Kronenwett R, et al. The level of minimal residual disease in the bone marrow of patients with multiple myeloma before high-dose therapy and autologous blood stem cell transplantation is an independent predictive parameter. Biol Blood Marrow Transplant. 2012;18(3):423–431. doi: 10.1016/j.bbmt.2011.07.002
- Puig N, Sarasquete ME, Balanzategui A, et al. Critical evaluation of ASO RQ-PCR for minimal residual disease evaluation in multiple myeloma. A comparative analysis with flow cytometry. Leukemia. 2014;28(2):391–397. doi: 10.1038/leu.2013.217