
ABSTRACT
Objective: To explore the activity of B subsets from Autoimmune Hemolytic Anemia/Evans syndrome (AIHA/ES) patients.
Methods: The expression of Bruton’s tyrosine kinase (BTK) and phosphorylated BTK (p-BTK) on CD5+CD19+B and CD5-CD19+B lymphocytes were detected using flow cytometry in AIHA/ES patients with different disease states, healthy controls (HCs) and chronic lymphocytic leukemia (CLL) patients. The correlations of expressed BTK and p-BTK with clinical variables were analyzed.
Results: Thirty six AIHA/ES patients (16 hemolytic, 20 remission), 11 CLL patients, and 15 HCs were enrolled. The expression levels of BTK and p-BTK on CD5+B lymphocytes in AIHA/ES patients were higher than those in HCs and CLL patients. The latter two groups had no significant difference, and were positively correlated with the quantity of IgE. The ratio of p-BTK to BTK on CD5+B lymphocytes of the hemolytic and remission groups was obviously higher than that on CD5-B lymphocytes (74.62 ± 6.42% and 29.63 ± 10.19%, respectively; P = 0.001 versus 77.95 ± 9.57% and 26.29 ± 6.86%, respectively; P = 0.006). The ratio of p-BTK to BTK on CD5+B lymphocytes (54.89 ± 9.56%) and CD5-B lymphocytes (30.86 ± 12.47%) did not differ significantly in HCs (P = 0.109). BTK did not differ significantly between CD5+ and CD5-B lymphocytes in AIHA/ES, but p-BTK on CD5+B lymphocytes was significantly higher than that on CD5-B lymphocytes in AIHA/ES patients.
Conclusions: CD5+B lymphocytes are the major B subtype that is activated in AIHA/ES patients and it positively correlates with IgE.
1. Introduction
Autoimmune hemolytic anemia (AIHA) is an immune disease characterized by antibodies directed against autologous red blood cells (RBCs). Evans syndrome (ES) is accompanied with thrombocytopenia because of autoantibodies with platelets. Both AIHA and ES have a similar pathogenesis that features activated B lymphocytes. The survival, activation, and differentiation of B cells are regulated by the B cell antigen receptor (BCR). Bruton’s tyrosine kinase (BTK) is a member of the Tec family of kinases. BTK is a key component of the precursor-BCR signaling pathway. BTK directly promotes the production of messenger molecules, abnormally activates the BCR signaling pathway, transforms B cells into self-reactive B cells, and causes autoimmune disease [Citation1]. The increased activity of BTK has been confirmed in systemic lupus erythematous [Citation2] and rheumatoid arthritis [Citation3] and has been associated with the severity of these diseases. It is conceivable that BTK plays a role in the pathogenesis of AIHA/ES.
B lymphocytes comprise CD5+ and CD5-B lymphocytes. B lymphocytes, especially CD5+B lymphocytes, is significantly increased in the peripheral blood of AIHA/ES patients [Citation4] and the quantity of CD5+B lymphocytes is correlated with the severity of AIHA/ES [Citation5]. CD5+B lymphocytes that are activated in AIHA/ES are reportedly not identical to the characteristic clonal CD5+ B lymphocytes in CLL patients and in healthy controls (HCs) [Citation4]. It is conceivable the expression of BTK in CD5+ and CD5-B lymphocytes are not same and maybe produce B subtypes having different functions.
Presently, we investigated the BTK in B subtypes in AIHA/ES patients. We examined the expression of BTK and phosphorylated BTK (p-BTK) on CD5+ and CD5-B lymphocytes in the peripheral blood of AIHA/ES patients and compared them with the expression levels in CLL patients.
2. Patients and methods
2.1. Patients and HCs
Patients with AIHA/ES and CLL were hospitalized in the Department of Hematology, Tianjin Medical University General Hospital, Tianjin, China, between October 2017 and June 2018. All AIHA/ES patients met Chinese expert consensus on the diagnosis and treatment of autoimmune hemolytic anemia (2017) [Citation6] and CLL patients met International Workshop on CLL (IWCLL) criteria [Citation7]. The enrolled AIHA/ES patients included 16 hemolysis group patients (ES: 0 males, females 2; AIHA: 0 males, 14 females) with a median age of 54 (range, 19–73) years, and 20 remission group patients (ES: 4 males, 4 females; AIHA: 4 males, 8 females) with a median age of 58 (range, 18–83) years. All AIHA/ES were primary cases. Eleven CLL patients were included as clonal disease controls, and included 6 males and 5 females with a median age of 67 (range, 52–78) years. Fifteen healthy volunteers were included as HCs, including 4 males and 11 females with a median age of 35 (range, 24–72) years. The study was approved by the Ethics Committee of Tianjin Medical University General Hospital. Signed informed consent was obtained from all patients and normal controls in accordance with the Declaration of Helsinki of the World Medical Association.
2.2. Flow cytometry
The following fluorophore-conjugated monoclonal antibodies were used (all from BD Biosciences, Franklin Lakes, NJ, U.S.A.): phycoerythrin (PE)-conjugated anti-BTK, anti-p-BTK, and anti-IgG1; allophycocyanin (APC)-conjugated anti-CD19; and fluorescein isothiocyanate (FITC)-conjugated anti-CD5 and anti-IgG1. Erythrocyte lytic solutions and IntraSure Kit reagent A and IntraSure Kit reagent B were also from BD Biosciences. All flow cytometry analyses were performed on a FACSCalibur flow cytometer (BD Biosciences).
Expression of BTK and p-BTK in CD5+ and CD5-B lymphocytes in peripheral blood was detected by flow cytometry. Antibodies against mouse IgG1-FITC, mouse IgG1-APC, and mouse IgG1-PE were stained as the negative control. Fresh EDTA anticoagulant blood samples were stained with antibodies against CD19-APC and CD5-FITC, and their negative control antibodies in the dark at 4°C for 30 min. Subsequently, the cells were incubated with 1 ml erythrocyte lytic solution for 10 min in the dark at room temperature and washed with phosphate buffer saline (PBS). The cells were then fixed in IntraSure Kit reagent A for 5 min and permeabilized with Kit reagent B for 10 min at room temperature and washed two times with PBS. Antibodies against BTK-PE and p-BTK-PE were incubated in separate test tubes, and anti-mouse IgG1-PE were stained in the negative control in the dark at 4°C for 30 min. The cells were then washed twice with PBS. Finally, 20,000 cells were acquired on a FACS Calibur flow cytometer and analyzed by CellQuest software version 3.1 (BD Biosciences).
2.3. Statistical analyses
Data were expressed as percentages of patients or means as appropriate. The independent-samples t test was used for the comparison of two groups. The correlation between clinical indices and BTK/p-BTK expression was tested by linear regression with the use of Spearman’s correlation coefficients. Statistical differences were considered to be significant at a value of P < 0.05. All analyses were conducted using SPSS version 21.0 software (SPSS, Chicago, IL, U.S.A.). GraphPad Prism 5 software (GraphPad, La Jolla, CA, U.S.A.) was used to visually depict the statistical analyses.
3. Results
3.1. Percentage of CD5+BTK+ B lymphocytes in peripheral blood and correlation between BTK and clinical variables
The ratio of CD19+CD5+BTK+ to CD19+CD5+B lymphocytes of the hemolytic group (44.56 ± 7.79%, P < 0.0001) and the remission group (46.18 ± 8.37%, P < 0.0001) were obviously higher than that in HCs (2.98 ± 0.53%) and CLL patients (1.07 ± 0.41%). The difference between the hemolytic and remission groups was not significantly different (P = 0.891). The ratio of CD19+CD5+BTK+ to CD19+B lymphocytes of the hemolytic group (10.60 ± 4.30%, P < 0.0001) and remission group (14.06 ± 5.43%, P < 0.0001) were obviously higher than that in HCs (0.67 ± 0.09%) and the CLL group (0.53 ± 0.20%). The difference between the hemolytic and remission groups was not significantly different (P = 0.634) (, ).
Figure 1. The expression of BTK/p-BTK in B lymphocyte was measured by flow cytometer. AE: Hemolytic group BF: remission group CG: Healthy Controls DH: CLL group.
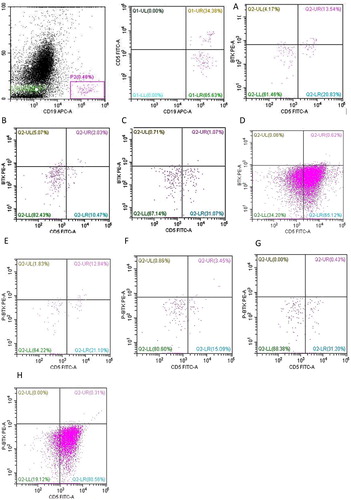
Table 1. CD5+BTK+B/CD5+p-BTK+B lymphocytes in peripheral blood.
In the hemolytic group, the ratio of CD19+CD5+BTK+ to CD19+CD5+B lymphocytes was positively correlated with IgE, and were not correlated with other parameters such as RBC, hemoglobin, and the percentage and quantity of Ret, LDH, IBIL, TBIL, DBIL, FHb, Hp, C3, C4, IgG, IgM, IgA and C-reactive protein (). The ratio of CD19+CD5+BTK+ to CD19+B lymphocytes was also positively correlated with IgE and was not correlated with other clinical parameters ().
Table 2. The relationship of CD19+CD5+BTK+/CD19+CD5+B with Clinical Variables in hemolytic group.
Table 3. The relationship of CD19+CD5+BTK+/CD19+B with clinical variables in hemolytic group.
In the remission group, the ratio of CD19+CD5+BTK+ to CD19+CD5+B lymphocytes was a positive correlation with LDH (P = 0.021) and was not related with other clinical parameters.
3.2. Percentage of CD5+p-BTK+ B lymphocytes in peripheral blood and correlation between p-BTK and clinical variables
The ratio of CD19+CD5+p-BTK+ to CD19+CD5+B lymphocytes of the hemolytic group (30.81 ± 7.16%, P < 0.0001) and the remission group (23.37 ± 8.02%, P < 0.001) were significantly higher than that in HCs (1.71 ± 0.58%) and CLL patients (0.41 ± 0.14%). The difference between the hemolytic and remission group was not significantly different (P = 0.499). The ratio of CD19+CD5+p-BTK+ to CD19+B lymphocytes of the hemolytic group (3.33 ± 0.94%, P < 0.0001) and remission group (2.32 ± 0.40%, P < 0.0001) were significantly higher than that in HCs (0.34 ± 0.06%) and CLL patients (0.30 ± 0.11%). The difference between the hemolytic and remission groups was not significantly different (P = 0.4636). The ratio of CD19+CD5+p-BTK+ to CD19+B lymphocytes of the hemolytic group and remission group were clearly higher than that of CLL patients (P < 0.001) (, ).
In the hemolytic group, the ratio of CD19+CD5+p-BTK+ to CD19+CD5+B lymphocytes was positively correlated with IgE (P = 0.003), and was not correlated with other clinical indices ().
Table 4. The relationship of CD19+CD5+p-BTK+/CD19+CD5+B with clinical variables in hemolytic group.
3.3. Percentage of CD5-BTK+ B lymphocytes and correlation between BTK and clinical variables
The ratio of CD19+CD5-BTK+ to CD19+CD5-B lymphocytes of the hemolytic group (12.37 ± 5.81%, P = 0.003) and the remission group (21.75 ± 7.98%, P = 0.002) were obviously higher than that in HCs (0.37 ± 0.13%) and CLL patients (0.24 ± 0.18%). The difference between the hemolytic and remission groups was not significantly different (P = 0.371). The ratio of CD19+CD5-BTK+ to CD19+B lymphocytes of the hemolytic group (5.26 ± 2.43%, P = 0.003) and the remission group (15.98 ± 6.26%, P = 0.001) were higher than that in HCs (0.26 ± 0.09%) and CLL patients (0.12 ± 0.11%). The difference between the hemolytic and remission groups was not significantly different (P = 0.153) (, ).
Table 5. CD5-BTK+B/CD5-p-BTK+B lymphocytes in peripheral blood.
No significant correlation between the ratio of CD19+CD5-BTK+ to CD19+CD5-B lymphocytes and clinical parameters in the hemolytic group was observed. The ratio of CD19+CD5-BTK+ to CD19+B lymphocytes was positively correlated with IgE (P = 0.003).
The ratio of CD19+CD5-BTK+ to CD19+CD5-B lymphocytes of patients in the remission group were positively correlated with lactate dehydrogenase (P = 0.001) and age (P = 0.039), and were inversely correlated with RBCs (P = 0.020).
3.4. Percentage of CD5-p-BTK+ B lymphocytes in PB and correlation between p-BTK and clinical variables
The ratio of CD19+CD5-p-BTK+ to CD19+CD5-B lymphocytes of hemolytic group (1.22 ± 0.52%) was higher than that of HCs, but without any significant difference between the two groups (P = 0.425). The ratio of CD19+CD5-p-BTK+ to CD19+CD5-B lymphocytes of remission group (1.08 ± 0.25%, P = 0.017) was significantly higher than that of HCs. The ratio of CD19+CD5-p-BTK+ to CD19+CD5-B lymphocytes of hemolytic and remission patients showed no significant difference (P = 0.835).
The ratio of CD19+CD5-p-BTK+ to CD19+B lymphocytes of hemolytic group (1.15 ± 0.46%, P = 0.152) and HCs showed no significant difference. The ratio of CD19+CD5-p-BTK+ to CD19+B lymphocytes of remission group (0.89 ± 0.20%, P < 0.013) was significantly higher than that of HCs (0.26 ± 0.12%). There was no significant difference of the ratio of CD19+CD5-p-BTK+ to CD19+B lymphocytes of the hemolytic group and remission group (P = 0.649). The ratio of CD19+CD5-p-BTK+ to CD19+B lymphocytes of CLL patients and HCs showed no significant difference (P = 0.058) (, ).
The ratio of CD19+CD5-p-BTK+ to CD19+CD5-B lymphocytes and clinical parameters showed no correlations in the hemolytic group. The ratio of CD19+CD5-p-BTK+ to CD19+B lymphocytes of patients in the hemolytic group were positively correlated with IgG (P = 0.045) and IgE (P = 0.002) (). There was no significant relationship between the percentage of CD5-p-BTK+B lymphocytes and clinical parameters in the remission group.
Table 6. The relationship of CD19+CD5-p-BTK+/CD19+B with clinical variables in hemolytic group.
3.5. Ratio of p-BTK to BTK on CD5+ and CD5−B lymphocytes in peripheral blood
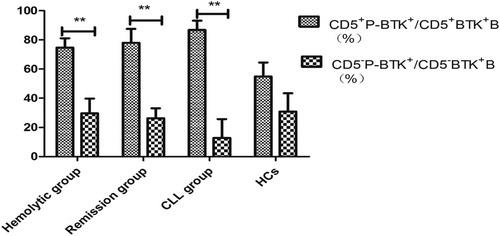
The ratio of p-BTK to BTK on CD5+B lymphocytes of the hemolytic group (74.62 ± 6.42%, P = 0.007) and remission group (77.95 ± 9.57%, P = 0.007) were obviously higher than that of the CLL group (37.46 ± 12.30%). The difference between the hemolytic and remission groups was not significantly different (P > 0.05). The ratio of p-BTK to BTK on CD5+B lymphocytes of the hemolytic group and remission group were each significantly higher than that on CD5-B lymphocytes (29.63 ± 10.19%, P = 0.001) and (26.29 ± 6.86%, P = 0.006).
The ratio of p-BTK to BTK on CD5+B lymphocytes of CLL group was higher than that on CD5-B lymphocytes (0.10 ± 0.10%, P = 0.007). The ratio of p-BTK to BTK on CD5+ and CD5−B lymphocytes showed no significant difference in HCs (54.89 ± 9.56% and 30.86 ± 12.47%, P = 0.109) ().
Figure 2. The ratio of p-BTK to BTK on CD5+B lymphocytes in hemolytic group, remission group and CLL was obviously higher than that on CD5-B lymphocytes. **P < 0.01.
3.6. Expression of BTK and p-BTK on CD5+ and CD5−B lymphocytes
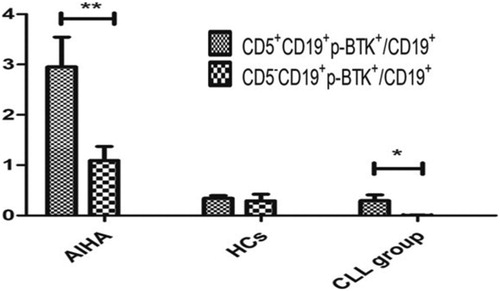
The ratio of CD5+CD19+BTK+ to CD19+B lymphocytes (12.52 ± 3.54%) and the ratio of CD5-CD19+BTK+ to CD19+B lymphocytes (11.21 ± 3.71%) of patients with AIHA/ES were not significantly different (P > 0.05). The ratio of CD5+CD19+p-BTK+ to CD19+B lymphocytes (2.95 ± 0.59%) was significantly higher than the ratio of CD5-CD19+p-BTK+ to CD19+B lymphocytes (1.04 ± 0.27%, P < 0.05) in AIHA/ES.
The ratio of CD5+CD19+BTK+ to CD19+B lymphocytes (0.67 ± 0.09%) was significantly higher than the ratio of CD5-CD19+BTK+ to CD19+B lymphocytes (0.26 ± 0.09%, P < 0.05) in HCs. The ratio of CD5+CD19+p-BTK+ to CD19+B lymphocytes (0.34 ± 0.06%) and the ratio of CD5-CD19+p-BTK+ to CD19+B lymphocytes (0.26 ± 0.12%) of patients with HCs showed no significant difference (P > 0.05).
The ratio of CD5+CD19+BTK+ to CD19+B lymphocytes (0.54 ± 0.20%) and the ratio of CD5-CD19+BTK+ to CD19+B lymphocytes (0.12 ± 0.11%) of the CLL group was not significantly different (P > 0.05). The ratio of CD5+CD19+p-BTK+ to CD19+B lymphocytes (0.30 ± 0.11%) was significantly higher than the ratio of CD5-CD19+p-BTK+ to CD19+B lymphocytes (0.01 ± 0.00%, P < 0.05) in the CLL group ( and ).
Figure 3. BTK expressions in CD5+ and CD5- lymphocytes from three groups. There is no different in AIHA CLL. **P < 0.01 *P < 0.05.
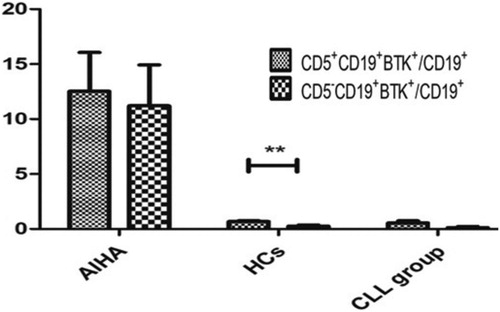
Figure 4. p-BTK expressions in CD5+ and CD5- B lymphocytes form three groups. p-BTK was higher in CD5+B lymphocytes than in CD5- B cells in AIHA and CLL patients **P < 0.01 *P < 0.05.
4. Discussion
BTK is a key kinase in the BCR signaling pathway and belongs to the Tec family of non-receptor tyrosine kinase, which is an important regulatory protein for the differentiation and development of B lymphocytes. As a kinase that directly promotes the production of messenger molecules in downstream of the signaling pathway, increased BTK will lead to abnormally activated BCR signaling. In particular, immune tolerance can be altered in the incapacitated B cells, which can be transformed into auto-reactive B cells, causing autoimmune disease. Odilia et al. [Citation8] have reported the increased expression of BTK in the peripheral blood of Sjogren syndrome and systemic lupus erythematosus patients, and related these increases to the rheumatoid factor levels of plasma, the infiltration of parotid T lymphocytes, urine protein levels, and the occurrence of lupus nephropathy. In this study, we examined the BTK and p-BTK of B cell subsets in the peripheral blood of patients with AIHA/ES.
B lymphocytes can be divided into two subsets: CD5+ and CD5-B lymphocytes. Sen et al. [Citation9] have suggested that the BCR signaling pathway has different effects in CD5+ and CD5-B lymphocytes. The activation of the BCR signaling pathway in CD5-B cells induces massive calcium mobilization and cell proliferation, while the activation of the BCR signaling pathway in CD5+B cells induces moderate intracellular calcium mobilization. Cells do not proliferate but undergo apoptosis. Presently, the expression of BTK on CD5+B lymphocytes in AIHA/ES patients was obviously higher than that of CLL patients and HCs, with the latter two groups displaying no significant difference. In addition, the expression of p-BTK on CD5+B lymphocytes in AIHA/ES patients was increased significantly by more than 70%. The increased number of CD5+B cells in the peripheral blood of patients with AIHA/ES may be due to the increased levels of BTK, especially the levels of p-BTK. Kil et al. [Citation10] have reported that overexpression of BTK induced increased numbers of B1 cells in the spleen of mice, while the activation of BTK could alter the immune tolerance of CD5+B lymphocytes. Presently, the expression of BTK and p-BTK on clonal CD5+B lymphocytes in peripheral blood were not discernably different between CLL patients and HCs, but the expression of BTK and p-BTK on clonal CD5+B lymphocytes in CLL patients were obviously lower than that of AIHA/ES patients. We speculate that the effect of BTK on CD5+B cells in AIHA/ES patients differs from that of BTK on clonal CD5+B cells in CLL patients.
No significant difference of the BTK expression between the CD5+ and CD5-B lymphocytes of the AIHA/ES patients was observed. However, the expression of p-BTK on CD5+B lymphocytes was significantly higher than that on CD5-B lymphocytes, suggesting that the number and function of CD5+B and CD5-B cell subgroups may be different in AIHA/ES patients.
We found that the proportion of BTK and p-BTK in CD5+B cells of AIHA/ES patients was positively correlated with IgE, but the quantity of eosinophils was not increased. IgE is not only related to allergic and parasitic infections, but is also closely related to the occurrence of AD [Citation11]. Auto-reactive IgE, detected in some autoimmune disease is associated with poor prognosis. Henault [Citation12] has found that DNA-IgE ICs functionally affected plasmacytoid dendritic cells (pDCs) by inducing maturation, antigen presentation, cellular migration, and the secretion of interferon-gamma and other proinflammatory cytokines. The responses were similar to or larger than those initiated by DNA-IgG complexes. In vitro co-cultures of pDCs and T cells have shown that IgE autoantibodies are capable of triggering antigen-dependent proliferation of CD8+T cells and the induction of interferon-gamma secretion to the same extent as IgG immune complexes. Furthermore, pDC and IgE complexes can promote B cell expansion and cell differentiation. Augusto et al. [Citation13] have showed that auto-reactive IgE presented in patients with systemic lupus erythematous exacerbated the progression of the disease. The role of auto-reactive IgE in the pathogenesis of AIHA/ES requires further investigation.
This study revealed a significant increment of BTK expression on CD5+ and CD5-B lymphocytes in AIHA/ES, but the degree of increase was significantly different. p-BTK on CD5+B cells was obviously higher than that on CD5-B cells. Many factors can regulate BTK. These include an inhibitor of BTK, which we identified as being bound to the pleckstrin-homology domain of BTK, and down-regulated the activity of BTK [Citation14]. Protein kinase C-beta, which phosphorylates BTK at the S180 serine residue in the TH domain, which modulates BTK membrane localization [Citation15]; and miR-185, overexpression of microRNA inhibited BTK mRNA in follicular B cells, thereby down-regulating BTK [Citation16]. The regulation of BTK in CD5+ and CD5-B lymphocytes may be different. Further studies are needed to identify whether there are other regulatory mechanisms of BTK in CD5+ and CD5-B lymphocytes.
In summary, BTK and p-BTK increases in the B lymphocytes of AIHA/ES patients. In the hemolysis group, BTK and p-BTK in CD5+ was higher than that of HCs and CLL. p-BTK in CD5+B cells was obviously higher than that in CD5-B lymphocytes of AIHA/ES patients, and was positively correlated with IgE.
Compliance with ethical standards
Conflict of interest: The authors declare that they have no conflict of interest.
Disclosure statement
No potential conflict of interest was reported by the authors.
Additional information
Funding
Related Research Data
References
- Corneth OBJ, Wolterink RGJK, Hendriks RW. BTK signaling in B cell differentiation and autoimmunity. Curr Top Microbiol Immunol. 2016;393(12):67–105.
- Liubchenko GA, Appleberry HC, Striebich CC, et al. Rheumatoid arthritis is associated with signaling alterations in naturally occurring autoreactive B-lymphocytes. J Autoimmun. 2013;40(1):111. doi: 10.1016/j.jaut.2012.09.001
- Iwata S, Tanaka Y. B-cell subsets, signaling and their roles in secretion of autoantibodies. Lupus. 2016;25(8):850–856. doi: 10.1177/0961203316643172
- Zhu H, Xu W, Liu H, et al. Expression of activated molecules on CD5+B lymphocytes in autoimmune hemalytic anemia. Int J Hematol. 2016;103(5):545–553. doi: 10.1007/s12185-016-1964-8
- Xing L, Zonghong S, Rong F, et al. CD5+B lymphocytes in the bone morrow of autoimmunic hemocytopenia patients and its clinical significance. Chinese J Pract Intern Med. 2005;25(11):39–41.
- Red Blood Cell Disease (Anemia) Group, Chinese Society of Hematology, Chinese Medical Association. Chinese expert consensus on the diagnosis and treatment of autoimmune hemolytic anemia. Chinese J Hematol. 2017;38(4):265–267.
- Hallek M, Cheson BD, Catovsky D, et al. Guidelines for diagnosis, indications for treatment, response assessment and supportive management of chronic lymphocytic leukemia. Blood. 2018;131(25):2745–2760. doi: 10.1182/blood-2017-09-806398
- Odilia BJ, Corneth OBJ, Verstappen GMP, et al. Enhanced Bruton’s tyrosine kinase activity in peripheral blood B lymphocytes of autoimmune disease patients. Arthritis Rheumatol. 2017 Jun;69(6):1313–1324. doi: 10.1002/art.40059
- Sen G, Bikah G, Venkataraman C, et al. Negative regulation of antigen receptor-mediated signaling by constitutive association of CD5 with the SHP-1 protein tyrosine phosphatase in B-1 B cells. Eur J Immunol. 1999;29 (10):3319–3328. doi: 10.1002/(SICI)1521-4141(199910)29:10<3319::AID-IMMU3319>3.0.CO;2-9
- Kil LP, de Bruijn MJ, van Nimwegen M, et al. Btk levels set the threshold for B-cell activation and negative selection of autoreactive B cells in mice. Blood. 2012;119(16):3744–3756. doi: 10.1182/blood-2011-12-397919
- Ettinger R, Karnell JL, Henault J, et al. Pathogenic mechanisms of IgE-mediated inflammation in self-destructive autoimmune responses. Autoimmunity. 2017;50(1):25–36. doi: 10.1080/08916934.2017.1280670
- Henault J, Riggs JM, Karnell JL, et al. Self-reactive IgE exacerbates interferon responses associated with autoimmunity. Nat Immunol. 2016;17:196–203. doi: 10.1038/ni.3326
- Augusto J-F, Truchetet M-E, Charles N, et al. Ige in lupus pathogenesis: friends or foes? Autoimmunity Rev. 2018;17:361–365. doi: 10.1016/j.autrev.2017.11.027
- Liu W, Quinto I, Chen X, et al. Direct inhibition of Bruton’s tyrosine kinase by IBtk, a Btk-binding protein. Nat Immunol. 2001;2(10):939–946. doi: 10.1038/ni1001-939
- Kang SW, Wahl MI, Chu J, et al. PKC beta modulates antigen receptor signaling via regulation of Btk membrane localization. EMBO J. 2001;20(20):5692–5702. doi: 10.1093/emboj/20.20.5692
- Belver L, de Yebenes VG, Ramiro AR. MicroRNAs prevent the generation of autoreactive antibodies. Immunity. 2010;33(5):713–722. doi: 10.1016/j.immuni.2010.11.010