
ABSTRACT
Objectives: The optimal iron level in hemodialysis (HD) patients remains unclear. The hemoglobin content of reticulocytes (CHr) is a sensitive indicator of iron used for hematopoiesis. To identify the optimal iron content for HD patients, we investigated the relation between CHr levels and iron status, as well as the levels of hepcidin, a main regulator of iron metabolism.
Methods: This study enrolled 181 HD outpatients treated with recombinant human erythropoietin (rHuEPO). A sensitivity analysis, using a generalized linear regression model that included the interaction term, was applied to determine the correlations between levels of CHr and those of serum ferritin (s-ft), transferrin saturation (TSAT), and hepcidin.
Results: The greatest changes in correlation coefficients for levels of s-ft and TSAT with CHr levels indicated optimal cut-off points of 50 ng/mL (≤50 ng/mL, r = 0.47 vs >50 ng/mL, r = 0.22) and 24% (≤24%, r = 0.58 vs >24%, r = 0.08), respectively. The correlation coefficient for levels of CHr and hepcidin showed that the optimal lower and upper cut-off points were 20 ng/mL (≤20 ng/mL, r = 0.52 vs >20 ng/mL, r = −0.01) and 70 ng/mL (≤70 ng/mL, r = 0.36 vs >70 ng/mL, r = −0.45), respectively.
Discussion: This study indicates that the amount of iron in HD patients is sufficient for hematopoiesis under conditions of low s-ft and moderate TSAT levels. High levels of hepcidin could induce negative iron metabolism in hematopoiesis.
Conclusion: Therefore, controlling hepcidin levels to within approximately 20–70 ng/mL may prevent iron deficiency and reduced Hb synthesis, and may thus facilitate effective iron utilization in hematopoiesis.
Introduction
Anemia is a complication encountered in almost all patients undergoing hemodialysis (HD), in whom it is treated with erythropoiesis-stimulating agents (ESAs) and iron supplements. The effective use of ESAs requires preventing not only iron deficiency but also an excess of iron, which induces oxidative stress [Citation1–3] and reduces iron utilization efficiency through hepcidin activation [Citation4]. Thus, maintaining optimum iron levels is a critical challenge.
During hematopoiesis in the bone marrow, iron is taken up from the blood and then binds to heme protein to form hemoglobin (Hb). Reticulocytes (Rets), immature red blood cells, are observed during hematopoiesis. Rets are released into the blood at 2–3 days following hematopoiesis and become mature red blood cells 1–2 days later. The hemoglobin content of reticulocytes (CHr level) is considered to reflect Rets’ greatest Hb synthesis potential, as well as the iron levels used in hematopoiesis. In addition, because the Hb level of Rets is measured directly, no factors apart from iron levels affect observed CHr levels.
However, because only a few devices can measure CHr levels, the iron management criteria for HD patients have been established by combinations of absolute serum ferritin (s-ft) and transferrin saturation (TSAT) values, according to current guidelines for Western countries and Japan. In healthy individuals, an s-ft level of <12–30 ng/mL is considered the cut-off for iron deficiency [Citation5,Citation6]. Currently, the Kidney Disease Outcome Quality Initiative has set an s-ft level of 200 ng/mL as the lower limit for iron management in HD patients receiving ESAs [Citation7], while the European Best Practice Guidelines (EBPG) [Citation8] and the Japanese Society for Dialysis Therapy guidelines (2015) [Citation9] have set the criteria for initiating the administration of iron supplements at an s-ft level of <100 ng/mL and a TSAT level of <20%. Thus, according to several guidelines, the indicators for iron management criteria in HD patients are set at relatively high levels compared with those in healthy individuals.
Previous research has shown positive correlations between levels of CHr and of both s-ft and TSAT [Citation10]. Conversely, some studies have also reported that, above a given CHr value, the administration of iron increases only the s-ft level, with almost no change in the CHr level [Citation11,Citation12]. Thus, we hypothesized that, although the CHr level depends upon in vivo iron levels up to a certain level, it remains unaffected at levels above these. As such, this study aimed to investigate in detail the correlations of CHr value with s-ft level, TSAT level, and Ret counts, and to determine the optimum iron level for hematopoiesis.
Meanwhile, iron metabolism is regulated by hepcidin, a peptide produced in the liver., Excess iron results in elevated levels of hepcidin, which suppress both export of iron from cells and iron uptake in the digestive tract. However, the optimum hepcidin level for efficient iron utilization in HD patients remains unclear. Consequently, we investigated the correlation between CHr and hepcidin levels to identify the optimum hepcidin levels for efficient iron utilization. Previously, we demonstrated a marked positive correlation between hepcidin and s-ft levels [Citation13]. Here, we attempted to infer the optimum s-ft level from hepcidin values using the findings of the present study.
Materials and methods
Patients
In total, 181 patients who were administered recombinant human erythropoietin (rHuEPO) and were undergoing maintenance HD at our institution in July 2006 were enrolled. All patients were undergoing 4–5 h of hemodialysis three times per week.
All patients provided informed consent, permitting data sampling and analysis at the time of initiation of dialysis therapy. The protocol for the study was approved by the ethics committee of the Biomarker Society, Inc., comprising 7 committees, which included outside experts.
Methods
All patients had been administered doses of rHuEPO calibrated to obtain a target Hb concentration of 10–11 g/dL for the treatment of anemia, as per the clinical guidelines of the Japanese Society for Dialysis Therapy. The criterion for initiating iron administration was an s-ft value of <30 ng/mL; iron was given in two to four administrations of ferric saccharate at a rate of 40 mg/week. Blood was collected only once, at each patient’s first dialysis of the week.
Red blood cell counts, Hb levels, hematocrit, Ret counts, and CHr levels were measured using an ADVIA 120 System (Bayer Diagnostics, Tarrytown, NY). In addition, s-ft and serum iron (Fe) levels, total iron-binding capacity (TIBC), and C-reactive protein (CRP) levels were assessed. TSAT values were calculated from Fe and TIBC levels (TSAT = Fe/TIBC × 100). Dialysis adequacy (Kt/V) was measured using the single-pool method. The bromocresol green method was employed to measure serum albumin (s-Alb) levels. Hepcidin levels were measured using the quantitative method of liquid chromatography, coupled with tandem mass spectrometry (LC-MS/MS) [Citation14].
Statistical analysis
Statistical analyses were performed with SAS software, version 9.4 (SAS Institute, Cary, NC, USA). Data are presented as the mean ± SD, as the median with interquartile range, or as proportions. To clarify the relationship between continuous variables, both linear and nonlinear regression models were applied. To determine optimal cut-off values, we performed sensitivity analyses with the use of Pearson’s correlation coefficient and a generalized linear regression model involving the interaction terms. The differences among the slopes in regression models were also tested using the generalized linear regression model with the interaction term. A two-tailed P value <0.05 was considered to indicate statistical significance. An independent statistical data center (STATZ Institute, Inc., Tokyo, Japan) performed all analyses.
Results
Patients
In total, 181 patients (115 men and 66 women; mean age, 59.9 ± 13.8 years old) were enrolled in this study. The median history of dialysis was 7.1 (3.4–11.9) years. The underlying etiologies included chronic glomerulonephritis (98 patients, 54.1%), diabetic nephropathy (48 patients, 26.5%), nephrosclerosis (16 patients, 8.8%), polycystic kidney disease (4 patients, 2.2%), rapidly progressive glomerulonephritis (3 patients, 1.7%), and others (12 patients, 6.6%).
The mean Hb concentration, corpuscular volume, corpuscular hemoglobin content, proportion of Rets, and CHr levels were 10.0 ± 0.7 g/dL, 94.7 ± 5.6 fL, 32.3 ± 2.1 pg, 17.2‰ ± 6.3‰, and 32.3 ± 2.1 pg, respectively. The median s-ft level was 61.7 (27.7–139.0) ng/mL, and the mean Fe, TIBC, and TSAT levels were 58.4 ± 19.2 μg/dL, 242.4 ± 42.3 μg/dL, and 24.7% ± 8.7%, respectively. The median CRP and mean rHuEPO values were 0.06 (0.03–0.27) mg/dL and 4707 ± 2381 IU, respectively ().
Table 1. Characteristics.
Correlation between CHr value and iron status
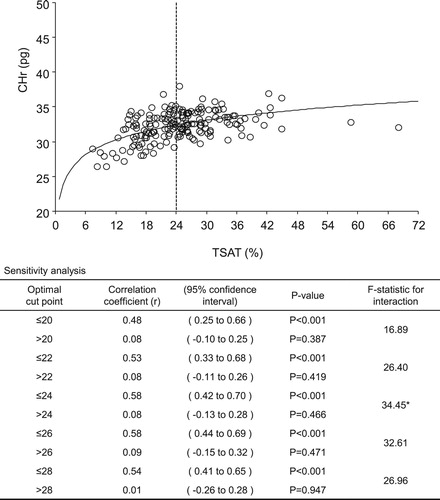
A sensitivity analysis of CHr levels for each 10 ng/mL of s-ft and each 2% of TSAT was performed. The correlation coefficients of s-ft and TSAT values for CHr levels showed the greatest changes at 50 ng/mL (≤50 ng/mL, r = 0.47 vs >50 ng/mL, r = 0.22; F-statistic: 17.64) and 24% (≤24%, r = 0.58 vs >24%, r = 0.08; F-statistic: 34.45), respectively ( and ). Thus, the optimal cut-off values for s-ft and TSAT were 50 ng/mL and 24%, respectively. shows the results of the sensitivity analysis for s-ft between the cut-off values of 30 and 70 mg/mL. CHr and s-ft levels exhibited a significant positive correlation in the ‘less-than’ groups within these cut-off values, with lower values of s-ft exhibiting higher correlation coefficients. However, this significant positive correlation was lost for cut-off values >60 ng/mL. shows the results of the sensitivity analysis for TSAT levels between 20% and 28%, exhibiting a significant positive correlation for all cut-off values in the ‘less-than’ groups, whereas a correlation was not determined for the ‘more-than’ groups.
Figure 1. Relationship and sensitivity analysis for serum ferritin level with hemoglobin content of reticulocytes (CHr). *Correlation coefficients of serum ferritin for CHr most greatly changed at 50 ng/mL (≤50 ng/mL, r = 0.47 vs >50 ng/mL, r = 0.22; F-statistic, 17.64).
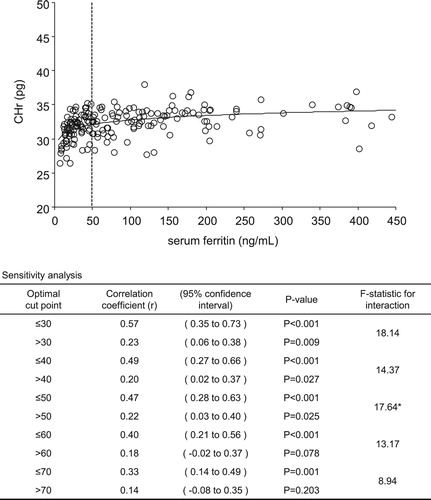
Figure 2. Relationship and sensitivity analysis for transferrin saturation level with hemoglobin content of reticulocytes (CHr). *Correlation coefficients of transferrin saturation for CHr most greatly changed at 24% (≤24%, r = 0.58 vs >24%, r = 0.08; F-statistic, 34.45).
Correlation between CHr and hepcidin levels
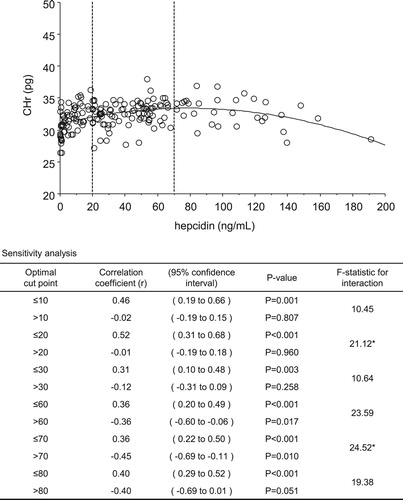
While a significant positive correlation was observed between CHr and hepcidin levels in the ‘less-than’ groups, a significant negative correlation was observed in the ‘hepcidin >60 ng/mL’ groups, demonstrating two inflection points.
The correlation coefficient for CHr and Hep25 levels changed the most at 20 ng/mL (≤20 ng/mL, r = 0.52 vs >20 ng/mL, r = −0.01; F-statistic: 21.12) and 70 ng/mL (≤70 ng/mL, r = 0.36 vs >70 ng/mL, r = −0.45; F-statistic: 24.52). Thus, the optimal cut-off points for the lower and upper values were 20 and 70 ng/mL, respectively ().
Figure 3. Relationship and sensitivity analysis for hepcidin level with hemoglobin content of reticulocytes (CHr). *Correlation coefficient of CHr and hepcidin most greatly changed at 20 ng/mL (≤20 ng/mL, r = 0.52 vs >20 ng/mL, r = −0.01; F-statistic, 21.12) and 70 ng/mL (≤70 ng/mL, r = 0.36 vs >70 ng/mL, r = −0.45; F-statistic, 24.52). Optimal cut-off points of under and upper values were 20 and 70 ng/mL, respectively.
Correlation between CHr level and Ret count/iron status
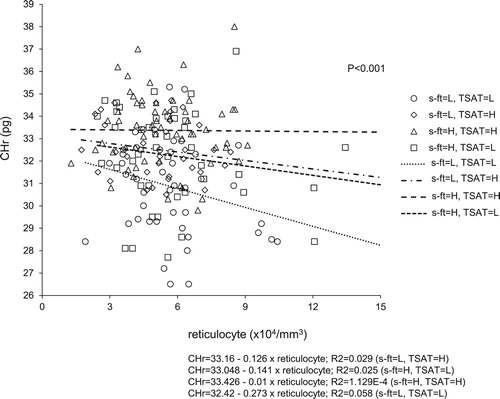
Each patient’s iron status was classified into one of four groups, based on s-ft and TSAT levels (LL: s-ft ≤50 mg/mL and TSAT ≤24%, LH: s-ft ≤50 mg/mL and TSAT >24%, HL: s-ft >50 mg/mL and TSAT ≤24%, HH: s-ft >50 mg/mL and TSAT >24%). The correlation between CHr level and Ret count revealed significant differences among the four groups on the basis of the slopes obtained by the linear regression analysis (P < 0.001).
The LL group exhibited the steepest slope, in which the CHr level was likely to decline as the Ret count increased. However, in the HH group, almost no change in CHr level was observed when the Ret count increased. In addition, even when the actual Ret count was low, the LL group exhibited the lowest CHr value, whereas the HH group exhibited the highest CHr value ().
Figure 4. Relationship of reticulocyte count with hemoglobin content of reticulocytes (CHr) by iron status. Groups were divided in four by serum ferritin (s-ft) and transferrin saturation (TSAT) levels. Slopes of curves obtained by linear regression were significantly different between the four groups. CHr count had no influence on CHr in the group with s-ft = H and TSAT = H. s-ft = L; ≤50 ng/mL, H; >50 ng/mL. TSAT = L; ≤24%, H; >24%.
Investigation of the correlation between hepcidin and s-ft levels
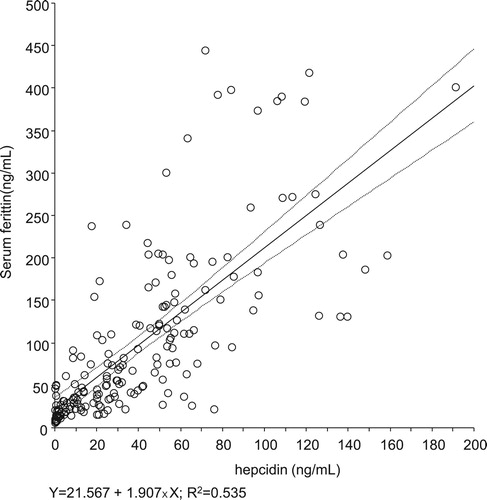
Hepcidin and s-ft values exhibited a significant positive correlation (r = 0.731, R2 = 0.535, p < 0.001; ). The s-ft values corresponding to 20 and 70 ng/mL of hepcidin, as predicted on the basis of the approximated line, were 59.7 mg/mL [95% confidence interval (CI): 48.5–70.9] and 155.1 mg/mL [95% CI: 142.6–167.5], respectively.
Figure 5. Relationship of levels of serum ferritin with hepcidin. Serum ferritin level showed strong positive correlation with hepcidin level (r = 0.731, R2 = 0.535, p < 0.001).
Discussion
The survival time of mature red blood cells (RBCs) is 120 days in healthy people. Although some studies have reported that RBC survival time in HD patients is shorter than that in healthy people [Citation15], Hb content is a poor indicator of the most recent Hb synthesis potential, which reflects supplied iron levels. CHr is reportedly a superior predictor of the iron levels used in the production of immature RBCs in real time. The measurements of CHr values are highly stable, with a low coefficient of variation [Citation16,Citation17]. In addition, previous studies have reported that the use of CHr levels is effective in diagnosing iron deficiency in HD patients using ESAs [Citation10,Citation18,Citation19].
Reportedly, the administration of iron supplements increases CHr values in patients with iron-deficient anemia [Citation20], and CHr values are assumed to depend on iron levels in an iron-deficient state. Conversely, since the administration of iron supplements does not increase CHr values in an iron-sufficient state [Citation20], in vivo iron levels above a certain value may be optimum for hematopoiesis. In other words, the level of iron at which the CHr value no longer depends upon iron levels may be defined as iron sufficiency.
The current guidelines for iron management in HD patients are based on s-ft and TSAT levels. Therefore, we evaluated the correlations of CHr with s-ft and TSAT levels to identify the optimal iron content for HD patients receiving rHuEPO. This study assessed changes in the correlation coefficients between the ‘less-than’ and ‘more-than’ groups to determine the inflection points in the correlation of CHr with s-ft and TSAT levels. Per our hypothesis, both s-ft and TSAT values demonstrated a significant positive correlation in the ‘less-than’ groups. However, this correlation was lost in the ‘more-than’ groups. Changes in the correlation coefficients in the ‘less-than’ and ‘more-than’ groups were the greatest when the cut-off values for s-ft and TSAT levels were set at 50 ng/mL and 24%, respectively. In other words, if both s-ft and TSAT levels are less than 50 ng/mL and 24%, respectively, the CHr content would depend on iron levels, highlighting the possibility of iron deficiency. Conversely, if they are greater than the abovementioned figures, s-ft and TSAT are likely to be at iron-sufficient levels for hematopoiesis. Furthermore, when comparing the correlation coefficients for CHr levels within the ‘less-than’ groups, the value in the ‘TSAT ≤24%’ group was greater than that in the ‘s-ft ≤50 ng/mL’ group. This result could be attributed to the s-ft value indicating stored iron levels, whereas the TSAT value indicates available iron levels for hematopoiesis. Thus, the TSAT level exerts a greater effect on CHr content than does the s-ft level.
Moreover, ESA therapy may induce an increase of the actual Ret count in HD patients. While investigating the correlation between CHr content and the actual Ret count, as classified by iron status, CHr levels indicated almost no change in the ‘s-ft >50 ng/mL and TSAT >24%’ group – despite increases in the actual Ret count. This result suggests that this state might have optimum iron levels for hematopoiesis, regardless of the changes in actual Ret count.
Next, we assessed the correlation between the levels of CHr and hepcidin, which governs iron metabolism. Hepcidin controls ferroportin levels, facilitating the export of iron from cells, and thereby controlling in vivo iron kinetics. Ferroportin is degraded when hepcidin binds to it, suppressing the supply of iron from the cells to the blood. Consequently, high hepcidin levels trap iron in cells and suppress iron absorption in the intestines, thereby reducing the supply of iron for hematopoiesis [Citation4]. In this study, the correlation between CHr and hepcidin levels was found to have two cut-off values. In the ‘hepcidin ≤20 ng/mL’ group, hepcidin and CHr levels exhibited a significant positive correlation; however, in the ‘hepcidin >70 ng/mL’ group, hepcidin and CHr values exhibited a significant negative correlation. Hepcidin expression is induced by iron and inflammatory signaling [Citation14]; however, the CRP values in the patients examined in this study were low, suggesting good inflammatory control. Thus, hepcidin values might have depended upon iron levels in most of the patients in this study. Consequently, our results suggest that Hb synthesis may depend on iron levels that correspond to hepcidin levels of ≤20 ng/mL because of iron deficiency. However, at iron levels corresponding to hepcidin levels of 21–70 ng/mL, Hb synthesis remained unaffected by iron levels. In addition, at iron levels corresponding to hepcidin levels of >70 ng/mL, Hb synthesis was inhibited because of reduced iron utilization efficiency. Thus, the correlation between CHr and hepcidin suggests that controlling hepcidin levels to within 21–70 ng/mL may prevent iron deficiency and reduced Hb synthesis, and thus may facilitate effective iron utilization in hematopoiesis.
This study also established a significant correlation between hepcidin and s-ft levels. Because the estimation of hepcidin levels in clinical settings is challenging, we used an approximation to evaluate s-ft levels corresponding to hepcidin levels of 20–70 ng/mL. Consequently, the s-ft cut-off value of 60 ng/mL appeared appropriate as an indicator of iron sufficiency, suggesting that iron utilization efficiency may decline when the s-ft level is elevated to above approximately 150 ng/mL. Although the correlation between CHr and s-ft values did not show a decrease in CHr level at high s-ft levels in this study, s-ft levels are also affected by factors other than iron content. On the other hand, hepcidin is a main regulator of iron metabolism. Thus, it is probable that hepcidin is more strongly correlated to iron metabolism for hematopoiesis than is ferritin.
Study limitations
There are a number of limitations to this study. First, it was a single-center, retrospective investigation. Second, the study was limited by the relatively small number of patients and used only a single measurement point, and so could not evaluate the development of measurements over time. In addition, the relatively low doses of iron administered according to the institution’s treatment policies, as well as the somewhat low ferritin doses used in our patient cohort, might have introduced some bias.
Conclusion
This study indicated that an s-ft level of approximately 60–150 ng/mL and a TSAT level of ≥24% might correspond to an iron status that prevents iron deficiency during hematopoiesis, without reducing iron utilization efficiency through excess iron, in HD patients using rHuEPO. The optimum s-ft value might therefore be lower than the value recommended in the current guidelines.
Disclosure statement
No potential conflict of interest was reported by the author(s).
ORCID
Chie Ogawa http://orcid.org/0000-0002-9503-9711
References
- Drüeke T, Witko-Sarsat V, Massy Z, et al. Iron therapy, advanced oxidation protein products and carotid artery intima-media thickness in end-stage renal disease. Circulation. 2002;106:2212–2217. doi:10.1161/01.cir.0000035250.66458.67.
- Anraku M, Kitamura K, Shintomo R, et al. Effect of intravenous iron administration frequency on AOPP and inflammatory biomarkers in chronic hemodialysis patients: a pilot study. Clin Biochemy. 2008;41:1168–1174. doi:10.1016/j.clinbiochem.2008.07.007. doi: 10.1016/j.clinbiochem.2008.07.007
- Maruyama Y, Nakayama M, Yoshimura K, et al. Effect of repeated intravenous iron administration in haemodialysis patients on serum 8-hydroxy-2'-deoxyguanosine levels. Nephrol Dial Transplant. 2007;22:1407–1412. doi:10.1093/ndt/gfl789.
- Ganz T. Hepcidin-a regulator of intestinal iron absorption and iron recycling by macrophages. Best Pract Res Clin Heamatol. 2006;108:1381–1387. doi:10.1016/j.beha.2004.08.020.
- Ali MAM, Luxton AW, Walker WHC. Serum ferritin concentration and bone marrow iron stores: aprospective study. Can Med Assoc J. 1978;118:945–946. PMID: 647567.
- Mast AE, Blinder MA, Gronowski AM, et al. Clinical utility of the soluble transferrin receptor and comparison with serum ferritin in several populations. Clin Chem. 1998;44:45–51. PMID: 9550557 doi: 10.1093/clinchem/44.1.45
- KDOQI, National Kidney Foundation . K/DOQI clinical practice guidelines and clinical practice recommendations for anemia in chronic kidney disease. Am J Kidney Dis. 2006;47(Suppl. 3):S58–S70. doi:10.1053/j.ajkd.2006.03.010.
- Locatelli F, Bárány P, Covic A, et al. Kidney disease: improving global outcomes guidelines on anemia management in chronic kidney disease: a European renal best practice position statement. Nephrol Dial Transplant. 2013;28:1346–1359. doi:10.1093/ndt/gft033.
- Yamamoto H, Nishi S, Tomo T, et al. 2015 Japanese society for dialysis therapy: guidelines for renal anemia in chronic kidney disease. Renal Replacement Therapy. 2017;3:36), doi:10.1371/journal.pone.0179608 doi: 10.1186/s41100-017-0114-y
- Tsuchiya K, Okano H, Teramura M, et al. Content of reticulocyte hemoglobin is a reliable tool for determining iron deficiency in dialysis patients. Clin Nephrol. 2003;59:115–123. doi:10.5414/cnp59115.
- Kim JM, Ihm CH, Kim HJ. Evaluation of reticulocyte hemoglobin content as marker of iron deficiency and predictor of response to intravenous iron in hemodialysis patients. Int J Lab Hematol. 2008;30:46–52. doi:10.1111/j.1751-553X doi: 10.1111/j.1751-553X.2007.00904.x
- Mitsuiki K, Harada A, Miyata Y. Assessment of iron deficiency in chronic hemodialysis patients: investigation of cutoff values for reticulocyte hemoglobin content. Clin Exp Nephrol. 2003;7:52–57. doi:10.1007/s101570300007.
- Ogawa C, Tsuchiya K, Tomosugi N, et al. Low levels of serum ferritin and moderate transferrin saturation lead to adequate hemoglobin levels in hemodialysis patients, retrospective observational study. Plos One. 2017;29:e0179608), doi:10.1371/journal.pone.0179608.
- Tomosugi N, Kawabata H, Wakatabe R, et al. Detection of serum hepcidin in renal failure and inflammation by using ProteinChip System. Blood. 2006;108:1381–1387. doi:10.1182/blood-2005-10-4043.
- Vos FE, Schollum JB, Coulter CV, et al. Red blood cell survival in long-term dialysis patients. Am J Kidney Dis. 2011;58:591–598. doi:10.1053/j.ajkd.2011.03.031.
- Brugnara C, Hipp MJ, Irving PJ, et al. Automated reticulocyte counting and measurement of reticulocyte cellular indices. Evaluation of the Miles H*3 blood analyzer. Am J Clin Pathol. 1994;102:623–632. doi:10.1093/ajcp/102.5.623.
- Van Wyck DB, Alcorn H Jr, Gupta R. Analytical and biological variation in measures of anemia and iron status in patients treated with maintenance hemodialysis. Am J Kidney Dis. 2010;56:540–546. doi : 10.1053/j.ajkd.2010.05.009.
- Fishbane S, Shapiro W, Dutka P, et al. A randomized trial of iron deficiency testing strategies in hemodialysis patients. Kidney Int. 2001;60:2406–2411. doi:10.1046/j.1523-1755.2001.00077.x.
- Tessitore N, Solero GP, Lippi G, et al. The role of iron status markers in predicting response to intravenous iron in hemodialysis patients on maintenance erythropoietin. Nephrol Dial Transplant. 2001;16:1416–1423. doi:10.1093/ndt/16.7.1416 .
- Fishbane S, Galgano C, Langley RC Jr, et al. Reticulocyte hemoglobin content in the evaluation of iron status of hemodialysis patients. Kidney Int. 1997;52:217–222. doi:10.1038/ki.1997.323 .