
ABSTRACT
Background
: microRNAs are playing important roles in the diagnosis and prognosis of pediatric acute lymphoblastic leukemia (ALL).
Methods
Expression levels of miR-100 and miR-210 were assessed in bone marrow aspirate of 85 pediatric ALL patients compared to 12 healthy control using quantitative real-time polymerase chain reaction. Data were correlated with relevant clinico-pathological features of the patients, response to treatment, disease-free survival (DFS), and overall survival (OS).
Results
miR-100 was significantly downregulated in ALL patients [median: 1.21, range: 0–434.3] compared to the control group [median: 8.41, range; 0–840.3, P = 0.035]. miR-210 was significantly upregulated in ALL patients [median: 6.34, range: 1.16–1088.7] compared to the control group [median: 2.57, range: 0.11–709.2, P = 0.025]. The sensitivity, specificity, and area under curve of miR-100 were (64.7%, 62.5%, and 0.642; respectively, P = 0.035) at a cut-off 2.6 and that of miR-210 were (60%, 58.3% and 0.650; respectively, P = 0.025) at a cut-off 3.5. miR-100 overexpression associated with shorter DFS and OS (P = 0.033 and 0.046; respectively). Patients with miR-100 lowexpression showed a significant incidence of late death (P = 0.024). There was no significant association between miR-210 expression and DFS, OS, incidence of early or late death.
Conclusion
: miR-100 and miR-210 could be used as potential diagnostic markers for pediatric ALL. miR-100 is a useful prognostic and predictive biomarker for childhood ALL.
Introduction
Acute leukemia is the most common childhood malignancy worldwide. Acute lymphoblastic leukemia (ALL) represents the most common subtype, as it accounts for 75–80% of all childhood leukemia cases [Citation1]. It arises as a malignant transformation of lymphoid progenitor cells with more than 80% originating from B-cell progenitors and the remaining 20% originates from T cells [Citation2]. ALL is elicited by a variety of genetic alterations including chromosomal translocations, mutations, and aneuploidies in genes responsible for cell cycle regulation and/or lymphoid cell development [Citation3]. The peak incidence of ALL is from 2 to 5 years of age, and it occurs more commonly in boys than in girls with a ratio of 55% to 45%, respectively [Citation3]. Despite increasing the five-year overall survival (OS) rate that reaches 85–90% owing to the advancement of the chemotherapeutic regimens used for pediatric ALL [Citation3,Citation4], however, about 20% of cases relapsed with a high rate of treatment failure. Consequently, ALL remains the leading cause of cancer-related death in children and young adults [Citation5,Citation6].
A lot of microRNAs (miRNAs) have been reported to have an important role in the development and pathogenesis of almost all human cancers including hematological malignancy [Citation7]. MicroRNAs are short noncoding RNAs that regulate gene expression by binding to the 3′-untranslated region of messenger RNA and involved in various cellular processes including cell cycle regulation, differentiation, and apoptosis [Citation8]. Many miRNAs have been identified in malignant lymphopoiesis, among them, were miR-100 and miR-210 [Citation9,Citation10]. Both miRNAs have significant functions in pediatric ALL. For example, miR-100 inhibited cell proliferation and increased dexamethasone-induced cell apoptosis in ALL patients [Citation11]. While miR-210 has a pivotal role in tumor progression, cancer cell proliferation, immunosuppression, angiogenesis and metastasis [Citation12,Citation13]. Accordingly, altered regulation of these miRNAs associated significantly with increased risk of ALL, and reversal of the expression of these miRNAs may help in the management and improving patients’ outcomes [Citation14]. Moreover, still there are some issues that need to be resolved to understand the function of miRNAs in ALL more clearly [Citation15]. Therefore, the aim of the current study is to investigate the diagnostic, prognostic and predictive values of miR-100 and miR-210 in children with ALL. These may help to better understand their significant role in ALL carcinogenesis as well as risk stratification of the patients to guide individualized therapeutic regimen. This will be performed through assessment of the association between miR-100 and miR-210 expression and patients’ clinico-pathological features, patients’ response to treatment, overall survival (OS) and disease-free survival (DFS).
Methods
This is a prospective cohort study included 85 newly diagnosed pediatric ALL patients, who were presented to the Pediatric Oncology Outpatient clinics, National Cancer Institute (NCI), Cairo University, during the period from February 2014 till March 2016. Control samples were obtained from 12 age- and sex-matched healthy pediatric subjects who were donors for bone marrow transplantation in NCI.
The diagnosis of ALL was based on morphologic assessment, cytochemical evaluation, immune-phenotyping (IPT) and cytogenetics according to the French–American–British and World Health Organization criteria [Citation16]. Follow up for cases was carried out for at least 3.5 years. All patients were subjected to detailed history taking, complete clinical examination, laboratory investigations in the form of complete blood picture using XT-1800i (Sysmex, BM-Egypt), morphological examination of the bone marrow (BM) aspirate using Romanowsky stain supplemented with cytochemical stains such as MPO/SBB, acid phosphatase to identify the type of acute leukemia. Immunophenotyping for blast cells in BM aspirate samples was done using EPICS XL Coulter Flow Cytometer (Beckman Coulter, Hialeah, Florida, USA) to confirm the diagnosis of ALL with a wide panel of Lymphoid markers including (CD10, CD19, CD22, CD79a, CD20, Cyto IgM, Kappa and Lambda) for B lymphoid series and (CD3, CD2, CD4, CD8, CD7 and CD5) for T lymphoid series, as well as the stem cell marker CD34 on routine basis. Conventional karyotyping, Fluorescence In Situ Hybridization and conventional PCR for common genetic abnormalities t(1:19), t(9;22), t(12,21), t(4,11), hyperdiploidy or hypodiploidy were also performed, in addition to radiological examination and CSF examination.
Follow up of the patients was done through assessing the response to treatment by morphologic BM examination and IPT for detection of minimal residual disease (MRD) at day 15 and day 42.
Complete remission was defined as meeting all of the following response criteria for at least four weeks including (1) lower than 5% blasts in the BM, (2) normal maturation of all cellular components of the BM, (3) no extra-medullary disease, e.g. Central nervous system (CNS), soft tissue disease, (4) absolute neutrophil count ≥1000/μL, (5) platelets count ≥100,000/μL, (6) transfusion independent, and (7) MRD < 0.01%.
Relapse was defined by the presence of ≥5% BM lymphoblast, reappearance of circulating leukemic blasts in the peripheral blood, development of extra-medullary leukemia or MRD ≥ 0.01% [Citation17].
Assessment of miR-100 and miR-210 by real-time RT-PCR
Samples collection
Samples were collected at presentation before receiving any medication. A sample of 1 mL BM aspirate was obtained from each patient by iliac or tibial puncture under complete aseptic conditions. Samples were collected in the presence of an anticoagulant Ethylene diamine tetra-acetic acid (EDTA) and processed within few hours of aspiration in laminar air flow.
MicroRNAs extraction and complementary DNA synthesis
miRNA was extracted from the BM aspirate of 85 ALL patients and 15 healthy controls using the miRNeasy Mini Kit (Qiagen, Cat. No. 217004, California, USA) according to the manufacturer’s instructions. The amount of miRNA was measured by nanodrop spectrophotometer at 260 and 280 wave lengths, a ratio of 1.8–2.0 denoted good quality of RNA. Subsequently, 1.0 ug miRNA was reverse transcribed into complementary DNA using TaqMan miRNA reverse transcriptase, Applied Biosystems (Foster city, CA, USA, Cat no.4366596) according to manufacturer’s instructions. The reverse transcriptase reaction included 10 ng total RNA (5 μL), 3.0 μL 5XRT Primer, 1.0 μL Multiscribe RT enzyme (50 U/μL), 0.19 μl RNase Inhibitor (20 U/μL), 0.15 μl dNTPs (100 mM total), 1.5 μL 10XRT buffer and 4.16 μL nuclease free water.
Quantitative real-time polymerase chain reaction for detection of miR-100 andmiR-210
The quantitative real-time polymerase chain reaction amplification was performed using Taqman universal PCR master mix II (Applied Biosystems, cat. no.4440043), TaqmanmiR Assay 20X for miR-100 expression (Thermofisher ID 000437 cat. no.4427975, Applied Biosystems) and TaqmanmiR Assay 20X for miR-210 expression (Thermofisher ID 000512, cat. no.4427975, Applied Biosystems).
The amplification reaction was performed using a total volume of 25 µL, and the thermal reaction conditions were as follows: initial activation of 95°C for 15 min, followed by 40 cycles of 94°C for 15 s (denaturation), 55°C for 30 s (annealing) and 70°C for 30 s (extension). The expression levels of the target miRNAs were normalized to the expression of the reference miRNA (U6) 20X (Thermofisher ID 001973, cat no.4427975, Applied Biosystems). The fluorescence was detected by StepOne Real-Time PCR System (Applied Biosystems). Relative expression of miR-100 and miR-210 was analyzed by the comparative Ct method (2−ΔCt) [Citation18]
Statistical methods
Statistical analysis was done using IBM© SPSS© Statistics version 22 (IBM© Corp., Armonk, NY, USA). Numerical data were expressed as median and range according to the performed normality tests. Qualitative data were expressed as frequency and percentage. The relation between qualitative variables was assessed using Chi-square or Fisher’s exact test as appropriate. Comparison between groups was done using Mann–Whitney test. The Area under the receiver operating curve (ROC) was calculated to investigate the best cut-off value, sensitivity and specificity for the diagnosis of ALL. Survival analysis was done using Kaplan–Meier test and comparison between survival curves was done using log-rank test. All tests were two-tailed. A p-value < 0.05 was considered significant.
Results
Patients’ characteristics
The current study included 85 patients, out of them 47 (55.3%) were males and 38 (44.7%) were females, with a median age of 6 years (range: 1–17) and mean ± SD of 7.6 ± 5.07 years. BM findings showed that 71 patients (83.5%) presented with hypercellular BM, 11 patients (12.9%) with normocellular BM, and only 3 (3.5%) patients presented with hypocellular BM. Of all patients, BM blasts ranged from 26% to 99% with a median of 91%. Blast percentage was <90% in 28 (32.9%) patients, while it was ≥90% in 57 (67.1%) patients. Immunophenotyping analysis showed that 50 (58.8%) patients had (Pre-B) phenotype, 17 (20%) had common ALL (C-ALL), and 18 (21.2%) patients had T-ALL phenotype. Molecular and genetic data were available for 84 patients, where 68/84 patients (80.9%) had normal karyotype, 5/84 (6%) patients had t(9;22) p190, 3/84 (3.6%) patients had t(9;22) p210, 3/84 (3.6%) patients had t(12;21), 1/84 (1.2%) patient had t(1;19), 3 (3.5%) patients had hyperdiploidy (53xx, 54xx, and 58xy), and only 1(1.17%) patient had Hypodiploidy (45, xx). There were 14/85 (16.5%) patients presented with hepatomegaly, 7/85 (8.2%) patients had splenomegaly, 42/85 (49.4%) had hepatosplenomegaly and 22/85 (25.9%) patients did not have any organomegaly, while lymphadenopathy was present in 54/85 (63.5%) of the cases. Patients were classified according to risk stratification of ALL [Citation19] into low risk (LR) in 33 (38.8%) patients, standard risk (SR) in 45 (52.9%) patients, and high risk (HR) in 7 (8.2%) patients ().
Table 1. Clinico-pathological features of pediatric ALL patients.
Expression levels of miR-100 and miR-210 in BM aspirate of ALL patients
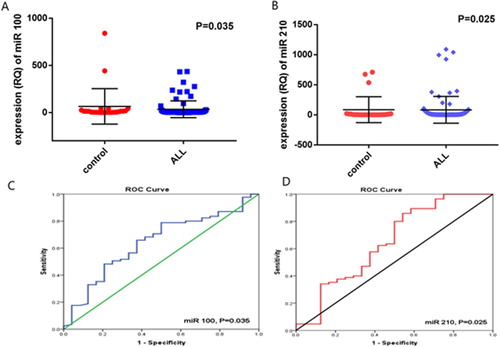
The expression level of miR-100 was significantly downregulated in pediatric ALL [median: 1.21, range: 0–434.3] compared to control group [median: 8.41, range: 0–840.3, P = 0.035, (A)]. On the other hand, the expression level of miR-210 was significantly upregulated in pediatric ALL patients [median: 6.34, range: 1.16–1088.7] compared to control group [median: 2.57, range: 0.11–709.2, P = 0.025, (B)].
Figure 1. Expression levels of: (A) miR-100 and (B) miR-210 in BM aspirate of pediatric ALL patients compared to normal controls. ROC analysis of (C) miR-100 and (D) miR-210 for the diagnosis of pediatric ALL patients.
Assessment of the diagnostic significance of miR-100 and miR-210 in pediatric ALL patients
The ROC curve analysis showed that the sensitivity, specificity, AUC of miR-100 were (64.7%, 62.5%, 0.642; respectively, P = 0.035) at a cut-off value of 2.6. While the sensitivity, specificity, AUC of miR-210 were (60%, 58.3%, 0.650; respectively, P = 0.025) at a cut-off value of 3.5 (, (C,D)).
Table 2. ROC analysis for diagnosis of pediatric ALL with miRNA-210 and miRNA-100.
Association between the expression of miR-210, miR-100 and patients’ characteristics
Pediatric ALL patients were classified according to the cut-off value obtained by the ROC curve into miR-210 high expressers 51/85(60%) and miR-210 low expressers 34/85 patients (40%). Also, patients were classified into miR-100 low expressers 56/85 patients (65.8%) and miR-100 high expressers 29/85 patients (34.1%).
There was a significant association between miR-210 expression level and blast IPT, where low expression of miR-210 associated significantly with T-ALL phenotype [12(35.3%) in miR-210 low expressers versus 6(11.8%) in patients with miR-210 overexpression)], while higher expression associated with B(C-ALL) phenotype [3 (8.8%) in miR-210 low expressers versus 14 (27.5%) in patients with miR-210 overexpression, P = 0.011]. Similarly, miR-100 expression associated significantly with blast IPT, where low expression of miR-100 associated with T-ALL phenotype [13 (23.2%) in miR-100 low expressers versus 5(17.2%) in patients with miR-100 overexpression], and miR-100 over expression associated with B (C-ALL) phenotype [6(10.7%) in miR-100 low expressers versus 11(37.9%) in patients with miR-100 over expression, P = 0.012]. However, no significant association was detected between miR-210 or miR-100 expression and any other clinic-pathological features including age, sex, BM cellularity, karyotyping, organomegaly, lymphadenopathy, risk stratification, total leukocyte count (TLC), platelet count, peripheral blood blast %, and BM blast% (P > 0.05, ).
Table 3. Association between miRNA 210, miRNA 100 and patients’ characteristics.
Association between the expression of miR-210, miR-100 and response to treatment
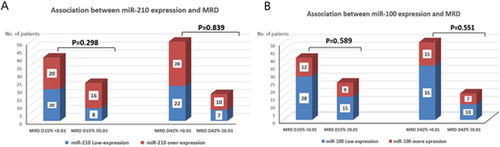
Initial response to therapy was evaluated according to the morphological response (less than 5% lymphoblast in BM aspirate) and the immunological response (MRD < 0.01%). Initial morphological remission data at day 15 were available for 74 cases only (others either died before day 15 of treatment or lost follow up), among the 74 cases; 63 (85.1%) cases achieved complete morphological response (CR), while 11 (14.8%) cases did not. However, morphological remission data at day 42 were available for 68 cases only (the remaining either died before day 42 of treatment or lost follow up), among the 68 cases; 67 (98.5%) achieved complete morphological response (CR), while only one (1.5%) patient did not achieve CR. Regarding the immunological response, MRD data at day15 were only available for 64 cases (3 samples were diluted, the remaining cases either died before day 15 or lost follow up). Among the 64 cases; 40 (47.1%) cases had MRD <0.01% and 24 (28.2%) cases had MRD ≥0.01%. While MRD data at day 42 were only available for 67 cases (others either died before day 42 or lost follow up), among the 67 cases; 50 (58.8%) cases had MRD < 0.01% and 17 (20%) cases had MRD ≥0.01% (). There was no significant association between the expression of miR-210 and morphological response (P = 0.191 at day 15) or immunological response (P = 0.298 at day 15 and P = 0.839 at day 42, (A)). Similarly, miR-100 did not associate with morphological response (P = 0.167 at day 15) or immunological response (P = 0.589 at day 15 and P = 0.551 at day 42) of the patients ( and (B)).
Figure 2. Association between (A) miR-210, (B) miR-100 and MRD of the assessed pediatric ALL patients.
Disease-free survival
The number of patients who relapsed after therapy were 3/41 (7.3%) in patients with miR-100 lowexpression, and 5/23 (21.7%) in patients with miR-100 overexpression (P = 0.124). There was a significant association between miR-100 overexpression and shorter DFS rate, where the mean DFS of patients with miR-100 lowexpression was 60.37 months, compared to 42.98 months in patients with miR-100 overexpression (P = 0.033, (A)).
Figure 3. Association between (A) miR-100, (B) miR-210 expression and DFS rates of the ALL patients.
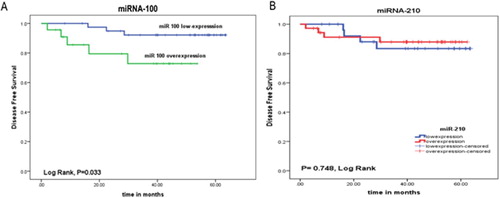
Also, the number of patients who relapsed after therapy were 4/28 (14.3%) in patients with miR-210 lowexpression, and 4/36 (11.1%)in patients with miR-210 overexpression (P = 0.721). But there was no significant association between miR-210 expression and DFS duration, where the mean DFS of patients with miR-210 lowexpression was 56.54 months, compared to 56.34 months in patients with miR-210 over expression (P = 0.748, (B)).
OS rates
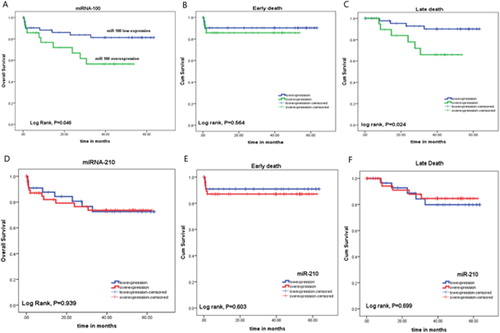
There was a significant association between miR-100 expression and OS rates of the patients; the mean OS of the patients with miR-100 overexpression was 36.18 months compared to 53.56 months in those with miR-100 low expression (P = 0.046). Moreover, patients with miR-100 low expression showed significant association with late death (death after 42nddays) compared to those with miR-100 overexpression (P = 0.024). However, there was no significant difference between patients with miR-100 low or overexpression regarding early death (death before 42nd days, P = 0.564, (A–C)). On the other hand, there was no significant association between miR-210 expression and OS rate, incidence of early death or late death (P = 0.939, 0.603 and 0.699; respectively, (D–F)).
Figure 4. Association between miR-100 expression and: (A) overall survival (OS) rates, (B) incidence of early death, (C) incidence of late death. Association between miR-210 expression and: (D) overall survival (OS) rates, (E) incidence of early death, (F) incidence of late death.
Discussion
ALL represents a major health problem especially in children, and hence, it requires more research to find simple, easy, and reliable biological markers that can help better diagnosis and follow up of the patients. The results of the current study demonstrated that the expression level of miR-100 was significantly downregulated in ALL cases compared to control group, with a diagnostic power of 64.7% sensitivity and 62.5% specificity. These data are in agreement with many studies in literature reported down-regulation of miR-100 in ALL patients compared to control group [Citation11,Citation20–22]. Xue et al. demonstrated also that miR-100 is a good prognostic factor for ALL, and the genetic variant of miR-100 (rs543412) was remarkably associated with decreased childhood ALL risk [Citation23], though, he found a significant increase in the plasma level of miR-100 in ALL patients compared to control group. This discrepancy in results may be due to the different biological characteristic between plasma samples and BM samples.
In the current study, patients were classified according to the cut-off value obtained by ROC curve into miR-100 lowexpressers and miR-100 highexpressers. Our data revealed that miR-100 overexpression associated with B(C-ALL) phenotype, and miR-100 downregulation associated with T-ALL phenotype. On the other hand, no significant association was detected with age, sex, BM cellularity, karyotyping, organomegaly, lymphadenopathy, risk stratification, TLC, platelet count, peripheral blood blast %, or BM blast%. These data are concordant to that observed by Xue et al. [Citation23], who found a significant association between miR-100 expression and B-ALL phenotype. Similarly, Li et al. [Citation11] reported that lower expression of miR-100 was found in patients with high-risk prognostic factors, T-ALL patients and in patients carrying the MLL-rearrangement and BCR-ABL fusion genes, suggesting that miR-100 expression is cell-type specific. However, our data are not in agreement with Oliveira et al. [Citation20], who found higher miR-100 expression associated with the presence of 12;21 translocations, lower level of white blood cells at diagnosis (<50,000/mm3), and hyperdiploid negative in pediatric ALL cases. Unfortunately, these observations could not be proven in the present study, this may be due to smaller sample size associated with specific risk groups within the recruited ALL patients.
In addition, miR-100 did not associate with the morphological or immunological response of the patients. These results are in concordance with that reported by Oliveira et al. [Citation20], that there was no significant impact of miR-100 on response to treatment in pediatric ALL. However, Umerez et al. [Citation24] pointed out that miR-125b together with miR-99a and/or miR-100 overexpression could be used as markers of vincristine resistance.
Regarding the assessment of the prognostic value of miR-100 in pediatric ALL, our data showed that miR-100 over expression was significantly associated with shorter DFS and OS rates. These findings are comparable to that observed by Zhang et al. [Citation22], who concluded that miR-100 was significantly upregulated in relapsed patients compared to complete remission cases, with at least a two-fold change in expression. While, Oliveira et al. [Citation20] reported no significant association between miR-100 expression level and DFS rate of the ALL patients. In contrary, Li et al. [Citation11] reported that low expression of miR-100 associated with poor prognosis in the form of shorter OS and DFS rates. This inconsistency between results could be explained by the presence of other favorable prognostic factors in the miR-100 low expression cases recruited in the current study such as (1) patients with age more than 2 years old represented 87.5%, (2) the presence of 60.7% of the lowexpression group with TLC < 50 × 103/μL, (3) the presence of 67.9% of the patients with HB≥ 7 g/dL. In addition, (4) the majority of miR-100 lowexpression group were categorized as SR and LR (53.6% and 37.5%, respectively), while only 8.9% were HR, denoting that low expression of miR-100 alone cannot be used as an independent prognostic factor for survival rates in ALL patients.
Another important finding in the present study is that patients with miR-100 lowexpression showed significant association with incidence of late death (death after 42nd days) compared to those with miR-100 overexpression. While, there was no significant difference between patients with miR-100 low or over expression regarding early death (death before 42nd days).
On the other side, regarding assessment of the expression level of miR-210 in ALL patients, there was significant upregulation of miR-210 in ALL patients compared to normal control group, with a diagnostic power denoted by ROC curve of sensitivity of 60% and specificity of 58.3%. Zhang et al. [Citation22] agreed with our results as they found miR-210 was one of the most highly expressed miRNAs in ALL patients in their study. Similarly, Mei et al. [Citation25] found that miR-210 was upregulated in ALL patients using a cut-off (3.8) calculated from ROC curve, which is very near to the cut-off which had been used in our study to divide ALL patients into high and lowexpresser groups (3.5).
Our data demonstrated also that patients with miR-210 low expression showed significant association with T-ALL phenotype and those with miR-210 overexpression associated with B(C-ALL) phenotype. However, no significant association detected between miR-210 expression and age, sex, and MRD. In concordance to our results, Mei et al. [Citation25] reported that the expression of miR-210 was significantly lower in patients with T-ALL phenotype. However, they found that overexpression of miR-210 was significantly observed in boys and in patients older than 10 years.
There is a discrepancy in the literature regarding the impact of miR-210 expression on OS and DFS rates of pediatric ALL. The current study showed that there is no significant association between miR-210 expression and OS or DFS rates of the patients. However, Mei et al. [Citation25] reported that low miR-210 expression associated significantly with poor OS and DFS rates. In contrary, Zhang et al. [Citation22] demonstrated that increased miR-210 expression in HR group is associated with poor outcome in the assessed ALL patients. These discrepancies in results may be attributed to the differences in the used methods of extraction and detection of miRNAs, different sample size, in addition to the risk classification groups in treatment protocols [Citation26].
In conclusion, miR-100 was downregulated and miR-210 was upregulated in newly diagnosed pediatric ALL compared to control subjects. Both of them associated with specific phenotypes of ALL indicating that these biologic biomarkers could help to provide new insights in the pathogenesis of childhood ALL. In addition, miR-100 could be a useful prognostic and predictive biomarker for childhood ALL. However, these results should be validated on further studies included a larger number of patients with more categorization according to the age, risk and leukemia subtypes.
Compliance with ethical standards
The study protocol was approved by the ethical committee, review board of National Cancer Institute, Cairo University, which is in accordance with 2011 Helsinki guidelines for the protection of human subjects. Written informed consent was obtained from guardians of all patients and control group prior to enrolment in the study.
Disclosure statement
No potential conflict of interest was reported by the author(s).
Notes
Notes: TLC: total leukocyte count, HB: hemoglobin concentration, PLT: platelet count, PB blast: peripheral blast: BM: bone marrow, LR: low risk, SR: standard risk, HR: high risk, MRD: minimal residual disease, CR: complete remission, HSM: hepato-splenomegaly.
Note: AUC: area under curve, SE: standard error.
Notes: TLC: total leukocyte count, HB: hemoglobin concentration, PLT: platelet count, PB blast: peripheral blast: BM: bone marrow, LR: low risk, SR: standard risk, HR: high risk, MRD: minimal residual disease, CR: complete remission, HSM: hepato-splenomegaly.
References
- Mezei G, Sudan M, Izraeli S, et al. Epidemiology of childhood leukemia in the presence and absence of Down syndrome. Cancer Epidemiol. 2014;38:479–489.
- Inaba H, Greaves M, Mullighan CG. Acute lymphoblastic leukemia. Lancet. 2013;381:1943–1955.
- Hunger SP, Mullighan CG. Acute lymphoblastic leukemia in children. N Engl J Med. 2015;373:1541–1552.
- Ding LW, Sun QY, Tan KT, et al. Mutational landscape of pediatric acute lymphoblastic leukemia. Cancer Res. 2017;77:390–400.
- Tasian SK, Hunger SP. Genomic characterization of pediatric acute lymphoblastic leukemia:an opportunity for precision medicine therapeutics. Br J Haematol. 2017;176:867–882.
- Roberts KG, Mullighan CG. Genomics in acute lymphoblastic leukaemia: insights and treatment implications. Nat Rev Clin Oncol. 2015;12:344–357.
- Liu XL, Liu HQ, Li J, et al. Role of epigenetic in leukemia: from mechanism to therapy. Chem Biol Interact. 2020;317:108963.
- Valencia-Sanchez MA, Liu J, Hannon GJ, et al. Control of translation and mRNA degradation by miRs and siRNAs. Genes Dev. 2006;20:515–524.
- de Oliveira JC, Brassesco MS, Scrideli CA, et al. MicroRNA expression and activity in pediatric acute lymphoblastic leukemia (ALL). Pediatr Blood Cancer. 2012;59:599–604.
- Carvalho de Oliveira J, Molinari Roberto G, Baroni M, et al. Mir dysregulation in childhood hematological cancer. Int J Mol Sci. 2018;19:2688.
- Li X-J, Luo X-Q, Han B-W, et al. MicroRNA-100/99a, deregulated in acute lymphoblastic leukaemia, suppress proliferation and promote apoptosis by regulating the FKBP51 and IGF1R/mTOR signalling pathways. Br J Cancer. 2013;109:2189–2198.
- Noman MZ, Buart S, Romero P, et al. Hypoxia-inducible miR-210 regulates the susceptibility of tumor cells to lysis by cytotoxic T cells. Cancer Res. 2012;72(18):4629–4641.
- Hanahan D, Weinberg RA. Hallmarks of cancer: the next generation. Cell. 2011;144(5):646–674.
- Ultimo S, Martelli AM, Zauli G, et al. Roles and clinical implications of microRNAs in acute lymphoblastic leukemia. J Cell Physiol. 2018 Aug;233(8):5642–5654.
- Luan C, Yang Z, Chen B. The functional role of microRNA in acute lymphoblastic leukemia: relevance for diagnosis, differential diagnosis, prognosis, and therapy. Onco Targets Ther. 2015;8:2903.
- Daniel AA, Attilio O, Robert H, et al. Revision to the World Health Organization classification of myeloid neoplasms and acute leukemia. Blood. 2016;127(20):2391–2405.
- Campana D. Minimal residual disease in acute lymphoblastic leukemia. Semin Hematol. 2009;46(1):100–106.
- Livak KJ, Schmittgen TD. Analysis of relative gene expression data using real-time quantitative PCR and the 2− ΔΔCT method. Methods. 2001 Dec;25(4):402–408.
- Pui CH, Campana D, Pei D, et al. Treating childhood acute lymphoblastic leukemia without cranial irradiation. N Engl J Med. 2009;360(26):2730–2741.
- de Oliveira JC, Scrideli CA, Brassesco MS, et al. Differential miRNA expression in childhood acute lymphoblastic leukemia and association with clinical and biological features. Leuk Res. 2012 Mar;36(3):293–298.
- Schotte D, De Menezes RX, Moqadam FA, et al. MicroRNA characterize genetic diversity and drug resistance in pediatric acute lymphoblastic leukemia. Haematologica. 2011 May;96(5):703–711.
- Zhang H, Luo XQ, Zhang P, et al. MicroRNA patterns associated with clinical prognostic parameters and CNS relapse prediction in pediatric acute leukemia. PloS One. 2009;4(11):e7826.
- Xue Y, Yang X, Hu S, et al. A genetic variant in miR-100 is a protective factor of childhood acute lymphoblastic leukemia. Cancer Med. 2019 May;8(5):2553–2560.
- Umerez M, Garcia-Obregon S, Martin-Guerrero I, et al. Role of miRNAs in treatment response and toxicity of childhood acute lymphoblastic leukemia. Pharmacogenomics. 2018 Mar;19(4):361–373.
- Mei Y, Li Z, Zhang Y, et al. Low miR-210 and CASP8AP2 expression is associated with a poor outcome in pediatric acute lymphoblastic leukemia. Oncol Lett. 2017;14(6):8072–8077.
- Rashed WM, Hamza MM, Matboli M, et al. MicroRNA as a prognostic biomarker for survival in childhood acute lymphoblastic leukemia: a systematic review. Cancer Metastasis Rev. 2019 Dec;38(4):771–782.