
ABSTRACT
Objectives
A new regulatory subpopulation of innate lymphoid cells (ILCs), regulatory innate lymphoid cells (ILCregs), has been identified with both innate lymphoid cells and regulatory cells characteristics. The purpose of this study is to explore ILCregs and its associated miRNAs in patients with aplastic anemia (AA) by evaluating ILCregs frequency, associated miRNA quantification, and their significance.
Methods
Using 4 color combinations of surface and intracellular antibody staining, the CD45+Lin−CD127+IL-10+ ILCregs from 30 healthy donors and 30 patients newly diagnosed with AA were measured by flow cytometry. Bone marrow cells were studied by next-generation sequence miRNAs quantification.
Results
Our results showed that the frequency of ILCregs in bone marrow cells from healthy donors (HD) and AA patients were 0.703 ± 0.941 and 0.171 ± 0.233%, respectively. The frequencies of ILCregs in AA patients were significantly lower than that in HD (p <0.05). miRNA detection results showed different expression patterns in the AA patient group comparing with HD. Comparing with HD, there were 52 miRNAs up-regulated and 130 miRNAs down-regulated from AA patients. Analysis of miRNAs from ILCregs associated genes demonstrated different miRNAs expression patterns between HD and AA patient.
Conclusion
The present study demonstrated the deficiency of ILCregs and differential expression pattern of ILCregs gene-related miRNA in patients with AA. Further studies need to be done to explore the clinical significance of ILCregs and related miRNAs in patients with AA with large samples size and clinical follow-up.
Introduction
Aplastic anemia (AA) is a hematopoietic failure caused by abnormal immune response, hematopoietic stem/progenitor cell deficiency and bone marrow stromal cell abnormality, resulting in trilineage marrow hypoplasia and pancytopenia of the peripheral blood. However, the exact pathological mechanism of AA is still unclear. At present, the main pathological mechanism is considered as abnormal immune tolerance and damage of hematopoietic stem/progenitor cells by an abnormal immune response. In recent years, the study of immunopathological mechanism is very active and has made great progress. Both adaptive immunity and innate immunity are involved in the damage of hematopoietic stem/progenitor cells. It was first found that the proportion of CD8 + T lymphocytes was significantly increased; cytokines drifted to Th1 cells, and the function of Th17 cells was abnormal. Then, it was found that the number of regulatory T cells (Treg) decreased and the function was defective, which could not inhibit the activity of effective T cells [Citation1–3].
A new regulatory subpopulation of innate lymphoid cells (ILCs), regulatory innate lymphoid cells (ILCregs), has been identified by Wang et al. in 2017, which has a unique phenotype and gene expression profile with both innate lymphoid cells and regulatory cells characteristics. These cells have a phenotyping of Lin-CD45+ CD127 + IL-10 + ILCs in the lamina propria of intestinal mucosa, with large nuclear-cytoplasmic ratio and small cytoplasmic volume. The morphology was consistent with the characteristics of lymphocytes, but it did not express CD4 and Foxp3, so it was not Tregs. It expressed ILC markers such as CD25 (IL-2R α) and CD90 (THY1), which highly expressed IL-2R γ and Sca-1, but did not express ilc1 marker (NK1.1, NKp46), and ilc2 marker (ST2 and ST2) Klrg1 and ilc3 markers (NKp46, CD4, and ror γ T), but not other leukocyte markers, are a new group of IL-10 secreting ILC, named ilcregs. Flow cytometry showed that the proportion of cells in lamina propria was the highest, accounting for 13.12%, and 0.17% in bone marrow. Immunofluorescence and immunohistochemistry were used to verify the presence of intestinal tract in human and mouse. These ILCregs express specific genes such as id2, id3, sox4, tgfbr1, tgfbr2, il2rb, and il2rg and express specific cytokines such as IL-10 and TGF-β1 [Citation4–6]. After the identification of the ILCregs, new studies had been reported by different groups [Citation7–9].
ILCregs have the characteristics of regulatory cells and innate immune cells, and its frequency and role in the pathogenesis of AA are not clear. Our previous study results established the methods for the ILCregs detection and miRNAs measurement. The results demonstrated deficient regulatory innate lymphoid cells and differential expression of miRNAs in acute myeloid leukemia [Citation7]. This study aims to detect the frequency of ILCregs and the miRNAs from the ILCregs related genes in patients with AA, comparing with the healthy donors (HD).
Materials and methods
Patient cohort and control group
Bone marrow samples from 30 patients with AA were obtained with informed consent from patients and/or their legal guardians prior to the treatment at the First Affiliated Hospital of Zhengzhou University from September 2018 to December 2019. Protocols were approved by Ethic Committee of The First Affiliated Hospital of Zhengzhou University, Henan, China, and based on the ethical principles of the Helsinki Declaration. Diagnosis was done based on the guidelines for the diagnosis and management of adult aplastic anemia [Citation10]. All clinical data regarding patients are summarized in . Bone marrow samples from 30 HD (16 males and 14 females) with the age of 20- to 55-year-old were obtained with informed consent from stem cell transplantation donors, who passed the physical and laboratory testing, as the control group and tested side by side with AA patient samples.
Table 1. Clinical manifestations of AA patients.
ILCregs detection by multicolor flow cytometry
Freshly obtained samples within 4 h from the collection were processed for flow cytometry assay. Bone marrow samples were collected and cultured in IMDM media containing 1:1000 BD GolgiPlug (BD Biosciences, USA) for 4hrs at37°C. Cells were harvested and stained with surface markers with the methods as described before [Citation7]. The monoclonal antibodies and related reagents were used as followings: CD45-FITC (eBioscience, USA, Cat # 11-9459-41, Clone 2D1), Lineage-APC (eBioscience, USA, Cat# 22-7776-72, Clones: RPA-2.10, OKT3, 61D3, CB16, HIB19, TULY56, HIR2), CD127-PE-Cy7 (BD Biosciences, USA, Cat # 560822, Clone HIL-7R-M21), Lysing buffer (BD Biosciences, USA, Cat # 555899), BD Cytofix/Cytoperm buffer set (BD Biosciences, USA, Cat#555028), IL-10-PE (BD Biosciences, USA, Cat#554498, Clone JES3-9D7) with the antibody volumes and procedures followed the manufacturers’ instructions. The data was collected by Beckman Coulter Gallios flow cytometer with Navios software (Beckman Coulter, USA). Data analysis was done by using FlowJo software (BD Biosciences, USA). ILCregs were identified as CD45+Lin-CD127+IL-10+ population with the method described before [Citation7]. At least a total of 1 million of total cells were collected for analysis of ILCreg cells.
RNA extraction and miRNA library construction
Bone marrow samples from AA patients and HD were obtained and the mononuclear cells were obtained by Ficoll-hypaque centrifugation for miRNA testing. The RNA samples were prepared with the method as described before [Citation7]. Total RNA was qualified and quantified using a Nano Drop and Agilent 2100 Bioanalyzer (Thermo Fisher Scientific, MA, USA).
Library was prepared with 1μg total RNA for each sample. The yield and quality of the RNA samples were assessed using the Agilent Bioanalyzer prior to library construction using the Illumina TruSeq Small RNA Sample Prep protocol (Illumina; San Diego, California) with the method as described before [Citation7].
Statistical analysis
Clinical data and laboratory findings from the patients were collected in the spreadsheet constructed in Microsoft Excel software for Windows 10 (Microsoft). Data were analysed using IBM SPSS Statistics software version 17.0 (IBM, USA). For intra-group comparison, Student’s t-test was used. Significance level was p < 0 05.
The analysis of the RNA-seq data was performed with the method as described before [Citation7]. Volcano plots were used to graphically examine the differences between groups with 2.0 fold-change threshold chosen as a cut-off.
Results
Patients’ clinical characteristics
Thirty newly diagnosed AA patients were included in this study, including 16 males and 14 females. The detailed clinical manifestations of these patients were summarized in . The median age at diagnosis was 38 years (range 18–72 years). Thirty HD were used as controls, including 16 males and 14 females with the age from 20 to 55 years old.
ILCregs detection by flow cytometry
The ILCregs cell population was measured from HD and AA patients. The average frequencies of ILCregs out of the gated bone marrow mononuclear cells from ND and AA patients were 0.703 ± 0.941 and 0.171 ± 0.233%, respectively. In comparison with the HD, the frequency of ILCregs cells in AA patients were significantly lower (p < 0.05) ().
Table 2. Comparison of ILCregs.
miRNAs sequenced by NGS
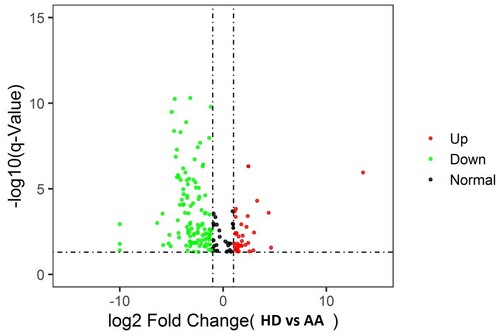
Total of 3280 miRNAs were sequenced and averaged the amount of each miRNA from these AA patients and HD were obtained. Levels of miRNA expression were compared with a t-test while the P-values and Q values were calculated for each miRNA. Different miRNA patterns were found between the AA patients and ND. Comparing with ND, there were 52 miRNAs up-regulated and 130 miRNAs down-regulated from AA patients (Supplementary data tables 1 and 2). The volcano plots are shown in .
Figure 1. Volcano plot: Difference of miRNA samples from AA patients vs HD. Log2 fold-change is shown on the x-axis and–log10 p-value is shown on the y-axis. Points in bold font indicate miRNAs with statistically significant log fold-change and adjusted p-value, green color indicated down-regulation and red color indicated up regulation.
Analysis of miRNAs from ILCregs associated genes, including id2, id3, sox4, tgfbr1, tgfbr2, il2rb, and il3rg, demonstrated different miRNAs expression patterns between ND and AA patients. Results showed there were 9 miRNAs with a statistically significant difference (both Q value and P-value < 0.001) between AA patients and HD ().
Table 3. ILCregs associated genes related miRNA expression from AA patients.
Discussion
Aplastic anemia (AA) is a common disease which was caused by immune-mediated destruction of hematopoietic stem cells and progenitor cells (HSPC) in most patients. The response of a large proportion of AA patients to immunosuppressive therapy is the best evidence of potential immunopathophysiology: the majority of patients show hematologic improvement after transient T cell depletion of antithymocyte globulins [Citation11,Citation12]. Although the immune pathophysiological characteristics of AA are well established, there are no biomarkers to better understand the immune status of individual AA patients, including the severity of the disease and response to treatment [Citation13]. Reliable biomarkers that correlated with disease severity or response will be helpful for individual treatment decisions and in clinical trials.
ILCregs have been identified with both innate lymphoid cells and regulatory cells characteristics. They express some specific genes such as id2, id3, sox4, tgfbr1, tgfbr2, il2rb, and il2rg, and continue expressing specific cytokines such as IL-10 and TGF-b1 [Citation4–6]. More studies had been demonstrated the important roles that this subpopulation cells played in different patients [Citation7–9,Citation14]. Our previous study results demonstrated deficient regulatory innate lymphoid cells and differential expression of miRNAs in acute myeloid leukemia [Citation7]. Another study demonstrated the ILCregs exist in human and mouse kidneys, express similar surface markers, and form a similar proportion of total renal innate lymphocytes. These cells secrete IL-10 and TGF-β to inhibit the innate immune cells. Regulatory innate lymphocytes inhibit the inflammation and ischemia/reperfusion injury of the kidney [Citation8]. Morita et al. have found IL-10+ ILCregs, which were converted from ILC2s by means of retinoic acid stimulation, expressed a regulatory T cell–like signature with expression of IL-10, cytotoxic T lymphocyte–associated protein 4, and CD25, with down-regulated effector type 2–related markers. Retinoic acid transformed ILC2s into ILCregs through a unique immunomodulatory and antiinflammatory pathway. The interaction between airway epithelial cells and ILC2s plays an important role in the production of ILCregs [Citation9]. However, a recent study on the ILCregs demonstrated controversial results. Results showed that ILC2s provide an inducible source of IL-10 in the gastrointestinal tract, whereas ILCregs are not a generalizable immune cell population in mice [Citation15]. Thus, further research is needed to clarify the discrepancy between these findings.
The pathogenesis of AA has been defined as immune-mediated destruction of hematopoietic stem and progenitor cells, leading to a marrow hematopoiesis failure and peripheral pancytopenia. Recent studies have shown the clonal disorder characterized by karyotypic abnormalities, genomic instability, telomere attrition, and recurrent somatic mutations reminiscent [Citation1]. Both pre-clinical and clinical studies supported the immune-mediated phenomenon with both adaptive and innate immune system involved in contributing to hematopoietic progenitor injury [Citation1]. Activated and resting regulatory T cells (Treg) are reduced and functionally defective to suppress effector T-cell activity [Citation16]. Researchers have identified a particular Treg subset, with phenotypic expression of CD95, CCR4, and CD45RO within FOXP3high, CD127low, to predominate among treatment responders [Citation17]. Due to the nature of both innate lymphoid and regulatory cells characteristics, ILCregs may play an important role in the pathogenesis of AA and the frequency and related functions have not been explored yet. Here we measured the frequency of ILCregs from patients with AA. Results demonstrated the ILCreg subset population was significantly decreased in the patients with AA comparing to HD. This is consistent with other findings regarding the pathogenic immune response in AA [Citation1,Citation16,Citation17].
Circulating microRNAs (miRNAs, small non-coding RNA molecules of about 22 nucleotides), have been described as potential biomarkers of AA and MDS [Citation18,Citation19]. There is evidence that miRNAs play an important role in controlling and modulating immunity, promoting the survival and growth of malignant cells and tumor metastasis [Citation20,Citation21]. Some studies have shown that cancer cell-specific miRNAs exist in plasma or serum, suggesting that these molecules are useful as potential biomarkers of diseases [Citation22,Citation23]. Although the role of miRNA in AA patients has not been completely clarified yet, the study showed microRNAs could be related to intracellular functions, such as metabolism, cell survival, and proliferation. Clinical parameters and progression-free survival were correlated to microRNA expression levels in AA patients before and after six months of immunosuppressive therapy. One microRNA, miR-126-5p, was negatively correlated with a response to therapy in AA: patients with higher relative expression of miR-126-5p at diagnosis had the shortest progression-free survival [Citation24]. Another study demonstrated circulating miRNAs can be used as potential biomarkers in AA for the diagnosis and for disease monitoring [Citation18].
Here we reported the results of miRNA sequence from patients with AA. We have identified that some of the miRNAs had been found unique in patients with AA, comparing with HD. Significant difference had been found between AA and HD with the miRNA including hsa-miR-1468-5p, hsa-miR-370-3p, hsa-miR-1268b, hsa-let-7c-5p, hsa-miR-1268b, hsa-miR-1306-5p, hsa-miR-3151-5p, hsa-miR-432-5p, and hsa-miR-188-3p. These miRNAs had been correlated with different ILCregs specific genes. However, our results did not find significant changes with the miRNAs reported by the references [Citation14,Citation20]. Combining with the abnormalities of ILCregs and its gene-related miRNAs, the clinical significance of ILCregs and miRNAs in patients with AA needs further exploration.
Conclusion
Our study enumerated ILCregs and measured ILCregs genes associated miRNAs in AA patient. The results demonstrated the deficiency of ILCreg and miRNA differential expression in patients with AA. Differential expression patterns of miRNAs had been found in patients with AA, compared with HD. However, due to the limitations of study sample size and without clinical follow-up, more studies need to be done to explore the clinical significance of ILCregs and miRNAs for the diagnosis and prognosis in patients with AA needs further exploration.
Declarations
Ethics approval and consent to participate: Informed consent was obtained from all patients and the protocol was approved by the Ethics Committee of the First Affiliated Hospital of Zhengzhou University.
Consent for publication: All authors contributed to data analysis, drafting or revising the article, gave final approval of the version to be published, and agree to be accountable for all aspects of the work.
Supplemental Material
Download MS Excel (46 KB)Supplemental Material
Download MS Excel (32.5 KB)Acknowledgements
All authors made substantial contributions in drafting the article or revising it critically for important intellectual content; gave final approval of the version to be published; and agreed to be accountable for all aspects of the work.
Disclosure statement
No potential conflict of interest was reported by the author(s).
Data availability statement
Data and material will be available upon corresponding author approval. All data sets analyzed for this study are included in the manuscript and the additional files.
Additional information
Funding
Related Research Data
References
- Boddu PC, Kadia TM. Updates on the pathophysiology and treatment of aplastic anemia: a comprehensive review. Expert Rev Hematol. 2017;10(5):433–448.
- Balderman SR, Calvi LM. Biology of BM failure syndromes: role of microenvironment and niches. Hematology Am Soc Hematol Educ Program. 2014;2014(1):71–76.
- Wu Q, Zhang J, Shi J, et al. Increased bone marrow (BM) plasma level of soluble CD30 and correlations with BM plasma level of interferon (IFN)-gamma, CD4/CD8 T-cell ratio and disease severity in aplastic anemia. PLoS One. 2014;9(11):e110787.
- Wang S, Xia P, Chen Y, et al. Regulatory innate lymphoid cells control innate intestinal inflammation. Cell. 2017;171(1):201–216.e18.
- Zeng B, Shi S, Liu J, et al. Commentary: regulatory innate lymphoid cells control innate intestinal inflammation. Front Immunol. 2018;9:1522.
- Yu J. Regulatory innate lymphoid cells: A new subset of innate immune lymphocytes with more potential functions to be discovered in immune regulation. J Curr Med Res Opin. 2020;3(01).
- Yu J, Li Y, Pan Y, et al. Deficient regulatory innate lymphoid cells and differential expression of miRNAs in acute myeloid leukemia quantified by next generation sequence. Cancer Manag Res. 2019;11:10969–10982.
- Cao Q, Wang R, Wang Y, et al. Regulatory innate lymphoid cells suppress innate immunity and reduce renal ischemia/reperfusion injury. Kidney Int. 2020;97(1):130–142.
- Morita H, Kubo T, Rückert B, et al. Induction of human regulatory innate lymphoid cells from group 2 innate lymphoid cells by retinoic acid. J Allergy Clin Immunol. 2019;143(6):2190–2201.e9.
- Killick SB, Bown N, Cavenagh J, et al. Guidelines for the diagnosis and management of adult aplastic anaemia. Br J Haematol. 2016;172(2):187–207.
- Young NS, Calado RT, Scheinberg P. Current concepts in the pathophysiology and treatment of aplastic anemia. Blood. 2006;108(8):2509–2519.
- Scheinberg P, Nunez O, Weinstein B, et al. Horse versus rabbit antithymocyte globulin in acquired aplastic anemia. N Engl J Med. 2011;365(5):430–438.
- Hosokawa K, Muranski P, Feng X, et al. Memory stem T cells in Autoimmune disease: High frequency of circulating CD8+ Memory stem cells in Acquired aplastic anemia. J Immunol. 2016;196(4):1568–1578.
- Bonne-Annee S, Bush MC, Nutman TB. Differential Modulation of human innate lymphoid cell (ILC) Subsets by IL-10 and TGF-beta. Sci Rep. 2019;9(1):14305.
- Bando JK, Gilfillan S, Di Luccia B, et al. ILC2s are the predominant source of intestinal ILC-derived IL-10. J Exp Med. 2020;217(2):e20191520.
- Kordasti S, Marsh J, Al-Khan S, et al. Functional characterization of CD4+ T cells in aplastic anemia. Blood. 2012;119(9):2033–2043.
- Kordasti S, Costantini B, Seidl T, et al. Deep phenotyping of Tregs identifies an immune signature for idiopathic aplastic anemia and predicts response to treatment. Blood. 2016;128(9):1193–1205.
- Hosokawa K, Kajigaya S, Feng X, et al. A plasma microRNA signature as a biomarker for acquired aplastic anemia. Haematologica. 2017;102(1):69–78.
- Butler JT, Abdelhamed S, Kurre P. Extracellular vesicles in the hematopoietic microenvironment. Haematologica. 2018;103(3):382–394.
- Wang WT, Chen YQ. Circulating miRNAs in cancer: from detection to therapy. J Hematol Oncol. 2014;7:86.
- Tomasetti M, Santarelli L, Neuzil J, et al. MicroRNA regulation of cancer metabolism: role in tumour suppression. Mitochondrion. 2014;19 Pt A:29–38.
- Grasedieck S, Sorrentino A, Langer C, et al. Circulating microRNAs in hematological diseases: principles, challenges, and perspectives. Blood. 2013;121(25):4977–4984.
- Wang J, Chen J, Sen S. MicroRNA as biomarkers and diagnostics. J Cell Physiol. 2016;231(1):25–30.
- Giudice V, Banaszak LG, Gutierrez-Rodrigues F, et al. Circulating exosomal microRNAs in acquired aplastic anemia and myelodysplastic syndromes. Haematologica. 2018;103(7):1150–1159.