
ABSTRACT
Objectives
Reactive oxygen species (ROS) are under scrutiny as a participant in the pathophysiology of myelodysplastic syndrome (MDS) and the progression of MDS to acute myeloid leukemia (AML). Measurement of intracellular ROS (iROS) is particularly important since iROS is a direct indicator of cellular health and integrity.
Methods
We developed a technique to measure standardize iROS (siROS) level in lymphocytes and bone marrow (BM) CD34+ hematopoietic progenitors using the fluorescent probe dichlorofluorescein (DCF). We then quantified the siROS in 38 consecutive BM specimens from 27 MDS patients over the course of 10 months. Disease outcome of these patients were also assessed.
Results
High serum ferritin, high blast count and poor IPSS were associated with inferior survival and AML progression in this cohort. High blast MDS patients had lower siROS in their BM CD34+ cells than those of low blast patients, consistent with increased reliance on glycolysis and enhanced ROS defense in high blast MDS. We also observed narrower siROS distribution in the BM CD34+ cells of high blast patients, suggesting that loss of heterogeneity in ROS content accompanies the clonal evolution of MDS. Furthermore, we observed a strong correlation between CD34+ cells siROS and serum ferritin level in high blast patients. In one case, iron chelation therapy (ICT) resulted in parallel decreases in serum ferritin and CD34+ cells siROS.
Conclusion
Our findings established the siROS profile in early hematopoietic cells of MDS patients and its relationship with blast count and iron overload.
Highlights
High serum ferritin, high blast count and poor IPSS were associated with inferior overall survival and AML progression in our cohort.
We developed a method to standardize the intracellular ROS (siROS) level in bone marrow cells of MDS patients.
CD34+ cells from high blast count MDS patients had lower siROS level and narrower distribution than the corresponding cells from low blast MDS patients.
Serum ferritin was correlated with siROS in CD34+ cells from high blast patients.
Iron chelation therapy (ICT) decreased serum ferritin and siROS in CD34+ cells.
Introduction
Reactive oxygen species (ROS) are natural by-products of mitochondrial respiration and have a crucial role in various signaling pathways, homeostasis, and cellular function [Citation1]. Excess intracellular ROS (iROS) induce oxidative stress by overwhelming the cell’s antioxidant defense, resulting in damage to biomolecules and subsequently triggering mutagenesis or cell death. In myelodysplastic syndrome (MDS), iROS homeostasis could be affected by several mechanisms. One of the mechanisms could be secondary hemochromatosis as a result of chronic red blood cell (RBC) transfusion in a large proportion of MDS patients [Citation2]. Excess iron contributes to the induction of oxidative stress by catalyzing the generation of hydroxyl radicals via the Haber–Weiss reaction. It has been hypothesized that iron-induced oxidative stress may damage CD34+ hematopoietic stem cells (HSCs) and progenitors, further impairing hematopoiesis and accelerating the progression of MDS to acute myeloid leukemia (AML) [Citation3]. Hence, oxidative stress may contribute to the impairment of hematopoiesis in MDS and may exert a selective pressure promoting disease progression, and thus investigation of the iROS level of CD34+ bone marrow cells from MDS patients is of significant interest. In this paper, we report the correlation between iron overload and disease outcomes from a cohort of 27 MDS patients. We further discuss the development of a standardized iROS (siROS) measuring method in CD34+ bone marrow cells using 2’,7'-dichlorodihydrofluorescein diacetate (DCFH-DA), as well as changes of siROS in these cells in relation to blast count and iron overload in MDS.
Methods
Study cohort
The study cohort consisted of 27 patients recruited from the MDS Program at the Odette Cancer Centre. Patient characteristics were recorded at the time of bone morrow (BM) collection. Overall survival of these patients was calculated based on the time between the most recent BM collection and death (as a result of all causes) or end of follow-up in September 2011 (censored observation). AML progression was calculated based on the time between the most recent BM collection and AML diagnosis – death due to other causes or end of follow-up were censored. For assessment of BM cells, 38 consecutive BM specimens were obtained by iliac crest aspiration between November 2007 and August 2008 from the cohort. Peripheral blood (PB) was drawn from the median cubital vein of healthy volunteers for the extraction of normal PB lymphocytes. The study was approved by the Research Ethics Board of Sunnybrook Health Sciences Centre, and informed consent was obtained from all participants.
Sample collection and processing
Both BM and PB specimens were collected in BD Vacutainer blood collection tubes containing lithium heparin (BD-Canada, Mississauga, ON, Canada). The plasma from each specimen was collected after centrifugation at 300 g for 10 min. The rest of the specimen was then diluted 1:1 with Ca2+ and Mg2+ free Dulbecco’s phosphate-buffered-saline (PBS) (Life Technologies, Burlington, ON, Canada). Mononuclear cells (MNCs) were purified from the specimen by density gradient centrifugation using Ficoll-Paque PLUS (GE Healthcare Life Sciences, Baie-D'Urfe, QC, Canada) according to the manufacturer’s recommendation. Remaining red blood cell (RBC) were lysed by incubating with RBC lysis buffer (Life Technologies) on ice for 10 min. The MNCs were washed and resuspended in PBS for subsequent assays. All specimens were collected, processed, and assayed within the same day unless indicated otherwise.
Intracellular ROS measurement
DCFH-DA (Sigma-Aldrich, Oakville, ON, Canada) was reconstituted in DMSO according to the manufacturer’s recommendation, then aliquoted and frozen at −20°C in the dark until use. For iROS measurement, 1 × 10⁶ MNCs were incubated with a 10 µM final concentration of DCFH-DA in serum-free RPMI-1640 media (Life Technologies) at 37°C for 15 min in a humidified atmosphere of 5% CO2 in air. DCFH-DA is converted into cell-bound 2’,7'-dichlorodihydrofluorescein (DCFH) by cellular esterase and subsequently oxidized by iROS to form the fluorescent compound 2′,7′-dichlorofluorescein (DCF). The fluorescent intensity of DCF is proportional to the amount of iROS contained in the cells. The cells were washed twice with PBS, and then incubated with 10 µl of anti-human CD34-PE antibody (BD Biosciences, Mississauga, ON, Canada) in 100 µl of PBS at room temperature for 15 min in the dark. The cells were washed twice with PBS before they were analyzed by flow cytometry using a BD FACSCalibur cytometer (BD Biosciences). All data were acquired with Cell Quest software (BD Biosciences) and analyzed by FlowJo for Mac (Tree Star, Ashland, OR, USA).
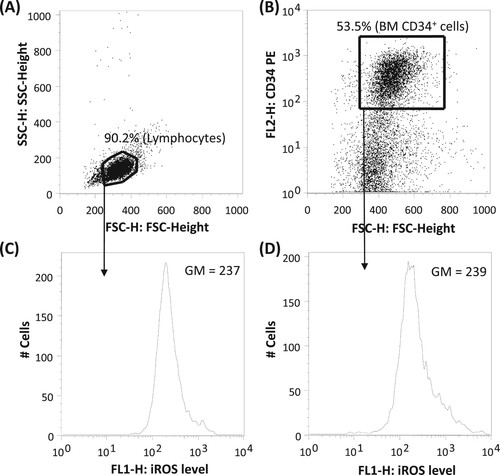
The lymphocyte population from the MNCs was selected based on their forward (FSC) and side (SSC) scatter characteristics (A) [Citation4]. CD34+ cells were selected based on CD34 positivity (B). The identity of these populations was further verified based on CD45 and SSC characteristics (not shown). The iROS level of lymphocytes and CD34+ cells were assessed based on the geometric mean (GM) of DCF signal at the FL1 channel (C and 1D, respectively). Standardized iROS (siROS) was calculated by dividing the iROS of BM lymphocytes or CD34+ cells with a concurrently-determined iROS of fresh normal PB lymphocytes. The narrowness of iROS distribution was assessed using the robust coefficient of variation (robust CV) of the iROS reading. Robust CV is defined as 68.26% of the events around the median relative fluorescent intensity, expressed as a percentage of the median.
Figure 1. Cell gating criteria. (A) Lymphocyte population and (C) the corresponding iROS level. (B) BM CD34+ cell population and (D) the corresponding iROS level.
Figures and data analysis
Figures and statistical analyses were prepared by FlowJo, GraphPad Prism 5 (GraphPad Software, Inc., La Jolla, CA, USA) or Microsoft Excel. Overall survival and AML progression were plotted on Kaplan-Meier (KM) survival curves. Data were presented as mean ± standard deviation (SD) unless indicated otherwise. Statistical significance was set at P < 0.05 (two-sided) as determined by survival, nonparametric two-sample, or Pearson’s correlation analyses.
Results
Patient characteristics and disease outcomes
Detailed patient characteristics and outcomes are listed in Table S1 and summarized in . At the time of BM specimen collection, 15 of the 27 patients had low-grade MDS (eg. RA, RARS) with a blast count less than 5%, whereas the remaining 12 had high-grade MDS (RAEB-1 and RAEB-2) with a blast count between 5–19%. For patients with repeated BM specimens collected, none had their diagnosis changed from low-grade to high-grade or vice versa between BM collections. Serum ferritin levels were higher and more widely distributed for high blast (median 1660 µg/L range 147–10132 µg/L) than low blast patients (median 596 µg/L range 19–1974µg/L) (Kolmogorov–Smirnov test P < 0.05), indicative of less severe iron overload for low blast patients. Furthermore, 9 patients (33.3%) were transfusion dependent but only 3 (11.1%) received iron chelation therapy by desferrioxamine.
Table 1. Clinical characteristics of the cohort.
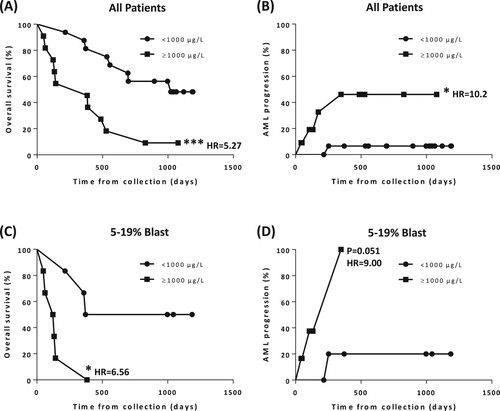
At the end of follow-up in September 2011, 18 patients (66.7%) had died, including 5 patients (18.5%) whose disease progressed to AML. Kaplan-Meier analysis revealed that iron overload, defined as serum ferritin ≥1000 µg/L [Citation2], was significantly associated with inferior overall survival (P < 0.005, hazard ratio [HR] = 5.27, A) and AML progression (P < 0.05, HR = 10.2, B). The association between iron overload and inferior survival persisted for high blast count patients (<5% vs. 5–19% blast, P < 0.05, HR = 6.56, C), and there was a trend towards statistical significance for AML progression (P = 0.051, HR = 9.00, D). In addition, high blast count (Figure S1) and poor IPSS score (Int-2/High, Figure S2) were associated with inferior survival and AML progression.
Figure 2. Kaplan-Meier (KM) plot based on patient’s serum ferritin level at the time of BM specimen collection. (A) Overall survival for all patients (median survival: ≥1000 µg/L, 383 days, N = 11 versus <1000 µg/L, 1022 days, N = 16; P < 0.005, HR = 5.27). (B) AML progression for all patients (median survival: ≥1000 µg/L, N/A, N = 11 versus <1000 µg/L, N/A, N = 16; P < 0.05, HR = 10.2). (C) Overall survival for patients with 5–19% blast (median survival: ≥1000 µg/L, 127 days, N = 6 versus <1000 µg/L, 778.5 days, N = 6; P < 0.05, HR = 6.56). (D) AML progression for patients with 5–19% blast (median survival: ≥1000 µg/L, 347, N = 6 versus <1000 µg/L, N/A, N = 6; P = 0.051, HR = 9).
Experimental variation in iROS measurement
We set out to investigate the variability of DCF measurement over multiple experiments and develop a standardized method suitable for routine clinical application. To assess intra-experimental variation, we measured the iROS level of PB lymphocytes from four healthy volunteers. All specimens were concurrently obtained, processed, and analyzed. The variation in PB lymphocyte iROS between volunteers was small, with a mean GM of 214 ± 5.35 (2.5%; Figure S3A). This observation suggested comparable oxidative state in the PB lymphocytes among individuals, and that intra-experimental variation of DCF measurement is small. To assess inter-experimental variation, PB lymphocyte iROS was measured from a single healthy volunteer in 25 separate experiments performed over 35 weeks. Cell processing procedures and flow cytometry settings were kept consistent throughout the study. Nevertheless, PB lymphocyte iROS varied considerably, with a range of 141–437 and a mean GM of 257.52 ± 70.06 (27.2%, Figure S3B). These data demonstrated that inter-experimental variation of direct DCF measurement is high, thereby preventing reliable comparisons between specimens assayed on different days.
The source of the inter-experimental inconsistency is unclear but could be a consequence of the instability of the DCFH-DA reagent, or small but cumulative variations in time between the addition of DCFH-DA to the specimen and measurement of iROS by flow cytometry. Conversely, the tight clustering in PB lymphocyte iROS among different subjects assayed in a single experiment suggests that concurrent measurement of iROS from freshly obtained PB lymphocytes could be used for standardization. We also investigated other possible standardization controls using cultured cells and manipulated PB lymphocytes (overnight culture and cryopreservation). However, these materials yielded unacceptably high intra-experimental variation, and thus are not suitable to control for inter-experimental variation (data not shown).
Measurement of siROS in BM lymphocytes and CD34+ cells
We measured iROS in BM lymphocytes and CD34+ cells from 38 consecutive MDS patient BM aspirate specimens (Table S1). Individual bone marrow aspirates were obtained, processed, and analyzed in a single day. MDS patients were separated into two groups according to BM blast count (<5%, 16 aspirates from 15 patients; and 5–19%, 22 aspirates from 12 patients). We considered the possibility of using iROS measurements from each patient’s own bone marrow lymphocyte population to standardize for the iROS of CD34+ cells. However, the correlation between iROS of normal PB lymphocytes and patients’ BM lymphocytes was weak and varied depending on blast count (data not shown). We therefore elected to calculate siROS of BM CD34+ cells using a concurrently-determined iROS of fresh normal PB lymphocytes.
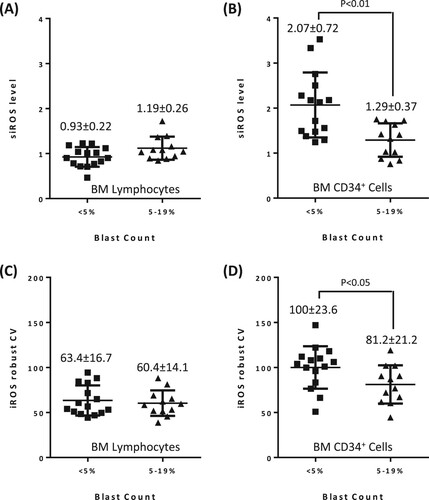
Although we observed some variations in BM lymphocyte siROS within the low and high blast groups, there was no significant difference between the two groups (A). In contrast, siROS of BM CD34+ cells in high blast patients were significantly lower than that of low blast patients (siROS of 1.29 ± 0.37 vs. 2.07 ± 0.72, Mann Whitney test P < 0.01, B). Further scrutiny of the shape of the iROS histogram revealed that the fluorescence signal was more widely distributed in the BM CD34+ cells of low blast patients (Figure S4A) than that of high blast patients (Figure S4B). To confirm this observation, we quantified the distribution of iROS using robust CV. The iROS in BM lymphocytes of the two blast count groups have similarly robust CV (C). Conversely, BM CD34+ cells of low blast patients had a wider iROS distribution than that of high blast patients (robust CV of 100 ± 23.6% vs. 81.2 ± 21.2%, Mann Whitney test P < 0.05, D). Hence, the difference in iROS distribution was specific to BM CD34+ cells.
Figure 3. siROS profile of patients with low blast (<5%, N = 15) versus high blast (5–19%, N = 12). The level of siROS (A and B) and iROS robust CV (C and D) in BM lymphocytes and BM CD34+ cells.
Iron overload and siROS in MDS
Free iron catalyzes the generation of iROS such as hydroxyl radicals via the Haber–Weiss reaction. We therefore examined siROS of BM lymphocytes and CD34+ cells in the context of iron overload. Serum ferritin was not correlated with siROS of BM lymphocytes (low or high blast, data not shown) or BM CD34+ cells from low blast patients (Figure S5A). On the contrary, we observed a significant correlation between serum ferritin and siROS of BM CD34+ cells from high blast patients (R = 0.613, P < 0.005, Figure S5B). To improve the estimation of free iron level, we transformed the value of serum ferritin by multiplying it with transferrin saturation. The transformed data suggested a strong correlation between the estimated free iron level and siROS of BM CD34+ cells in high blast patients with a serum ferritin above 1000 µg/L (R = 0.869, P < 0.005, A).
Figure 4. siROS of CD34+ cells and serum ferritin. (A) Correlation between siROS level in BM CD34+ cells and serum ferritin level adjusted by transferrin saturation, in high blast count patients (5–19%) with ferritin above 1000 μg/L. (B) Corresponding decrease of serum ferritin level, siROS level in CD34+ cells and bone marrow lymphocyte in patient number 11 upon iron chelation therapy (deferoxamine, 1000 mg/d, treatment initiated at day 0).
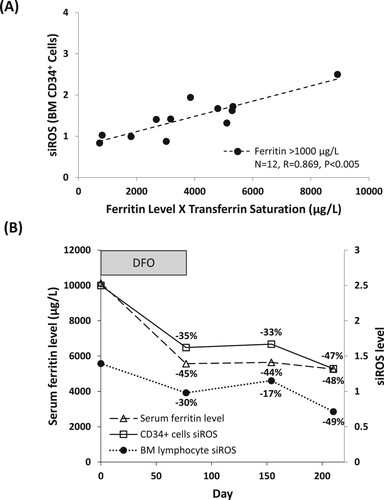
If iron overload contributes to oxidative stress in BM CD34+ cells, then iron chelation therapy should result in the corresponding reduction of siROS. To examine this, we measured siROS and serum ferritin in one high blast count patient (patient number 11) with RAEB-2 over the course of 210 days, who received deferoxamine for transfusion-related iron overload. We observed a decrease in serum ferritin, as well as siROS in BM lymphocytes and CD34+ cells following the initiation of iron chelation therapy; the time course and magnitude of the decrease in serum ferritin and siROS were comparable to each other (B). Nonetheless, the patient also received G-CSF and Lenalidomide during the observation period, and hence the potential contribution of these treatments to siROS could not be ruled out.
Discussion
This objective of this study was to evaluate the initial clinical feasibility and utility of siROS measurement in the BM HSC/progenitor cells from a small cohort of MDS patients. Nonetheless, our follow-up analysis showed that high blast count and poor IPSS were associated with inferior overall survival and AML evolution, consistent with published results [Citation5]. It is therefore reasonable to assume that this cohort is an adequate representation of MDS despite its limited size. Moreover, the association between high serum ferritin and poor disease outcome in this study contributes to a growing body of evidence that highlight the negative consequence of iron toxicity in MDS [Citation2,Citation3,Citation6].
There were differences in the siROS profile of BM CD34+ cells, as measured by the siROS level and its corresponding robust CV, between MDS patients with low blast count and high blast count. In patients with low blast count, siROS were significantly higher than in patients with high blast count. Since oxidative stress is strongly associated with the progression of malignancy [Citation7], this may seem counterintuitive. It is, however, consistent with previous observations on energy metabolism in MDS. In high blast MDS and in AML, Akt signalling is activated [Citation8], indicating a reliance on glycolysis [Citation9], whereas in low blast MDS Akt is inactive and mitochondrial oxidative phosphorylation predominates. Since mitochondrial respiration is the principal source of reactive oxygen intermediates, from which the production of ROS proceeds, our observation of higher siROS in low blast MDS is unsurprising. Xiao et al reported higher ROS level in high-risk than in low-risk MDS patients, a finding inconsistent with our observations [Citation10]. The differences in these findings may be due to patient selection and methodological differences, including lack of standardization of iROS with an external standard and flow cytometry techniques.
We also observed greater heterogeneity in CD34+ cell siROS in the low blast group, as reflected in the high robust CV in these patients. The CD34 antigen is expressed on the surface of various HSCs and progenitors, which exhibit a range of metabolic activities and oxygen availability in their corresponding bone marrow niches. For example, the ROS level of primitive HSCs is lower than in other HSCs [Citation11]. Therefore, when viewed as a single population in the bone marrow of low blast patients, CD34+ cells displayed a wider siROS distribution than the corresponding population in high blast patients, reflecting the presence of a mixture of cell types. We speculate that during the course of clonal evolution to a more aggressive form of MDS, this natural heterogeneity is lost as the CD34+ population becomes homogeneous. Interestingly, the only low blast count patient (patient number 23) whose disease progressed to AML had the narrowest robust CV among the group – plausibly indicative of advanced MDS clonal evolution even though other diagnostic indicators suggested low-grade disease.
Ghoti et al reported a correlation between serum ferritin levels of low-risk MDS patients and iROS in peripheral blood erythrocytes and platelets but not lymphocytes or polymorphonuclear cells [Citation12]. It is possible that iron induced ROS generation may depend on the microenvironment, as well as cell-type and cell-context. To probe the mechanisms of the effects of ROS and iron overload on hematopoiesis and disease progression in MDS, it is necessary to interrogate the bone marrow HSC/progenitor compartment. We observed a significant correlation between serum ferritin and siROS in CD34+ cells of the high blast count patients, consistent with the prevailing model in which free iron enters HSCs and progenitors and subsequently increases oxidative stress in these cells via Fenton chemistry. Since both free iron and oxidative stress are known to cause mutagenesis and apoptosis [Citation13], our findings support the notion that iron overload may accelerate AML progression and worsen cytopenias in MDS by damaging HSCs and their progenitors via ROS. Moreover, the time course of the decrease in BM CD34+ cells siROS observed following institution of iron chelation therapy is consistent with the reported time course of ICT-mediated hematological improvement in MDS patients [Citation6], suggesting ROS reduction as a possible mechanism of this clinical benefit. Conversely, serum ferritin did not correlate with CD34+ cells siROS of low blast count patients. We speculate the lack of correlation could be a consequence of too few low blast patients with high serum ferritin (5 of 15 patients over 1000 µg/L and none over 2000µg/L). It is also possible that different HSC/progenitor subtypes in low blast patients have varying degrees of iROS production in response to iron loading. As a result, changes in siROS can be masked when viewed as a single CD34+ population.
There are limitations to this study that should be addressed in the future. The retrospective nature of this study makes our observations susceptible to potential bias and confounding variables. Our cohort was recruited from a single centre therefore referral and selection biases are possible. In addition, our limited sample size may be vulnerable to the effects of outliers and random noise. Moreover, DCF is a general detector of several types of ROS [Citation14], and therefore is not sufficient to determine the contribution of specific ROS, such as hydroxyl radicals, which are the products of the Haber–Weiss reaction. Other methods are available for the measurement of specific oxidative stress biomarkers, such as glutathione, 8-oxo-2′-deoxyguanosine and malondialdehyde. Although we did not investigate these biomarkers due to the limited availability of clinical materials, it will be useful to pinpoint the contribution of these biomarkers and determine their relationship to the siROS profile in the context of MDS. Nevertheless, our method in establishing siROS profile is cost-effective, highly compatible with current diagnostic workflow, and has good potential for seamless integration for routine clinical use. In future studies, it will be necessary to confirm our findings in a larger cohort, as well as to evaluate the potential diagnostic and prognostic values of the siROS profile in BM CD34+ cells in MDS. Analysis of serial BM specimens will also be crucial to elucidate the biological nature of iron toxicity and the potential benefit of iron chelation – especially for high-risk patients who are usually not considered for iron chelation therapy [Citation3]. Finally, the majority of specimens were acquired prior to the era of widespread availability in Canada of hypomethylating agents and deferasirox for the treatment of higher risk MDS and iron overload, respectively. It will be important in future to determine how the use of these agents may impact on siROS and its relation to clinical outcomes.
In conclusion, ex vivo assessment of iROS using DCF requires standardization in order to allow inter-experimental assessment. By standardizing iROS measurements with those of fresh normal lymphocytes, we determined that the siROS level of BM CD34+ cells was lower in MDS patients with high blast count than those with low blast count. In MDS patients with high blast count, the siROS of BM CD34+ cells was also associated with iron overload. Finally, both iron burden and siROS can be reduced by iron chelation therapy, possibly translating to clinical benefit for MDS patients.
Disclosure statement
No potential conflict of interest was reported by the author(s).
Additional information
Funding
References
- Zhou D, Shao L, Spitz DR. Reactive oxygen species in normal and tumor stem cells. Adv Cancer Res. 2014;122:1–67.
- Gattermann N, Rachmilewitz EA. Iron overload in MDS-pathophysiology, diagnosis, and complications. Ann Hematol. 2011;90(1):1–10.
- Leitch HA. Controversies surrounding iron chelation therapy for MDS. Blood Rev. 2011;25(1):17–31.
- Vitale M, Papa S, Mariani AR, et al. Use of poligonal windows for physical discrimination among mononuclear subpopulations in flow cytometry. J Immunol Methods. 1987;96(1):63–68.
- Greenberg P, Cox C, LeBeau MM, et al. International scoring system for evaluating prognosis in myelodysplastic syndromes. Blood. 1997;89(6):2079–2088.
- Leitch HA, Gattermann N. Hematologic improvement with iron chelation therapy in myelodysplastic syndromes: clinical data, potential mechanisms, and outstanding questions. Crit Rev Oncol Hematol. 2019;141:54–72.
- Sesti F, Tsitsilonis OE, Kotsinas A, et al. Oxidative stress-mediated biomolecular damage and inflammation in tumorigenesis. In Vivo. 2012;26(3):395–402.
- Nyakern M, Tazzari PL, Finelli C, et al. Frequent elevation of Akt kinase phosphorylation in blood marrow and peripheral blood mononuclear cells from high-risk myelodysplastic syndrome patients. Leukemia. 2006;20(2):230–238.
- Herst PM, Howman RA, Neeson PJ, et al. The level of glycolytic metabolism in acute myeloid leukemia blasts at diagnosis is prognostic for clinical outcome. J Leukoc Biol. 2011;89(1):51–55.
- Xiao Y, Wang J, Song H, et al. CD34+ cells from patients with myelodysplastic syndrome present different p21 dependent premature senescence. Leuk Res. 2013;37(3):333–340.
- Jang YY, Sharkis SJ. A low level of reactive oxygen species selects for primitive hematopoietic stem cells that may reside in the low-oxygenic niche. Blood. 2007;110(8):3056–3063.
- Ghoti H, Amer J, Winder A, et al. Oxidative stress in red blood cells, platelets and polymorphonuclear leukocytes from patients with myelodysplastic syndrome. Eur J Haematol. 2007;79(6):463–467.
- Lu W, Zhao M, Rajbhandary S, et al. Free iron catalyzes oxidative damage to hematopoietic cells/mesenchymal stem cells in vitro and suppresses hematopoiesis in iron overload patients. Eur J Haematol. 2013;91(3):249–261.
- Marrocco I, Altieri F, Peluso I. Measurement and clinical significance of biomarkers of oxidative stress in humans. Oxid Med Cell Longev. 2017;6501046; doi:https://doi.org/10.1155/2017/6501046.