
ABSTRACT
Objection
Immunotherapy based on T cells is a new therapy for Acute myeloid leukemia (AML). However, there has not been considerable improvement compared with traditional chemotherapeutics. This study aimed to identify important immune cells, genes, and drugs associated with the immunotherapy of AML.
Methods
The gene expression profile and clinical data of patients with AML were downloaded from TCGA database, and the abundance ratio of immune cells was obtained via CIBERSORT. Kaplan–Meier (KM) survival analysis was used to assess the relationship between immune cells and survival time of patients with AML. Differentially expressed genes (DEGs) analysis was conducted to obtained DEGs related to mast cells. Then, protein-protein interaction (PPI) analysis and enrichment analysis were performed to explore the hub genes. Finally, Connectivity Map (CMap) database was utilized to predicts potential drugs that may reverse or induce the mast cell-related gene expression.
Results
Our study showed that mast cell was correlated with survival time of patients with AML, and 135 genes were screened to be related with mast cells. 6 hub genes were identified via PPI network, and 3 potential small molecule drugs were screened to be related to regulating the mast cell-related gene expression via CMap database.
Conclusion
The hub genes and drugs have high research value and clinical application in AML therapy. Our study not only provides gene targets and small molecule drugs for AML immunotherapy concerning mast cells but also provides new ideas for researchers to explore immunotherapy targets of other tumors.
1. Introduction
Acute myeloid leukemia (AML) refers to a group of myeloid malignancies with remarkably heterogeneous outcomes, which is a malignant cancer of the blood that generates in the bone marrow [Citation1]. It is commonly diagnosed in adults over the age of 65 [Citation2]. The incidence of AML has increased by more than 30% since the 1990s and the motility has increased more than 79% since the early 1970s [Citation3]. Although AML is relatively rare, it is reported that AML accounts for roughly 1.2% of cancer deaths [Citation4,Citation5]. Meanwhile, the incidence of AML is expected to increase owing to the aging population. Patients with AML usually present with complications of disordered hematopoiesis: bleeding, fatigue, refractory infections, or the clinical consequences of an extremely high white blood cell count: difficulty breathing, confusion, or other symptoms of organ failure [Citation6]. The malignant myeloid cells are composed of coexisting competing clones and the disease evolves over time. Generally speaking, AML is mainly characterized by unbounded proliferation of myeloid progenitor cells.
Conventional therapy for patients with AML is chemotherapeutics, which is successful in treating patients with leukemia, with five-year survival rates being at 27.4% [Citation7]. However, this rate is lower than the rate for those patients treated with SCTs (stem cell transplantations). In addition, the success of SCTs is supposed to be considered in a background of 15–25% mortality owing to the treatment itself [Citation8], which means this treatment may not be the most appropriate therapy for patients. Considering the situation of treatment of AML mentioned above, the future of cancer therapy is increasingly focused on immunotherapy [Citation9], which is seen as the proper treatment for AML. Immunotherapy is a treatment that stimulates the body’s own immune system to recognize and kill tumor cells. The effect of immunotherapy is based on significant targets. We are considering that it is beneficial to the therapy for the patients with AML to screen and identify some potential biomarkers or genes associated with immune cells infiltrating in the bone marrow of patients with AML. Studies on the tumor microenvironment are becoming hot spots in the field of cancer immunotherapy [Citation10]. The tumor microenvironment, surrounding environment of tumor cells, consists of immune cells, mesenchymal cells, endothelial cells, inflammatory mediators and extracellular molecules [Citation11]. The microenvironment of the tumor has a profound effect on tumor proliferation, escape, and metastasis [Citation12]. Furthermore, the components in the tumor microenvironment are essential for the development of tumor cells [Citation13].
Thus, in this study, we first downloaded the dataset of patients with AML from TCGA. Then we analyzed the immune cells concerning the microenvironment of AML to confirm some correlation between immune cells, which indicates that the mast cells were identified as critical immune cells related to survival time compared with other immune cells. In addition, we identified hub genes among the mast cells, including mast cells activated and mast cells resting. Consequently, we found six hub genes and validated the relation between these six genes and overall survival. Based on the Connectivity Map (CMap) database, we explored the potential small molecule drugs influencing the mast cell infiltration and therapy for patients with AML. Summarily, our research provides clues and ideas to immunotherapy for patients with AML, which showed that mast cells are related to the prognosis of patients with AML and some genes identified in mast cells can be reconciled as potential biomarkers for treatment.
2. Materials and methods
2.1. Data acquisition and pre-processing
Data from the public domain was utilized in this study. Data relating to AML clinical information and RNA-Seq gene expression (including the FPKM and counts format), were downloaded from TCGA (The Cancer Genome Atlas, https://cancergenome.nih.gov/) using the gdc-client download tool. There are 151 AML cases in the TCGA database totally. R software (R Foundation for Statistical Computing, Vienna, Austria) was used for data extraction and subsequent analysis.
2.2. Assessment of immune infiltration based on CIBERSORT
CIBERSORT (http://cibersort.stanford.edu/), a deconvolution algorithm reported by Bindea et al., can characterize immune cells composition of complex tissues based on gene expression profiles [Citation14]. We utilized the RNA-Seq (FPKM format) of AML and CIBERSORT to obtain the abundance ratio matrix of 22 immune cells via R software [Citation15]. In total, 148 samples with P < 0.05 were used to do the subsequent analysis. Then, we analyzed and visualized the correlation among immune cells.
2.3. Survival analysis for immune cells
The Kaplan-Meier analysis for overall survival was proceeded based on the abundance ratio of 22 immune cells whose cut-off level was set at the median value with the aid of R software and the Log-Rank was utilized to test. We identified survival-related immune cells according to the results of the Kaplan-Meier survival analysis.
2.4. Identifying differentially expressed genes related to mast cells
According to the results of the Kaplan-Meier survival analysis, mast cells, including mast cells resting and mast cells activated, are related to survival. Then, we calculated the differentially expressed genes (DEGs) of each immune cell group by the edgeR package. |log2FC| > 1.5 and P < 0.05 were set as the threshold. A Venn plot, showing the common DEGs among three types of mast cells, was painted via diagrphVENN R package.
2.5. GO/KEGG analysis and GSEA analysis
For a more in-depth understanding of the selected DEGs, GO and KEGG enrichment analysis were applied using DAVID (https://david.ncifcrf.gov/) [Citation16,Citation17]. Counts ≥ 2 and P < 0.05 were set as the cut-off criterion. In addition, 148 samples were divided into two groups based on the expression of mast cells (median value) and gene set enrichment analysis (GSEA) software (http://software.broadinstitute.org/gsea/index.jsp) was applied in the two groups to verify the results of GO and KEGG analysis. The cut-off criteria for GSEA were P < 0.01and FDR < 0.025.2.6 PPI network construction and hub genes analysis.
The search tool for retrieval of interacting genes (STRING) is a database of comprehensive protein–protein interactions raging from direct (physical) to indirect (function) associations [Citation18]. The common DEGs were imported into STRING dataset to obtain the PPI network, and combined-score ≥ 0.3 was set as the threshold for screening protein–protein interaction. Then the network was reconstructed via Cytoscape software, a tool that focused on the visualizing of networks [Citation19], and analyzed via the ‘molecular complex detection (MCODE)’ plugin to get the hub genes [Citation16].
2.6. Exploring the correlation between hub genes and mast cells
After obtaining the hub genes, Pearson correlation analysis was used for testing the relationship between these hub genes and mast cells. Then, the Kaplan-Meier survival analysis was used to evaluate the prognostic value of these genes.
2.7. Screening potential small molecule drugs
Connectivity Map (CMap) database (http://www.broadinstitute.org) predicts potential drugs that may reverse or induce biological states encoded in specific gene expression markers [Citation20]. We divided the DEGs associated with mast cells into two groups, up-regulated group and down-regulated group. Then the two groups uploaded to the CMap for enrichment values ranging from –1 to +1 [Citation21]. Positive connectivity value indicated that the small molecule drugs could induce the mast cells-related genes’ expression, while negative connectivity value indicated the small molecule could reverse the mast cells-related genes’ expression.
PubChem (http://www.pubchem.ncbi.nlm.gov) is a public database for drugs and biological characteristics. We used the PubChem to analyze and display the six small molecule drugs structure in CMap results.
3. Results
3.1. Distribution of tumor-infiltrating cells
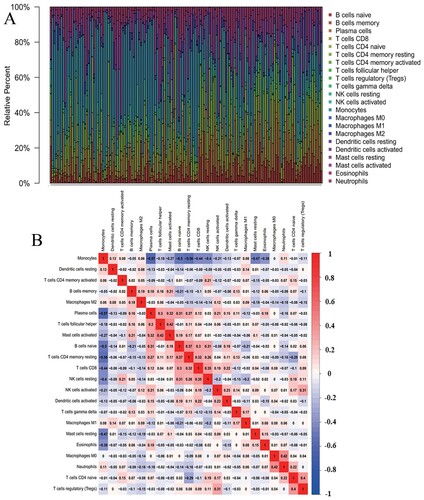
The abundance ratio of 22 immune cells in the 148 samples and their correlations were analyzed and shown in (A,B). From the results, we can find that the immune cells infiltration levels of AML are different from the other solid tumor. Monocyte is negatively related to Plasma cells and T cell CD4 memory resting, while neutrophil is positively related to macrophages M0.
Figure 1. Distribution of the abundance ratios of 22 immune cells. (A) The abundance ratio of immune cells in the 148 samples. Each column represents a sample, and each column with a different color and height indicates the abundance ratios of immune cells in this sample. (B) The relationship between the abundance ratios of various immune cells. The value represents the correlation value. Red represents a positive correlation, and blue represents a negative correlation.
3.2. Association between immune cells and overall survival
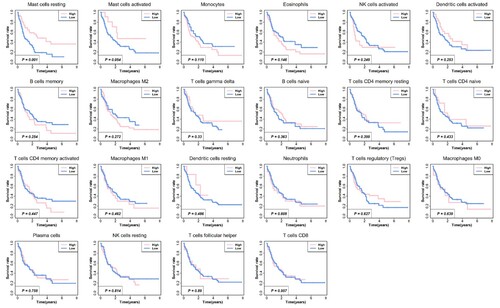
Based on the data of the abundance ratio of 22 immune cells in 148 samples, we conduct Kaplan-Meier survival analysis for 22 types of immune cells to explore the effect of these tumor-infiltrating cells on the prognosis of patients with AML. shows the survival curve of these immune cells. In TCGA dataset, it demonstrated that patients with low mast cells resting infiltration had significantly worse overall survival compared with patients with high mast cells resting infiltration. No significant difference was obtained in these cases with other tumor-infiltrating cells, especially the cases with T cells CD8, and that is different from other solid tumors [Citation13]. Consequently, current immunotherapy based on CD8+ T cells in patients with AML may not have great significance. Meanwhile, the therapy focused on the mast cells perhaps will make a positive influence on patients with AML.
Figure 2. Associations between 22 tumor-infiltrating immune cells and patients survival. Kaplan-Meier survival analysis was used, and the red line indicates a high expressing group of immune cells, and the blue line indicates a low expressing group of immune cells.
3.3. Identifying DEGs for mast cells
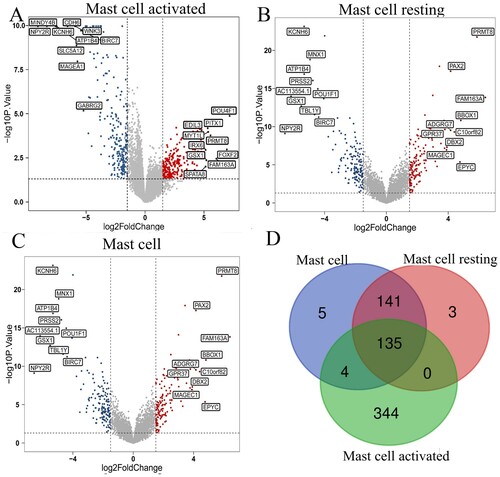
To have a further analysis of the relationship between the infiltration of mast cells and genes in AML, we analyzed the genes associated with mast cells, mast cells resting, and mast cells activated. There are 483, 279, 285 different expression genes in mast cells activated, mast cells resting, mast cells, respectively. The volcano plot of these three immune cells in (A–C) shows the DEGs. Then the Veen graph indicates the relationship of DEGs among three types of mast cells. There are 135 genes expressed in all three types of mast cells. In Table S1, we show the clinical data of AML patients, which are grouped according to the expression level of mast cells. The age of patients with low mast cell expression is more likely higher than patients with high mast cell expression.
Figure 3. Identifying differentially expressed genes for different kinds of mast cells. (A-C) Volcano plots of three different kinds of mast cells. |log2(FC)| > 1.5 and P < 0.05 were set as the cut-off value. The up-regulated 10 genes and down-regulated 10 genes with the most significant differences were labeled. (D) The Venn calculation result was shown via diagrphVENN R package. There are 135 common genes related to mast cells infiltration.
3.4. The potential pathways related to mast cells
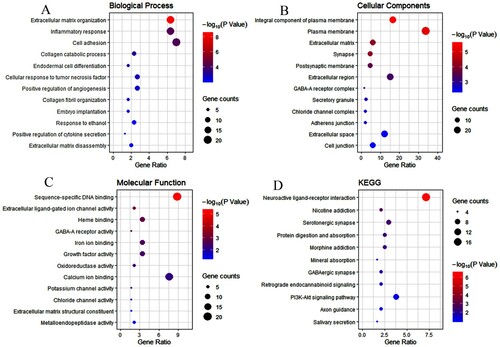
The GO enrichment analysis for 135 genes indicated that these genes were significantly enriched in the following terms, including signal transduction, inflammatory response, negative regulation of apoptotic, response to drug, etc. The KEGG enrichment analysis demonstrated that 135 genes significantly enriched in 11 pathways, including Neuroactive ligand–receptor interaction, Nicotine addiction, Morphine addiction, Protein digestion, and absorption, etc. The results of GO/KEGG were shown in .
Figure 4. Enrichment analysis of genes related to mast cells infiltration. A–D represent the enrichment analysis results of genes involved in immune cell infiltration, namely biological processes, cellular components, molecular functions, and KEGG. The main 12 results of each term are shown, and the color indicates the significant degree of enrichment and the size indicates the number of genes enriched for each result.
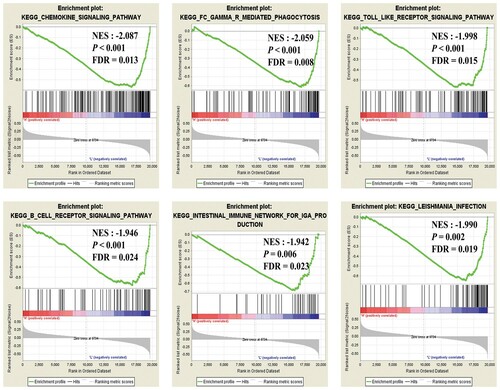
The GSEA analysis results for mast cells shows that the content of mast cell may be related to these signaling ways, such as chemokine, gamma-R mediated phagocytosis, Toll-like receptor, B cell receptor, etc. These signaling ways, shown in , affect the content of mast cells more or less.
Figure 5. Gene Set Enrichment Analysis (GSEA) for the mast cells of AML microenvironment. Green lines indicate the Enrichment score of each gene set. The P-value was obtained by 1,000 iterations of sample-shuffling. AML, Acute myeloid leukemia; NES, new enrichment score; FDR, false discovery rate.
3.5 Screening hub genes associated with AML
The obtained 135 common DEGs were used for PPI analysis and hub genes analysis. There are totally seven subnetworks and six seed genes in the MCODE analysis results. shows the six seed genes, called hub genes, namely GABRB2, HOXC10, IRX6, LEP, PTH2, GPR37. These hub genes can be potential treatment targets for mast cells, even for the immunotherapy of AML.
Table 1. Functional roles of the six hub genes.
3.6. Exploring the correlation between hub genes and mast cells
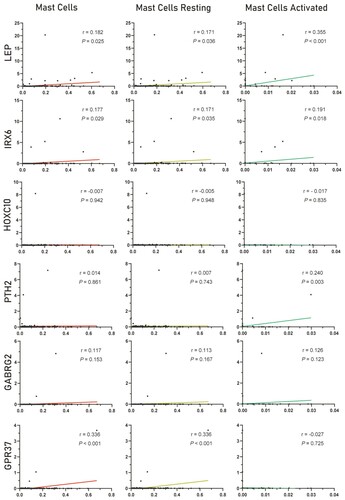
To explore the six hub genes, we conducted the survival analysis between these hub genes and survival time of patients with AML, which indicates that the two genes, LEP and IRX6, are significantly related to survival time. The results of these hub genes are shown in . Next, we explored the relationship between the hub genes and three types of mast cells, and the results were shown in . From the picture, we could find that these six genes are more likely positively related to mast cells.
Figure 6. Survival analysis for six hub genes. Kaplan-Meier survival analysis was performed. The red line indicates a high expressing group of gene expressions, and the blue line indicates a low expressing group of gene expressions.
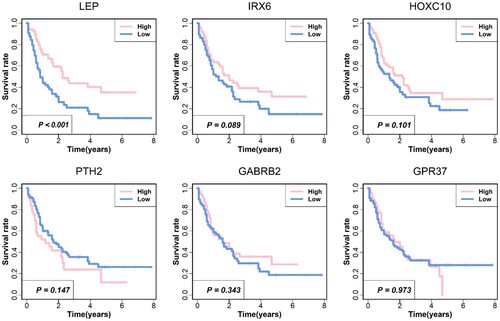
Figure 7. Correlation analysis between the six hub genes and mast cells. The three columns represent mast cells, mast cells resting and mast cells activated, and the six rows represent six genes respectively. The linear relationship was analyzed by Pearson correlation analysis.
3.7. Screening small molecule drugs related to mast cells
To identify the potential drugs for regulating mast cells, we have made relevant exploration via CMap database. shows the six most significant small molecule drugs and their enrichment values. shows the 2D structure of these six small molecules. Among these potential small molecule drugs, NU-1025, ketoconazole and antazoline could reverse mast cells-related genes’ expression, while butein, 2,6-dimethylpiperidine and cholecalciferol could facilitate mast cells-related genes’ expression, which provides potential therapy for regulating mast cells. Furthermore, these small molecule drugs are a potential therapy for patients with AML. However, further studies are supposed to conduct to confirm these small molecules.
Figure 8. Chemical formulas of six most significant small molecule drugs. NU-1025, ketoconazole and antazoline are potential therapeutic drugs to AML, while butein, 2,6-dimethylpiperidine and cholecalciferol are opposite. Structural formulas for each small molecule drug are shown in the figure, with the name and molecular formulas (MF) of the corresponding small molecule drug marked under each figure.
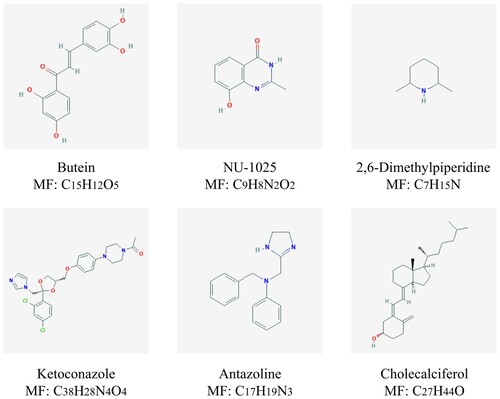
Table 2. The potential small molecule drugs of the CMap database.
4. Discussion
AML is a common myeloid malignant with heterogeneous outcomes and the treatment for the patients with AML is not contented and the process of therapy is relatively slow. Currently, the discovery of the immune checkpoint and the study of the immune microenvironment in the tumor field proposes the treatment in many diseases, pushing the cancer immunotherapy to a new level, which includes the therapy of the AML.
In this study, we analyzed 22 immune cells concerning the bone marrow of patients with AML. The correlation between these immune cells was performed, and we found a positive relationship between some immune cells, such as B cells and plasma cells, as well as a negative relation between immune cells, such as mast cells and monocytes. To have a further understanding of the role of these immune cells in the procedure of AML, we analyzed the relationship between the immune cells and survival time of patients, which showed that the mast cells have a significant correlation with the prognosis of patients with AML. Traditionally, T cell CD8+ was recognized as an essential immune cell targeted as the potential target of immune therapy, while the outcome of these treatments based on influencing T cell is not satisfying. The survival analysis conducted in our study shows that the T cell has no significant relationship with the survival time of patients with AML, which means the poor effect of AML immunotherapy is most likely related to the fact that most immunologic drugs currently target CD8 + T cells. In summary, the survival-related immune cells identified in this study, including mast cells resting and activated, are most likely to have a vital role in immune infiltration and AML immunotherapy, conducting further analysis concerning these immune cells is credible.
The different expression genes analysis among the different types of mast cells showed that 135 genes cover three types of mast cells, which means these genes may play a vital role in the process that mast cells influence the progression of AML. The enrichment results of DEGs show that these genes are mainly correlated with the extracellular matrix organization, inflammatory response, and various pathways. Based on signaling pathways enriched, we found that PI3K-Akt signaling pathways are involved in substance metabolism. The PI3K-Akt signaling pathway is the clearest and important one that regulates the immune environment. The general consensus is that PI3K-Akt signaling pathway has the capacity to affect immune cells and to regulate the immune-intrinsic feature [Citation22]. Most of these signaling pathways are involved in the progression of tumor and immune reaction, which indicates that mast cell is strongly associated with the progression of AML.
Then the 135 genes were used for protein–protein interaction network analysis, and get the seven subnetwork, six seed genes, namely hub genes, GABRB2, HOXC10, IRX6, LEP, PTH2 and GPR37. GABRB2 is a typical protein-coding gene and may be an important role in lymph node metastasis [Citation23]. HOXC10 belongs to the homeobox family of genes and encodes a highly conserved family of transcription factors that play an important role in morphogenesis in all multicellular organisms. There are also reported that HOXC10 is related to thyroid cancer and gastric cancer concerning the invasion of the tumor [Citation24,Citation25]. LEP gene encodes a protein that is secreted by white adipocytes into the circulation and plays a major role in the regulation of energy homeostasis. There are studies suggesting that LEP is related to NSCLC (Non Small Cell Lung Cancer) [Citation26]. PTH2 encodes the precursor of a peptide hormone that shares sequence similarity with the parathyroid hormone, which is related to the proliferation of cells via regulating parathyroid [Citation27]. GPR37, a member of the G protein-coupled receptor family, is a member of the G protein-coupled receptor family. This gene is related to the multiple myeloma cells, glioma of human, hepatocellular [Citation28–30]. These genes play an essential role in mast cells influencing the prognosis of patients with AML.
Finally, we analyzed the small molecules drugs related to regulating mast cells and could be therapy medicines for the patients with AML. Of the most significant six molecules drugs, NU-1025, ketoconazole and antazoline are potential drugs for AML, and could reverse the expression genes related to mast cells, while butein, 2,6-dimethylpiperidine and cholecalciferol are diametrically opposite. NU-1025 is a potent PARP-1 (poly(ADP-ribose) polymerase; PARP) inhibitor that has demonstrated the ability to enhance the cytotoxicity of the DNA methylating compound MTIC (sc-211930), bleomycin, and γ-irradiation. Some studies reported that PARP-1 acts as a determining factor in nuclear export [Citation31]. PARP has been identified that it promotes nuclear Activation-induced cytidine deaminase in lymphoma cells [Citation32], thus NU-1025 perhaps influences the mast cells, which is profitable for therapy of AML. Ketoconazole is a nonselective steroid 17α-hydroxylase/17,20 lyase (CYP17A1) inhibitor that has been used, off-label, as second-line therapy for castration-resistant prostate cancer [Citation33]. Men with nonmetastatic castration-resistant prostate cancer were treated with first-generation androgen receptor antagonists, estrogens or ketoconazole in clinical therapy [Citation34]. Antazoline is largely utilized in the therapy of cardiovascular, as mentioned in some studies [Citation35–37], and antazoline is associated with pharmacological cardioversion. There are no studies on antazoline treating cancer. As for the three small molecules with positive enrichment analyzed via CMap database may reduce the distribution of the mast cells in the bone marrow of AML patients, which is associated with the poor prognosis of the patients with AML. We should avoid using these drugs in AML patients. Whether these small molecules are beneficial to patients with AML, it is supposed to conduct some vivo or vitro experiments.
In summary, our comprehensive analysis of the immune infiltrating tumor cells of bone marrow microenvironment from patients with AML provided an overview of the relationship between mast cells and the prognosis of patients. Furthermore, the six hub genes obtained from our analysis provide rich and useful resources for further investigation of immune cells and microenvironment. What small molecule drugs we got in this study are potentially related to the therapy for the patients with AML, by which the mast cells regulate the immune environment to influence the AML.
Supplemental Material
Download MS Word (14 KB)Disclosure statement
No potential conflict of interest was reported by the author(s).
References
- Konopleva M, Andreeff M. Targeting the leukemia microenvironment. Curr Drug Targets. 2007;8(6):685–701.
- Shi J, Fu H, Jia Z, et al. High expression of CPT1A predicts adverse outcomes: a potential therapeutic target for acute myeloid leukemia. EBioMedicine. 2016;14:55–64.
- Shah A, Andersson TM, Rachet B, et al. Survival and cure of acute myeloid leukaemia in England, 1971–2006: a population-based study. Br J Haematol. 2013;162(4):509–516.
- Acheampong DO, Adokoh CK, Asante DB, et al. Immunotherapy for acute myeloid leukemia (AML): a potent alternative therapy. Biomed Pharmacother. 2018;97:225–232.
- Gittleman HR, Ostrom QT, Rouse CD, et al. Trends in central nervous system tumor incidence relative to other common cancers in adults, adolescents, and children in the United States, 2000 to 2010. Cancer. 2015;121(1):102–112.
- Showel MM, Levis M. Advances in treating acute myeloid leukemia. F1000Prime Rep. 2014;6:96.
- Khan GN, Orchard K, Guinn BA. Antigenic targets for the immunotherapy of acute myeloid leukaemia. J Clin Med. 2019;8(2):134.
- Estey E, Dohner H. Acute myeloid leukaemia. Lancet. 2006;368(9550):1894–1907.
- Ryan JF, Hovde R, Glanville J, et al. Successful immunotherapy induces previously unidentified allergen-specific CD4+ T-cell subsets. Proc Natl Acad Sci U S A. 2016;113(9):E1286–E1295.
- Fidler IJ. The pathogenesis of cancer metastasis: the ‘seed and soil’ hypothesis revisited. Nat Rev Cancer. 2003;3(6):453–458.
- Chen DS, Mellman I. Oncology meets immunology: the cancer-immunity cycle. Immunity. 2013;39(1):1–10.
- Hanahan D, Weinberg RA. Hallmarks of cancer: the next generation. Cell. 2011;144(5):646–674.
- Zhang S, Zhang E, Long J, et al. Immune infiltration in renal cell carcinoma. Cancer Sci. 2019;110(5):1564–1572.
- Newman AM, Liu CL, Green MR, et al. Robust enumeration of cell subsets from tissue expression profiles. Nat Methods. 2015;12(5):453–457.
- Chen B, Khodadoust MS, Liu CL, et al. Profiling tumor infiltrating immune cells with CIBERSORT. Methods Mol Biol. 2018;1711:243–259.
- Zhang S, Chang YY, Gong YW, et al. Comprehensive analysis of microRNA-messenger RNA regulatory network in gemcitabine-resistant bladder cancer cells. J Cell Biochem. 2019;120(4):6347–6360.
- Huang DW, Sherman BT, Tan Q, et al. DAVID Bioinformatics resources: expanded annotation database and novel algorithms to better extract biology from large gene lists. Nucleic Acids Res. 2007;35(Web Server issue):W169–W175.
- Szklarczyk D, Morris JH, Cook H, et al. The STRING database in 2017: quality-controlled protein-protein association networks, made broadly accessible. Nucleic Acids Res. 2017;45(D1):D362–D368.
- Shannon P, Markiel A, Ozier O, et al. Cytoscape: a software environment for integrated models of biomolecular interaction networks. Genome Res. 2003;13(11):2498–2504.
- Lamb J, Crawford ED, Peck D, et al. The Connectivity Map: using gene-expression signatures to connect small molecules, genes, and disease. Science. 2006;313(5795):1929–1935.
- Shen Y, Liu J, Zhang L, et al. Identification of potential biomarkers and survival analysis for head and neck squamous cell carcinoma using Bioinformatics strategy: a study based on TCGA and GEO datasets. Biomed Res Int. 2019;2019:7376034.
- Cao J, Yang X, Li J, et al. Screening and identifying immune-related cells and genes in the tumor microenvironment of bladder urothelial carcinoma: based on TCGA database and bioinformatics. Front Oncol. 2020;9:1533.
- Jin Y, Jin W, Zheng Z, et al. GABRB2 plays an important role in the lymph node metastasis of papillary thyroid cancer. Biochem Biophys Res Commun. 2017;492(3):323–330.
- Miwa T, Kanda M, Umeda S, et al. Homeobox c10 influences on the malignant phenotype of gastric cancer cell lines and its elevated expression positively correlates with recurrence and poor survival. Ann Surg Oncol. 2019;26(5):1535–1543.
- Feng X, Li T, Liu Z, et al. HOXC10 up-regulation contributes to human thyroid cancer and indicates poor survival outcome. Mol Biosyst. 2015;11(11):2946–2954.
- Li F, Zhao S, Guo T, et al. The nutritional cytokine leptin promotes NSCLC by activating the PI3 K/AKT and MAPK/ERK pathways in NSCLC cells in a paracrine manner. Biomed Res Int. 2019;2019:2585743.
- Misiano P, Scott BB, Scheideler MA, et al. PTH2 receptor-mediated inhibitory effect of parathyroid hormone and TIP39 on cell proliferation. Eur J Pharmacol. 2003;468(3):159–166.
- Huang X, Wang Y, Nan X, et al. The role of the orphan G protein-coupled receptor 37 (GPR37) in multiple myeloma cells. Leuk Res. 2014;38(2):225–235.
- Liu F, Zhu C, Huang X, et al. A low level of GPR37 is associated with human hepatocellular carcinoma progression and poor patient survival. Pathol Res Pract. 2014;210(12):885–892.
- Zhang Y, Wang L. [Up-regulation of GPR37 promotes the proliferation of human glioma U251 cells]. Xi Bao Yu Fen Zi Mian Yi Xue Za Zhi. 2018;34(4):341–345.
- Zerfaoui M, Errami Y, Naura AS, et al. Poly(ADP-ribose) polymerase-1 is a determining factor in Crm1-mediated nuclear export and retention of p65 NF-kappa B upon TLR4 stimulation. J Immunol. 2010;185(3):1894–1902.
- Tepper S, Jeschke J, Bottcher K, et al. PARP activation promotes nuclear AID accumulation in lymphoma cells. Oncotarget. 2016;7(11):13197–13208.
- Patel V, Liaw B, Oh W. The role of ketoconazole in current prostate cancer care. Nat Rev Urol. 2018;15(10):643–651.
- Esther J, Maughan BL, Anderson N, et al. Management of nonmetastatic castration-resistant prostate cancer: recent advances and future direction. Curr Treat Options Oncol. 2019;20(2):14.
- Wybraniec MT, Wrobel W, Wilkosz K, et al. Pharmacological cardioversion with antazoline in atrial fibrillation: the results of the CANT study. J Am Heart Assoc. 2018;7(20):e010153.
- Binkowski BJ, Makowski M, Kubinski P, et al. Effect of antazoline on electrophysiological properties of Atrial muscle and conduction system of the heart. Cardiovasc Drugs Ther. 2018;32(2):169–173.
- Piotrowski R, Giebultowicz J, Baran J, et al. Antazoline-insights into drug-induced electrocardiographic and hemodynamic effects: results of the ELEPHANT II substudy. Ann Noninvasive Electrocardiol. 2017;22(5):e12441.