
ABSTRACT
Background
Chronic myelogenous leukemia (CML) is one of the most common cancers in the world. Imatinib is one of the most effective therapeutic strategies to inhibit the BCR-ABL tyrosine Kinase in patients with CML, but resistance is increasingly encountered.
Material and Methods
Microarray data GSE7114, GSE92624 and GSE97562 were downloaded and analyzed from Gene Expression Omnibus (GEO) to identify the candidate genes in the imatinib-resistant CML cells. The differentially expressed genes (DEGs) were appraised, and the protein–protein interaction (PPI) network was created by using STRING and Cytoscape.
Results
We screened a total of 217 DEGs, including 151 upregulated genes and 66 downregulated genes. The enriched functions and pathways of genes include insulin-like growth factor I binding, cysteine-type endopeptidase inhibitor activity involved in apoptotic process, cell adhesion, positive regulation of nitric oxide biosynthetic process and hematopoietic cell lineage. Nine hub genes were appraised and Gene Ontology enrichment analysis revealed that these genes are mainly enriched in cell cycle, peptidase inhibitor activity and cell division. Several genes such as BIRC5, CCNE2 and MCM4 were identified in survival analysis and these genes alteration are significantly associated with worse overall survival and disease-free survival.
Conclusions
These genes have the potential to become surrogate markers for a clinical evaluation of imatinib-resistant CML patients. Our results provide potential target genes for diagnosis and treatment of imatinib-resistant CML patients.
Introduction
Chronic myelogenous leukemia (CML), mainly induced by the juxtaposition of DNA sequences from the BCR and ABL genes, is one of the most common cancer with a rise in new cases worldwide each year. BCR-ABL encodes protein p210BCR-ABL which is indispensable and important with dysregulated tyrosine kinase activity [Citation1,Citation2]. Accumulating evidence has demonstrated that abnormal expression of genes is involved in the imatinib-resistant CML cells, as well as mutations of tumor-suppressor genes [Citation3–5]. However, due to the lack of effective therapeutic methods when patients with CML resistant to imatinib at the advanced stage of the disease, the mortality rate of this disease remains high. Therefore, it is important to understand the specific molecular mechanisms involved in the development and progression of imatinib-resistant CML cells and thus develop effective diagnostic and therapeutic strategies.
During the recent years, gene chip technology and microarray analysis have been widely used to screen new effective biomarkers through computational approaches [Citation6], which have explored the differentially expressed genes (DEGs) involved in the imatinib-resistant CML cells. Extensive studies have focused on the role of single biomarker in signaling pathway. However, some recent findings suggested that the network biomarkers and network medicine may contribute to cancer development and progression. Thus, in the present study, 3 mRNA microarray datasets from Gene Expression Omnibus (GEO) were downloaded and analyzed to obtain DEGs between imatinib-sensitive CML cells and imatinib-resistant CML cells. Subsequently, Gene Ontology (GO), Kyoto Encyclopedia of Genes and Genomes (KEGG) pathway enrichment analysis and protein–protein interaction (PPI) network analyses help us to understand the molecular mechanisms in the imatinib-resistant CML cells. In conclusion, a total of 217 DEGs and 9 hub genes were identified, indicating that targeting these genes is a potential therapeutic strategy for imatinib-resistant CML cells.
Material and methods
GEO Datasets microarrays data
GEO Datasets (https://www.ncbi.nlm.nih.gov/geo) database was selected for our study. It is a public functional genomics data repository of high throughput gene expression data, chips and microarrays. Three gene expression datasets (GSE7114 [Citation7], GSE92624 [Citation8] and GSE97562 [Citation9]) were downloaded from GEO.
Screening of DEGs
The DEGs between imatinib-sensitive CML samples and imatinib-resistant CML samples were screened using GEO2R (https://www.ncbi.nlm.nih.gov/geo/geo2r). GEO2R is an online analysis tool that helps users to identify DEGs under experimental conditions [Citation10]. The adjusted P-value and |log2FC| were calculated. Genes that met the cutoff criteria, adjusted P < 0.05 and |log2FC|>1.0, were considered as DEGs. According to the annotation information in the platform, the probe was converted into the corresponding gene symbol and deleted or averaged which sets without corresponding gene symbols or genes with more than one probe set [Citation11,Citation12].
GO enrichment analysis and KEGG pathway analysis
The Database for Annotation, Visualization and Integrated Discovery (DAVID; https://david.ncifcrf.gov) [Citation13,Citation14] was applied for GO enrichment analysis and KEGG pathway analysis for integrated differential genes. DAVID is an online analysis tool that integrates all the major public bioinformatics resources, and provides gene related biological mechanisms for users to extract biological information. KEGG is database resource that ables to integrate currently known protein functions and biological systems. The pathways of KEGG mainly including metabolism, environmental information related processes, genetic information processing and cell physiological processes [Citation15]. GO is a major bioinformatics tool to annotate genes and analyze biological process (BP), molecular function (MF), and cellular component (CC) of these genes [Citation16].
PPI program analysis and module analysis
PPI network analysis was performed for differential genes by using Search Tool for the Retrieval of Interacting Genes (STRING; https://string-db.org) [Citation17] online database. PPI of the DEGs were constructed from the STRING database, and were analyzed by Cytoscape software. Cytoscape is an open source bioinformatics tool for visualizing molecular interaction networks of genes and proteins [Citation18]. The Molecular Complex Detection (MCODE) app in Cytoscape was used to analyze a given network based on topology to find thickly connected point [Citation19]. MCODE scores > 4 and the number of nodes >5 were set as cut-off criteria with the default parameters (degree cutoff = 2, node score cutoff = 0.2, K-core = 2 and max depth = 100).
Hub genes selection and analysis
The genes with degree of connectivity >10 were identified as hub genes. The Cytoscape plugin Biological Networks Gene Ontology tool (BiNGO) was used to analyze and visualize hub genes biological process [Citation20,Citation21]. The overall survival and disease-free survival of hub genes were analyzed using Kaplan-Meier curve in cBioPortal (https://www.cbioportal.org). A difference with a P-value <0.05 was considered significant [Citation22].
Results
Identification of DEGs in imatinib-resistant CML cells
We performed differential analysis of 24 samples of imatinib-resistant CML and 24 samples of imatinib-sensitive CML. After standardization of the microarray results, a total of 4035 differential genes were identified from GSE7114. Additionally, a total of 5642 differential genes were identified from GSE97562 and a total of 3,949 differential genes were identified from GSE92624. Venn analysis was performed to get the intersection of the DEG profiles (Supplementary Figure S1). Based on the criteria |log2FC|>1 and P-value <0.05, 217 DEGs were significantly differentially expressed among all three groups, consisting of 151 upregulated genes and 66 downregulated genes between imatinib-resistant CML cells and imatinib-sensitive CML cells.
GO biological process analysis and KEGG pathway enrichment
GO function and KEGG pathway enrichment analysis of DEGs were performed using DAVID. GO analysis results showed that changes in molecular function (MF) of DEGs were significantly enriched in insulin-like growth factor I binding, cysteine-type endopeptidase inhibitor activity involved in apoptotic process, protein binding and platelet-derived growth factor receptor binding (). Changes in biological process (BP) were mainly enriched in cell adhesion, positive regulation of nitric oxide biosynthetic process and inflammatory response (). Changes in cell component (CC) of DEGs were mainly enriched in the extracellular space, plasma membrane and cell surface (). The results of KEGG pathway analysis showed that DEGs were mainly enriched in hematopoietic cell lineage, transcriptional misregulation in cancer, inflammatory mediator regulation of transient receptor potential (TRP) channels and cytokine-cytokine receptor interaction ().
Table 1. GO and KEGG pathway enrichment analysis of DEGs.
PPI network construction and module analysis
Next, we sought to further understand the functional modules in the PPI networks of the DEGs unique to imatinib-resistant CML cells to identify the key genes for this disease. We used the STRING database to construct PPI networks of DEGs (Supplementary Figure S2) and the Cytoscape to obtain the most significant module (A,B). The MCODE Cytoscape plugin was used to construct the functional modules in the PPI network of the DEGs unique to imatinib-resistant CML cells. The module in B has a score of 9.111 and contains 10 nodes and 41 edges. The GO function and KEGG pathway enrichment analysis of most significant module were analyzed using DAVID. Results showed that genes in this module were mainly enriched in cell cycle, endopeptidase inhibitor activity and cell division ().
Figure 1. PPI network constructed with the DEGs by using Cytoscape. (A) The PPI network of DEGs was constructed using Cytoscape. Red nodes represent upregulated genes. Blue nodes represent downregulated genes. (B) The most significant module was obtained from PPI network with 9 nodes and 34 edges.
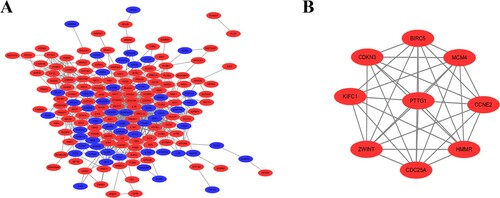
Table 2. GO and KEGG pathway enrichment analysis of hub genes.
Hub gene selection and analysis of prognostic value
Nine of the most significant module genes evaluated by connectivity degree in the PPI network were identified as hub genes. The biological process analysis of the hub genes was shown in Supplementary Figure S3.
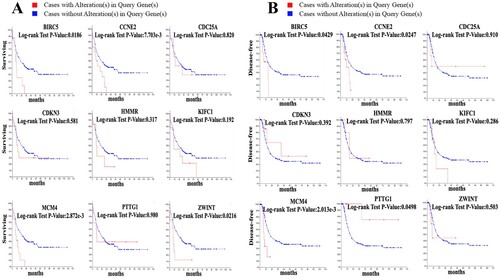
The prognostic values of the selected key genes unique to imatinib-resistant CML patients were analyzed using the cBioPortal online tool. The overall survival analysis and disease-free survival analysis of the hub genes were shown using Kaplan-Meier curve. We retrieved the survival curves of the patients from the TCGA database with the corresponding imatinib-resistant CML and analyzed survival by the expression levels of the key genes (A,B). Imatinib-resistant CML patients with BIRC5, CCNE2, MCM4, PTTG1 alteration showed worse disease-free survival. Nonetheless, imatinib-resistant CML patients had an association of genomic alterations in BIRC5, CCNE2, MCM4, ZWINT showed reductions in overall survival. In addition, the BIRC5, CCNE2, MCM4 alteration was significantly associated with worse overall survival and disease-free survival. Of the key genes unique to the imatinib-resistant CML patients the expression levels of only BIRC5, CCNE2 and MCM4 were associated with patient survival time (P < 0.05). Survival analysis showed that higher expression levels of the prognosis-related key genes were associated with shorter survival time of imatinib-resistant CML patients.
Figure 2. Survival analyses of hub genes were shown by using cBioPortal. (A) Overall survival analyses of hub genes. P < 0.05 was considered statistically significant. (B) Disease-free survival analyses of hub genes. P < 0.05 was considered statistically significant.
RT-PCR analysis
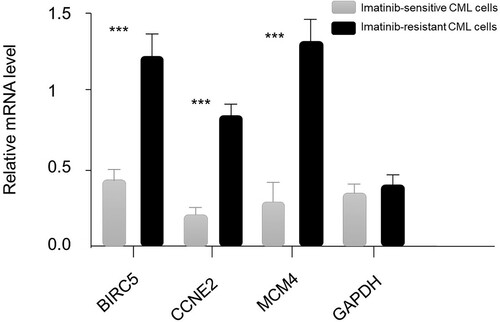
We used imatinib-resistant CML cell samples and imatinib-sensitive CML cell samples to evaluate the expression level of the three hub genes by RT-PCR analysis. GAPDH is one of the most commonly used housekeeping genes andused as the internal control. The primer sequence of BIRC5, CCNE2, MCM4 and GAPDH was asfollows: sense, 5′-ATTCGTCCGGTTGCGCTTTCC-3′; reverse, 5′-CACGGCGCACTTTCTTCGCAG-3′; sense, 5′-CGGCCTATATATTGGGTTGG-3′; reverse, 5′-ACGGCTACTTCGTCTTGACA-3′; sense, 5′-TGAACCTCTATACATGCAACGAC-3′; reverse, 5′-CAGGGTAACGGTCAAAGAAGATT-3′ and sense, 5′-GCACCGTCAAGGCTGAGAAC-3′; reverse, 5′-TGGTGAAGACGCCAGTGGA-3′, respectively. As is shown in , mRNA levels of BIRC5, CCNE2 and MCM4 were significantly upregulated in imatinib-resistant CML cell samples than imatinib-sensitive CML cell samples (P < 0.01). However, the mRNA levels of GAPDH showed no significant difference between two groups.
Figure 3. The expression levels of mRNAs of three hub genes in two groups of samples. The BIRC5, CCNE2, MCM4 and glyceraldehyde-3-phosphate dehydrogenase (GAPDH; as control) transcripts in different cell lines. Error bars show mean ± s.d., *** mean the difference is statistically significant (P < 0.001).
Discussion
In the present study, we analyzed 3 mRNA microarray datasets to screen DEGs between imatinib-resistant CML cells and imatinib-sensitive CML cells. GO and KEGG enrichment analyses were performed to explore interactions among the DEGs. The DEGs were mainly enriched in insulin-like growth factor I binding, inflammatory response, apoptotic process, cell adhesion, and Transcriptional misregulation in cancer. Previous studies have reported that misregulation of the insulin-like growth factor I binding and apoptotic process play important roles in imatinib-resistant CML cells [Citation5,Citation23,Citation24]. Moreover, cell adhesion often plays a major role in imatinib resistance and Arsenic Trioxide can overcome cell adhesion mediated drug resistance through down-regulating the expression of β1-integrin in K562 chronic myelogenous leukemia cell line [Citation25]. In a word, all these studies are consistent with our results.
We used the Cytoscape to obtain the most significant module and selected 9 DEGs as hub genes with degrees ≥ 10. Among these hub genes, BIRC5, CCNE2 and MCM4 were identified in survival analysis and these genes alteration was significantly associated with worse overall survival and disease-free survival. BIRC5, also called survivin, is a member of the inhibitor of apoptosis (IAP) family of proteins. It plays important roles in both cell division and proliferation in a majority of cancers [Citation26,Citation27]. BIRC5 is upregulated in haematological malignancies and was also shown to be overexpressed in CML-BP in comparison to CML-CP [Citation28]. In the previous studies, BIRC5 has been shown to be correlated with G2M cell-cycle block, cell death and shorter patient survival in imatinib-resistant CML [Citation29,Citation30]. Thus, it is regarded as a target for anticancer agents, such as YM155, shepherdin and FL118 [Citation31]. On the basis of these findings, we suggest that through inhibition of BIRC5 expression may be increased sensitivity to imatinib in imatinib-resistant patients. BIRC5 and BCL-2 genes are frequently co-amplified to inhibit apoptosis which is one of the important reasons for poor prognosis in patients [Citation32]. Moreover, BIRC5 overexpression in BCR-ABL independent imatinib-resistant CML is associated with altered expression of Bcl-2 [Citation33]. In addition, BIRC5 overexpression has also been found in breast, thyroid and lung cancers, and may be regarded as a valuable biomarker for diagnosis, treatment and prognosis of tumors [Citation34–36].
CCNE2 (cyclin E2) regulates cell cycle progression by binding to cyclin dependent kinase 2 (CDK2) to form a serine/threonine kinase holoenzyme complex called CCNE2-CDK2 [Citation37]. Aberrant regulation of CCNE2 is one of the biomarkers of tumorigenesis. CCNE2 overexpression has also been found in breast, ovarian, lung and other cancers [Citation38–40]. In addition, CCNE2 were found to be highly expressed in hematologic malignancies including acute myeloid leukemia (AML), chronic myeloid leukemia (CML), acute lymphocytic leukemia (ALL). Targeting peptides was found to kill leukemia cells by binding nonameric peptides of CCNE2 and inhibiting the expression of CCNE2 [Citation41]. The overexpression of CCNE2 has been linked to high cellular proliferation, we suggest that overexpression of CCNE2 in K562 cells might show the highest resistance to the imatinib treatment. Moreover, a previous study has found that an indirubin derivative AGM130 induced apoptosis of imatinib-resistant CML cells by inhibited CCNE2-CDK2 activity [Citation42].
MCM protein family is a class of highly conserved proteins which were involved in DNA replication, elongation and transcription. MCM4 is a key component of the minichromosome maintenance protein complex that is necessary for the initiation of DNA replication in eukaryotes. The aberrant expression of MCM4 indicates the proliferation of malignant cells and atypical cells including potential malignant cells. Therefore, MCM4 can be used as an effective marker for the diagnosis of tumors and precancerous lesions [Citation43,Citation44]. Overexpression of MCM4 has also been found in lung, breast and other cancers [Citation45,Citation46]. However, MCM4 has not been identified a biomarker in imatinib-resistant CML cells by biological methods and our work is first time to identify MCM4 as a biomarker in imatinib-resistant CML cells by Bioinformatics. In the previous study, DNA helicase activity of MCM4-6-7 complex inhibited by the phosphorylation by CCNE2-CDK2, indicating that the inhibition of DNA replication because of phosphorylation of MCM4 with CCNE2-CDK2 [Citation44]. We speculate that the effect of imatinib treatment in CML cells was upregulating MCM4 related to cell-cycle phase transition and DNA replication to resistant apoptosis. Our results suggest the combination of MCM4 inhibitor and imatinib may show the synergistic effect in imatinib-resistant CML cells and the potential to decrease tumor regression.
In addition, we performed hierarchical clustering for others hub genes including HMMR, KIFC1, CDC25A, ZWINT, CDKN3, PTTG1. Results showed that these hub genes differentiated imatinib-resistant CML samples from imatinib-sensitive CML samples, and may be associated with the imatinib resistant of CML. HMMR, a receptor for hyaluronate-mediated motility (RHAMM), is an oncogene that leading to the neoplastic progression of human leukemias and solid tumors [Citation47]. KIFC1 plays essential roles in the segregation of chromosomes in mitosis. It is overexpressed in breast cancers and may be associated with the docetaxel resistant of prostate cancer [Citation48,Citation49]. The protein kinase CDC25A acts as an activator of cyclin E-CDK2 that regulates the G1-S and G2-M transitions in colon cancer cells [Citation50]. Previous studies found that the CDC25A is crucial for the proliferation of breast and lung cancer [Citation51,Citation52]. ZWINT is a centromere-complex component required for the mitotic spindle checkpoint and involved in the cell growth. Recent research has found that it can be a novel regulator of hepatocellular carcinoma by regulating cell-cycle-related proteins [Citation53]. CDKN3 regulates mitosis, and high expression of CDKN3 is involved in the progression of ovarian cancer [Citation54]. Overexpression of PTTG1 was found to promote the proliferation of several cancers, such as liver cancer, lung cancer and adrenocortical cancer [Citation55–57].
Conclusion
In conclusion, the present study was designed to identify DEGs that may be involved in the imatinib-resistant CML cells. BIRC5, CCNE2, MCM4 were identified and may be regarded as diagnostic biomarkers for imatinib-resistant CML cells. Further studies are needed to elucidate the biological function of these genes in imatinib-resistant CML cells.
Supplemental Material
Download MS Word (2 MB)Disclosure statement
No potential conflict of interest was reported by the author(s).
Additional information
Funding
References
- O’Brien SG, Guilhot F, Larson RA, et al. Imatinib compared with interferon and low-dose cytarabine for newly diagnosed chronic-phase chronic myeloid leukemia. N Engl J Med. 2003;348:994–1004. doi:https://doi.org/10.1056/NEJMoa022457.
- Druker BJ. Five-year follow-up of patients receiving imatinib for chronic myeloid leukemia. N Engl J Med 2006;355:2408–2417. doi:https://doi.org/10.1056/NEJMoa062867.
- Pocaly M, Lagarde V, Etienne G, et al. Overexpression of the heat-shock protein 70 is associated to imatinib resistance in chronic myeloid leukemia. Leukemia. 2006;21:93–101. doi:https://doi.org/10.1038/sj.leu.2404463.
- Warsch W, Kollmann K, Eckelhart E, et al. High STAT5 levels mediate imatinib resistance and indicate disease progression in chronic myeloid leukemia. Blood. 2011;117:3409–3420. doi:https://doi.org/10.1182/blood-2009-10-248211.
- Ha SA, Kim S, Shin SM, et al. Gene expression signatures associated with the resistance to imatinib. Leukemia. 2006;20:1542–1550. doi:https://doi.org/10.1038/sj.leu.2404310.
- Falzone L, Lupo G, La Rosa GRM, et al. Identification of novel MicroRNAs and their diagnostic and prognostic significance in oral cancer. Cancers. 2019;11:610. doi:https://doi.org/10.3390/cancers11050610.
- Bao F, Polk P, Nordberg ML, et al. Comparative gene expression analysis of a chronic myelogenous leukemia cell line resistant to cyclophosphamide using oligonucleotide arrays and response to tyrosine kinase inhibitors. Leuk Res. 2007;31:1511–1520. doi:https://doi.org/10.1016/j.leukres.2007.03.002.
- Miyauchi M, Koya J, Arai S, et al. ADAM8 is an antigen of tyrosine kinase inhibitor-resistant chronic myeloid leukemia cells identified by patient-derived induced pluripotent stem cells. Stem Cell Rep. 2018;10:1115–1130. doi:https://doi.org/10.1016/j.stemcr.2018.01.015.
- Avilés-Vázquez S, Chávez-González A, Hidalgo-Miranda A, et al. Global gene expression profiles of hematopoietic stem and progenitor cells from patients with chronic myeloid leukemia: the effect of in vitro culture with or without imatinib. Cancer Med. 2017;6:2942–2956. doi:https://doi.org/10.1002/cam4.1187.
- Xu Y, Shen K. Identification of potential key genes associated with ovarian clear cell carcinoma. Cancer Manage Res. 2018;10:5461–5470. doi:https://doi.org/10.2147/CMAR.S187156.
- Li L, Lei Q, Zhang S, et al. Screening and identification of key biomarkers in hepatocellular carcinoma: evidence from bioinformatic analysis. Oncol Rep 2017;38:2607–2618. doi:https://doi.org/10.3892/or.2017.5946.
- Zhong M, Wu Y, Ou W, et al. Identification of key genes involved in type 2 diabetic islet dysfunction: a bioinformatics study. Biosci Rep. 2019;39:5. doi:https://doi.org/10.1042/BSR20182172.
- Huang DW, Sherman BT, Tan Q, et al. The DAVID gene functional classification tool: a novel biological module-centric algorithm to functionally analyze large gene lists. Genome Biol. 2007;8:R183. doi:https://doi.org/10.1186/gb-2007-8-9-r183.
- Li GM, Zhang CL, Rui RP, et al. Bioinformatics analysis of common differential genes of coronary artery disease and ischemic cardiomyopathy. Eur Sci Med Farmacol. 2018;22:3553–3569. doi:https://doi.org/10.26355/eurrev_201806_15182.
- Klukas C, Schreiber F. Dynamic exploration and editing of KEGG pathway diagrams. Bioinformatics. 2007;23:344–350. doi:https://doi.org/10.1093/bioinformatics/btl611.
- Eden E, Navon R, Steinfeld I, et al. GOrilla: a tool for discovery and visualization of enriched GO terms in ranked gene lists. BMC Bioinf. 2009;10:48. doi:https://doi.org/10.1186/1471-2105-10-48.
- Franceschini A, Szklarczyk D, Frankild S, et al. STRING v9.1: protein-protein interaction networks, with increased coverage and integration. Nucleic Acids Res. 2013;41:D808–D815. doi:https://doi.org/10.1093/nar/gks1094.
- Shannon P, Markiel A, Ozier O, et al. Cytoscape: a software environment for integrated models of biomolecular interaction networks. Genome Res. 2003;13:2498–2504. doi:https://doi.org/10.1101/gr.1239303.
- Bandettini WP, Kellman P, Mancini C, et al. Multicontrast delayed enhancement (MCODE) improves detection of subendocardial myocardial infarction by late gadolinium enhancement cardiovascular magnetic resonance: a clinical validation study. J Cardiovasc Magn R. 2012;14:83. doi:https://doi.org/10.1186/1532-429X-14-83.
- Maere S, Heymans K, Kuiper M. BiNGO: a cytoscape plugin to assess overrepresentation of gene ontology categories in biological networks. Bioinformatics. 2005;21:3448–3449. doi:https://doi.org/10.1002/pssc.200778445.
- Kohl M, Wiese S, Warscheid B. Cytoscape: software for visualization and analysis of biological networks. Mol Biol 2011;696:291–303. doi:https://doi.org/10.1007/978-1-60761-987-1_18.
- Gao J, Aksoy BA, Dogrusoz U. Integrative analysis of complex cancer genomics and clinical profiles using the cBioPortal. Sci Signaling. 2013;6:11. doi:https://doi.org/10.1126/scisignal.2004088.
- Bozkurt S, Ozkan T, Ozmen F, et al. The roles of epigenetic modifications of proapoptotic BID and BIM genes in imatinib-resistant chronic myeloid leukemia cells. Hematology. 2013;18:217–223. doi:https://doi.org/10.1179/1607845412Y.0000000056.
- Juan L, Yujing Z, Aichun L, et al. Distinct dasatinib-induced mechanisms of apoptotic response and exosome release in imatinib-resistant human chronic myeloid leukemia cells. Int J Mol Sci. 2016;17:531. doi:https://doi.org/10.3390/ijms17040531.
- Guo-Bao W, Xiao-Qin C, Qi-Rong G, et al. Arsenic Trioxide overcomes cell adhesion-mediated drug resistance through down-regulating the expression of β1-integrin in K562 chronic myelogenous leukemia cell line. Leuk Lymphoma. 2010;51:1090–1097. doi:https://doi.org/10.3109/10428191003746315.
- Altieri DC. Validating survivin as a cancer therapeutic target. Nat Rev Cancer. 2003;3:46–54. doi:https://doi.org/10.1038/nrc968.
- Ambrosini G, Adida C, Altieri DC. A novel anti-apoptosis gene, survivin, expressed in cancer and lymphoma. Nat Med. 1997;3:917–921. doi:https://doi.org/10.1038/nm0897-917.
- Glodkowska-Mrowka E, Solarska I, Mrowka P, et al. Differential expression of BIRC family genes in chronic myeloid leukaemia BIRC3 and BIRC8 as potential new candidates to identify disease progression. Brit J Haematol. 2014;164:740–742. doi:https://doi.org/10.1111/bjh.12663.
- Carter BZ. Regulation of survivin expression through Bcr-Abl/MAPK cascade: targeting survivin overcomes imatinib resistance and increases imatinib sensitivity in imatinib-responsive CML cells. Blood. 2006;107:1555–1563. doi:https://doi.org/10.1182/blood-2004-12-4704.
- Stella S, Tirro E, Conte E, et al. Suppression of survivin induced by a BCR-ABL/JAK2/STAT3 pathway sensitizes imatinib-resistant CML cells to different cytotoxic drugs. Mol Cancer Ther. 2013;12:1085–1098. doi:https://doi.org/10.1158/1535-7163.MCT-12-0550.
- Soleimanpour E, Babaei E. Survivin as a potential target for cancer therapy. Asian Pac J Cancer P. 2015;16:6187–6191. doi:https://doi.org/10.7314/APJCP.2015.16.15.6187.
- Kawasaki H, Altieri DC, Lu CD, et al. Inhibition of apoptosis by survivin predicts shorter survival rates in colorectal cancer. Cancer Res. 1998;58:50–71. Available from: https://cancerres.aacrjournals.org/content/58/22/5071.
- Adebayo BO, Kuang-Tai K, Li-Ping Y, et al. HDAC inhibitor suppresses proliferation and tumorigenicity of drug-resistant chronic myeloid leukemia stem cells through regulation of hsa-miR-196a targeting BCR/ABL1. Exp Cell Res. 2018;370:519–530. doi:https://doi.org/10.1016/j.yexcr.2018.07.017.
- Lv YG, Yu F, Yao Q, et al. The role of survivin in diagnosis, prognosis and treatment of breast cancer. J Thorac Dis. 2010;2:100. Available from: https://www.ncbi.nlm.nih.gov/pmc/articles/PMC3256445/?report=abstract.
- Waligrska-Stachura J, Sawicka-Gutaj N, Zabel M, et al. Survivin DEx3 as a biomarker of thyroid cancers: A study at the mRNA and protein level. Oncol Lett. 2017;13:24–37. doi:https://doi.org/10.3892/ol.2017.5713.
- Mohamed S, Yasufuku K, Nakajima T, et al. Nuclear survivin in pN2 nonsmall cell lung cancer: prognostic and clinical implications. Eur Respir J. 2009;33:127–133. doi:https://doi.org/10.1183/09031936.00068708.
- Gudas JM, Payton M, Thukral S, et al. Cyclin E2, a novel G1 cyclin that binds Cdk2 and is aberrantly expressed in human cancers. Mol Cell Biol. 1999;19:612–622. doi:https://doi.org/10.1128/MCB.19.1.612.
- Masamha CP, Benbrook DM. Cyclin D1 degradation is sufficient to induce G1 cell cycle arrest despite constitutive expression of cyclin E2 in ovarian cancer cells. Cancer Res. 2009;69:6565–6572. doi:https://doi.org/10.1158/0008-5472.CAN-09-0913.
- Payton M, Scully S, Chung G, et al. Deregulation of cyclin E2 expression and associated kinase activity in primary breast tumors. Oncogene. 2002;21:8529–8534. doi:https://doi.org/10.1046/j.1365-2958.2000.01764.x.
- Müller-Tidow C, Metzger R, Kügler K, et al. Cyclin E is the only cyclin-dependent kinase 2-associated cyclin that predicts metastasis and survival in early stage non-small cell lung cancer. Cancer Res. 2001;61:647–653. doi:https://doi.org/10.1016/S0165-4608(00)00343-5.
- He H, Kondo Y, Ishiyama K, et al. Two unique HLA-A* 0201 restricted peptides derived from cyclin E as immunotherapeutic targets in leukemia. Leukemia. 2020: 1–11. doi:https://doi.org/10.1038/s41375-019-0698-z.
- Kim WS, Lee MJ, Kim DH, et al. 5′-OH-5-nitro-Indirubin oxime (AGM130), an Indirubin derivative, induces apoptosis of imatinib-resistant chronic myeloid leukemia cells. Leuk Res. 2013;37:427–433. doi:https://doi.org/10.1016/j.leukres.2012.12.017.
- Ishimi Y. A DNA helicase activity is associated with an MCM4, -6, and -7 protein complex. J Biol Chem. 1997;272:24508–24513. doi:https://doi.org/10.1074/jbc.272.39.24508.
- Ishimi Y, Komamura-Kohno Y, Kwon HJ, et al. Identification of MCM4 as a target of the DNA replication block checkpoint system. J Biol Chem. 2003;278:24644–24650. doi:https://doi.org/10.1074/jbc.M213252200.
- Kikuchi J, Kinoshita I, Shimizu Y, et al. Minichromosome maintenance (MCM) protein 4 as a marker for proliferation and its clinical and clinicopathological significance in non-small cell lung cancer. Lung Cancer. 2011;72:229–237. doi:https://doi.org/10.1016/j.lungcan.2010.08.020.
- Kwok HF, Zhang SD, McCrudden CM, et al. Prognostic significance of minichromosome maintenance proteins in breast cancer. Am J Cancer Res. 2015;5:52. Available from: https://pubmed.ncbi.nlm.nih.gov/25628920/.
- Tilghman J, Wu H, Sang Y, et al. HMMR maintains the stemness and tumorigenicity of glioblastoma stem-like cells. Cancer Res. 2014;74:3168–3179. doi:https://doi.org/10.1158/0008-5472.CAN-13-2103.
- Fu X, Zhu Y, Zheng B, et al. KIFC1, a novel potential prognostic factor and therapeutic target in hepatocellular carcinoma. Int J Oncol. 2018;52:1912–1922. doi:https://doi.org/10.3892/ijo.2018.4348.
- Sekino Y, Oue N, Shigematsu Y, et al. KIFC1 induces resistance to docetaxel and is associated with survival of patients with prostate cancer. Urol Oncol. 2017;35:1–8. doi:https://doi.org/10.1016/j.urolonc.2016.08.007.
- Wang P, Zou F, Zhang X. microRNA-21 negatively regulates Cdc25A and cell cycle progression in colon cancer cells. Cancer Res. 2009;69:8157–8165. doi:https://doi.org/10.1158/0008-5472.CAN-09-1996.
- Cangi MG, Pagano M, Loda M. Role of the Cdc25A phosphatase in human breast cancer. J Clin Invest. 2000;106:753–761. doi:https://doi.org/10.1172/JCI9174.
- Wu W, Fan YH, Kemp BL, et al. Overexpression of cdc25A and cdc25B is frequent in primary non-small cell lung cancer but is not associated with overexpression of c-myc. Cancer Res. 1998;58:4082–4085. Available from: https://cancerres.aacrjournals.org/content/58/18/4082.
- Hanning Y, Zhiyao X, Mingming C, et al. Overexpression of zwint predicts poor prognosis and promotes the proliferation of hepatocellular carcinoma by regulating cell-cycle-related proteins. OncoTargets Ther. 2018;11:689–702. doi:https://doi.org/10.2147/OTT.S152138.
- Li T, Xue H, Guo Y, et al. CDKN3 is an independent prognostic factor and promotes ovarian carcinoma cell proliferation in ovarian cancer. Oncol Rep. 2014;31:1825–1831. doi:https://doi.org/10.3892/or.2014.3045.
- Jung CR, Yoo J, Jang YJ, et al. Adenovirus-mediated transfer of siRNA against PTTG1 inhibits liver cancer cell growth in vitro and in vivo. Hepatology. 2016;43:1042–1052. doi:https://doi.org/10.1002/hep.21137.
- Li H, Yin C, Zhang B, et al. PTTG1 promotes migration and invasion of human non-small cell lung cancer cells and is modulated by miR-186. Carcinogenesis. 2013;34:2145–2155. doi:https://doi.org/10.1093/carcin/bgt158.
- Demeure MJ, Coan KE, Grant CS, et al. PTTG1 overexpression in adrenocortical cancer is associated with poor survival and represents a potential therapeutic target. Surgery. 2013;154:1405–1416. doi:https://doi.org/10.1016/j.surg.2013.06.058.