
ABSTRACT
Purpose
Multiple myeloma (MM) is a malignant disease with abnormal proliferation of clonal plasma cells. Hypoxia is an important factor in the pathogenesis and development of MM. However, the underlying mechanisms are not fully understood.
Material & Methods
To determine hub genes related to hypoxia in MM, this study took integrated bioinformatics analysis with two expression datasets (GSE80140 and GSE80545) downloaded from Gene Expression Omnibus (GEO) database. Differentially expressed genes (DEGs) were filtrated under the condition of both p-value < 0.05 and [log2FoldChange (log2FC)] > 1. Then, gene ontology (GO) and Kyoto encyclopedia of genes and genomes enrichment (KEGG) analysis, and protein–protein interaction (PPI) network construction were utilized to further explore these DEGs. PrognoScan evaluated all the candidate hub genes for survival analysis.
Results
In total, three hub genes, including FH, TSTA3, and POLR3G, were screened out to be related to hypoxia in MM. Patients with the lower expression level of FH, TSTA3, and POLR3G have statistically significantly longer disease- specific survival (Cox p < 0.05).
Conclusion
We identified FH, TSTA3, and POLR3G as hub genes which can affect MM patients’outcome and new biomarkers for diagnosis and prognosis of MM. Further functional and mechanistic studies are need to develop in order to make them as potential target for clinical treatment.
1. Introduction
Multiple myeloma (MM) is a hematological malignancy with about 1% morbidity and mortality of all tumors. In many countries, it has been the second most common malignant disease of the blood system [Citation1]. Recently, there are data showing that the incidence of MM in Asian countries is increasing rapidly [Citation2]. The characteristics of MM mainly include anemia, bone pain, and renal failure, leading to death eventually [Citation3]. With the great progress of treatments including immunoregulatory drugs, proteasome inhibitors, histone deacetylase inhibitors, and monoclonal antibodies in the past few decades, the survival period of MM has been significantly extended, but it still cannot be completely cured [Citation4,Citation5]. As a result, identifying new biomarkers is particularly essential for early diagnosis, effective treatment, and better prognosis of MM.
The hypoxic bone marrow (BM) microenvironment is an important factor for the occurrence and progression of MM. It is mainly manifested in the following aspects: (1) hypoxia reduces the adhesion of tumor cells and accelerates tumor development process [Citation6,Citation7]; (2) hypoxia promotes the expression of vascular endothelial growth factor A, and then neovascularization in the BM is accelerated [Citation8]; (3) hypoxia upregulates the expression of glycolysis-related genes such as lactate dehydrogenase A in MM cells, and the process of cellular glycolysis is significantly enhanced [Citation9]; (4) MM cells interact with BM stromal cells in the hypoxic microenvironment, and some clones enter a dormant state and then have drug resistance [Citation10].
In recent years, high-throughput platforms in gene expression (GE) is more and more important as a method to explore pathogenesis, prognosis prediction, and potential new target drugs of various diseases, including tumor [Citation11]. To date, several chip analyses have revealed the pathogenesis of MM [Citation6,Citation12,Citation13]. However, no chip analysis on hypoxia in MM is conducted, and related critical genes and signaling pathways remain to be clarified. So integrated bioinformatics analysis, including various methods, is utilized to explore hub genes related to hypoxia in MM.
In this study, two microarray datasets (GSE80140 and GSE80545) were downloaded from National Center for Biotechnology Information-Gene Expression Omnibus database (NCBI-GEO) (https://www.ncbi.nlm.nih.gov/geo/). We picked out differentially expressed genes (DEGs) and further analyzed these DEGs’ functions and pathway enrichment. Survival analysis was conducted with the online clinical data, and the results showed that expression levels of FH, TSTA3, and POLR3G were statistically significantly related to MM patients’ outcomes. These analysis results provided important information for further research in MM.
2. Material and methods
2.1. Microarray data information and DEG identification
The two GE datasets GSE80140 and GSE80545 were downloaded from NCBI-GEO [Citation14]. Both GSE80140 and GSE80545 were generated with Agilent-039494 SurePrint G3 Human GE v2 8 × 60K Microarray 039381. GSE80140 compared four myeloma cell lines (RPMI8226, KMS-11, KMS-12BM, and MM.1S) cultured under hypoxia (1% O2) with those cultured under normoxia (20% O2) for 48 h, respectively. GSE80545 profiled the GE in four primary myeloma patient samples exposed to normoxia versus those exposed to normoxia for 48 h. R package ‘limma’ was utilized to screen out DEGs between normoxic and hypoxic groups [Citation15]. Genes satisfied with p-value < 0.05 and [log2FoldChange (log2FC)] > 1 were picked out as DEGs. Then, all DEGs were visualized by volcanic maps, and the top 50 dramatically altered genes were selected to draw heatmaps by R package ‘ggplot2’ [Citation16]. Wayne diagram produced by the Venny 2.1.0 (http://bioinfogp.cnb.csic.es/tools/venny/index.html) online tool was used to show the common genes.
2.2. Gene ontology (GO) and Kyoto encyclopedia of genes and genomes (KEGG) analysis
DAVID (https://david-d.ncifcrf.gov/) was used to conduct GO enrichment analysis and KEGG pathway analysis. GO enrichment includes a biological process (BP), molecular function (MF), and cellular component (CC) as three subontologies. Analysis results were displayed with the ‘GOplot’ package of R [Citation17]. Pathway analysis results were further analyzed with ClueGO plug-ins of Cytoscape software 3.7.2 [Citation18]. A p-value less than 0.05 was considered the cut-off criterion.
2.3. Protein–protein interaction (PPI) analysis
A PPI network was established using the STRING database (https://string-db.org) in order to evaluate the proteins’ interrelation encoded by selected genes. Cytoscape software 3.7.2 was used to visualize the genes with a minimum interaction score of more than 0.4.
2.4. Survival analysis
The correlation between DEG expression and survival rate in MM was analyzed with the PrognoScan database (http://dna00.bio.kyutech.ac.jp/PrognoScan/) [Citation19]. We researched the relationship between GE and MM disease-specific survival (DSS) based on the GSE2658 dataset (n = 559) provided by Zhan [Citation20]. Cox p-value < 0.05 was treated as statistically significant.
3. Results
3.1. Identification of DEGs in MM
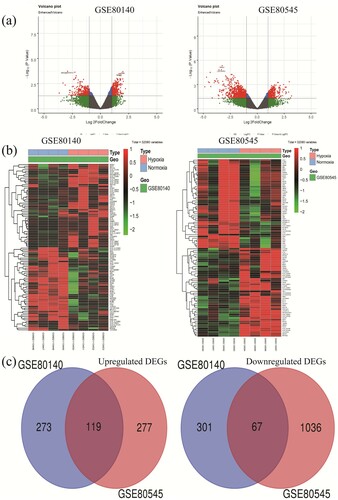
According to the standard of p-value < 0.05 and [log2FC] > 1, 760 and 1499 DEGs were identified using ‘limma’ R package from GSE80140 and GSE80545 ((a)), respectively. The top 50 significant DEGs were used to depicted the heatmaps ((b)). We next utilized Wayne diagram and identified 119 up-regulated genes and 67 down-regulated genes as common to the two datasets, respectively ((c)).
Figure 1. Identification of differentially expressed genes in two GE profiles (GSE80140 and GSE80545). (a) Respective volcanic maps of the two datasets. Up (red plots), the expression is up-regulated; down (green plots), the expression is down-regulated; no (gray plots), no significantly dysregulated. (b) Heatmaps of top 50 dramatically altered genes of DEGs in GSE80140 and GSE80545. (C) Commonly changed DEGs in the two datasets (119 up – and 67 down-regulated genes). DEGs, differentially expressed genes.
3.2. GO and KEGG enrichment analysis
We performed GO and KEGG analysis with candidate DEGs using a functional annotation tools in DAVID in order to further explore their functions. As shown in (a), the DEGs were examined according to three subontologies, including BP, MF, and CC, in GO enrichment analysis. Histone H3-K9 dimethylation pathway (p = 1.78E-04, FDR = 0.071474), catalytic activity pathway (p = 6.95E-04, FDR = 0.09272), and nucleoplasm pathway (p = 5.47E-06, FDR = 9.74E-04) were selected as the most significant pathway in each subontologies, respectively (). Forty-eight candidate DEGs were enriched in these three terms for further analysis. KEGG pathway enrichment analysis result showed that metabolic pathways (p = 1.73E-04, FDR = 0.016285) were the top enriched pathway according to their p-values, and there were 25 DEGs involved in this pathway ((b)).
Figure 2. GO and KEGG enrichment analysis of DEGs. (a) GO analysis including BP, MF, and CC three subontologies. (b) KEGG pathway enrichment analysis. GO, gene ontology; KEGG, Kyoto Encyclopedia of Genes and Genomes; DEGs, differentially expressed genes; BP, biological process; MF, molecular function; CC, cellular component.
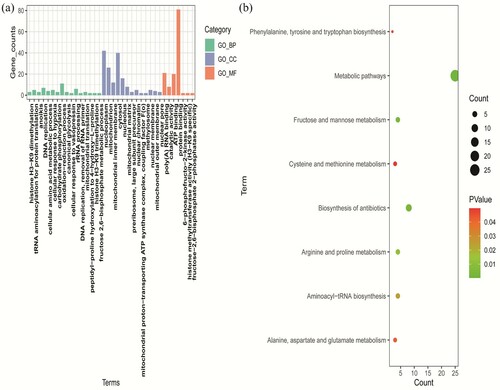
Table 1. Top 5 enriched terms of GO analysis.
As a result, 48 and 25 DEGs were selected in the GO and KEGG enrichment analysis, respectively (). Then, we screened out eight common genes with overlapping DEGs selected in the two analyses above. They were TSTA3, FH, FLAD1, PNPO, CAD, POLR3G, SCLY, and POLR3K.
Table 2. DEGs identified from GO and KEGG analysis.
3.3. PPI network construction
In order to further understand the correlation of candidate DEGs and pick out the hub genes, we constructed the PPI network involving all the DEGs from the GO and KEGG enrichment analysis based on the STRING online database, respectively ((a,b)). Then, we used Cytoscape plug-ins cytoHubba to screen all the candidate hub genes according to nodes rank ((c,d)). All the candidate genes were listed in . Then, we identified FH, POLR3K, TSTA3, POLR3G, and PNPO as common candidate hub genes in the two sets.
Figure 3. PPI network analysis. (a, b) The PPI analysis at STRING. (c, d) Cytoscape plug-ins cytoHubba analysis of candidate genes after PPI analysis. (a, c) Genes identified from GO analysis. (c, d) Genes identified from KEGG analysis. PPI, protein–protein interaction.
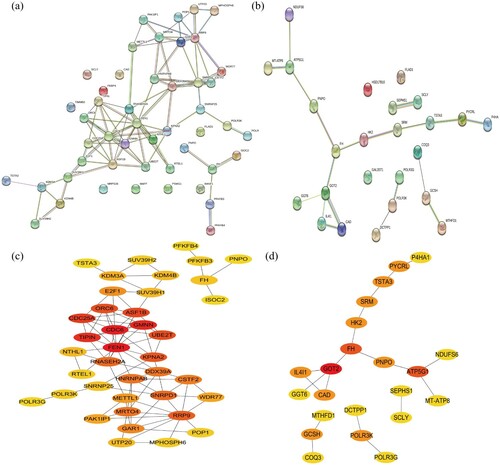
Table 3. The genes with the score of each analysis through the Cytoscape ‘cytoHubba’ module analysis
3.4. Survival analysis of DEGs
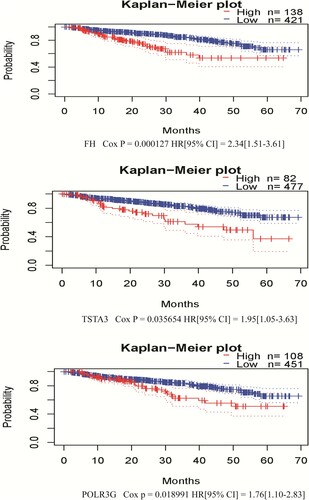
Finally, we assessed the potential prognostic value of candidate hub genes for MM utilizing PrognoScan [Citation19]. Based on the GSE2658 dataset (n = 559), three candidate hub DEGs were acquired to be statistically significant with DSS in MM, including FH (Cox p = 0.000127), TSTA3 (Cox p = 0.035654), and POLR3G (Cox p = 0.018991) ().
Figure 4. Correlation between individual statistically significant DEG expression and DSS in MM. Kaplan–Meier survival curves comparing high and low expression of DEGs in MM in PrognoScan, as based on the GSE2658 dataset (n = 559). Cox p < 0.05 was considered as statistically significant. DEGs, differentially expressed genes; DSS, disease-specific survival; MM, multiple myeloma.
4. Discussion
Due to the complex unknown pathogenesis of MM, it remains an incurable hematologic malignancy which leads to high rates of mortality. The hypoxic microenvironment in BM is closely related to the occurrence, development, treatment, and prognosis of MM. Therefore, it is essential to explore hypoxia-related hub genes with prognostic values to provide potential biosignatures for diagnosis and follow-up treatment of MM.
In this study, we analyzed the GE in two microarray datasets based on myeloma cell lines and primary MM patient samples. About 119 up-regulated and 67 down-regulated common DEGs were identified with p < 0.05 and [log2FC] > 1 standard. Then, we utilized GO term enrichment, signaling pathway enrichment, and PPI network establishment to further explore these DEGs, and FH, POLR3K, TSTA3, POLR3G, and PNPO were identified as candidate hub genes. Subsequently, survival analysis with PrognoScan based on clinical data of GSE2658 dataset revealed FH, TSTA3, and POLR3G were the hub genes associated with DSS of MM patients.
Fumarate hydratase (FH) is an integral enzyme component of the Krebs cycle and tricarboxylic acid cycle, and it can also act in different kinds of cancer [Citation21]. Ha YS et al. [Citation22] evaluated FH mRNA levels in 140 tumor specimens from the patients with primary renal cell cancer and in 62 specimens of corresponding normal-appearing kidney tissue. The results showed that FH was down-regulated in tumor specimens. Sudarshan S [Citation23], with his team, demonstrated that reduced expression of FH was associated with HIF-2α accumulation and tumor progression. However, another study found that FH inhibition, together with elevated intracellular fumarate, coincides with HIF upregulation. Besides, fumarate could increase the expression level of HIF-regulated genes [Citation24]. TSTA3, also known as GFUS (GDP-L-fucose synthase), is the substrate of several fucosyltransferases involved in the expression of many glycoconjugates [Citation25]. Changes in glycoprotein structure were common in cancer cells that can affect the adhesion, invasion, and metastasis of cells. Yang J et al. [Citation25] found high expression of TSTA3 was a potential biomarker for poor prognosis of esophageal squamous cell carcinoma patients. The same result was found in breast cancer, and the study further revealed that miR-125a-5p and miR-125b could regulate the expression of TSTA3 [Citation26]. POLR3G (RNA polymerase III subunit G), a version of RNA polymerase III, which is enriched in stem and cancer cells [Citation27]. Recently, Petrie JL et al. [Citation28] demonstrated the inhibition effect of POLR3G on cell differentiation and down-regulated POLR3G significantly reduced in the proliferation, invasiveness, tumor-initiating activity, and viability of prostate cancer cells.
5. Conclusion
In summary, we identified DEGs by integrated bioinformatics analysis to find hypoxia-related hub genes with prognostic value in MM. The study results provide several crucial DEGs for further research on the molecular pathogenic mechanisms and biomarkers of MM so that patients can get target therapy and a longer survival period in the future. It’s worth noting that different research results mentioned above showed that the same gene might express at different levels in different tumors, especially in hematologic malignancies. More molecular biological researches are still required to verify the DEGs’ function in MM.
Disclosure statement
The authors declare that there is no conflict of interests.
Additional information
Funding
References
- Fitzmaurice C, Dicker D, Pain A, et al. The global burden of cancer 2013. JAMA Oncol. 2015;1(4):505–527.
- Lu J, Lee JH, Huang SY, et al. Continuous treatment with lenalidomide and low-dose dexamethasone in transplant-ineligible patients with newly diagnosed multiple myeloma in Asia: subanalysis of the FIRST trial. Br J Haematol. 2017;176(5):743–749.
- Pawlyn C, Morgan GJ. Evolutionary biology of high-risk multiple myeloma. Nat Rev Cancer. 2017;17(9):543–556.
- Manier S, Salem KZ, Park J, et al. Genomic complexity of multiple myeloma and its clinical implications. Nat Rev Clin Oncol 2017;14(2):100-113.
- Sonneveld P, Avet-Loiseau H, Lonial S, et al. Treatment of multiple myeloma with high-risk cytogenetics: a consensus of the international myeloma working group. Blood. 2016;127(24):2955–2962.
- Zhu FX, He YC, Zhang JY, et al. Using prognosis-related gene expression signature and connectivity Map for personalized drug repositioning in multiple myeloma. Med Sci Monit. 2019;25:3247–3255.
- Viziteu E, Grandmougin C, Goldschmidt H, et al. Chetomin, targeting HIF-1α/p300 complex, exhibits antitumour activity in multiple myeloma. Br J Cancer. 2016;114(5):519–523.
- Bhaskar A, Tiwary BN. Hypoxia inducible factor-1 alpha and multiple myeloma. Int J Adv Res. 2016;4(1):706–715.
- Ikeda S, Kitadate A, Abe F, et al. Hypoxia-inducible KDM3A addiction in multiple myeloma. Blood Adv. 2018;2(4):323–334.
- Maiso P, Huynh D, Moschetta M, et al. Metabolic signature identifies novel targets for drug resistance in multiple myeloma. Cancer Res. 2015;75(10):2071–2082.
- Kulasingam V, Diamandis EP. Strategies for discovering novel cancer biomarkers through utilization of emerging technologies. Nat Clin Pract Oncol. 2008;5(10):588–599.
- Long S, Long S, He H, et al. MicroRNA-765 is pregulated in multiple myeloma and serves an oncogenic role by directly targeting SOX6. Exp Ther Med. 2019;17(6):4741–4747.
- Jin Z, Zhou S, Ye H, et al. The mechanism of SP1/p300 complex promotes proliferation of multiple myeloma cells through regulating IQGAP1 transcription. Biomed Pharmacother. 2019;119:109434.
- Ikeda S, Kitadate A, Abe F, et al. Hypoxia-inducible microRNA-210 regulates the DIMT1-IRF4 oncogenic axis in multiple myeloma. Cancer Sci. 2017;108(4):641–652.
- Ritchie ME, Phipson B, Wu D, et al. Limma powers differential expression analyses for RNA-sequencing and microarray studies. Nucleic Acids Res. 2015;43(7):e47.
- Ito K, Murphy D. Application of ggplot2 to pharmacometric graphics. CPT Pharmacometrics Syst Pharmacol. 2013;2:79.
- Walter W, Sanchez-Cabo F, Ricote M. GOplot: an R package for visually combining expression data with functional analysis. Bioinformatics. 2015;31(17):2912–2914.
- Shannon P, Markiel A, Ozier O, et al. Cytoscape: a software environment for integrated models of biomolecular interaction networks. Genome Res. 2003;13(11):2498–2504.
- Mizuno H, Kitada K, Nakai K, et al. Prognoscan: a new database for meta-analysis of the prognostic value of genes. BMC Med Genomics. 2009;2:18.
- Zhan F, Barlogie B, Arzoumanian V, et al. Gene-expression signature of benign monoclonal gammopathy evident in multiple myeloma is linked to good prognosis. Blood. 2007;109(4):1692–1700.
- King A, Selak MA, Gottlieb E. Succinate dehydrogenase and fumarate hydratase: linking mitochondrial dysfunction and cancer. Oncogene. 2006;25(34):4675–4682.
- Ha YS, Chihara Y, Yoon HY, et al. Downregulation of fumarate hydratase is related to tumorigenesis in sporadic renal cell cancer. Urol Int. 2013;90(2):233–239.
- Sudarshan S, Shanmugasundaram K, Naylor SL, et al. Reduced expression of fumarate hydratase in clear cell renal cancer mediates HIF-2alpha accumulation and promotes migration and invasion. PLoS One. 2011;6(6):e21037.
- Isaacs JS, Jung YJ, Mole DR, et al. HIF overexpression correlates with biallelic loss of fumarate hydratase in renal cancer: novel role of fumarate in regulation of HIF stability. Cancer Cell. 2005;8(2):143–153.
- Yang J, Kong P, Yang J, et al. High TSTA3 expression as a candidate biomarker for poor prognosis of patients With ESCC. Technol Cancer Res Treat. 2018;17:1533033818781405.
- Sun Y, Liu X, Zhang Q, et al. Oncogenic potential of TSTA3 in breast cancer and its regulation by the tumor suppressors miR-125a-5p and miR-125b. Tumour Biol. 2016;37(4):4963–4972.
- Renaud M, Praz V, Vieu E, et al. Gene duplication and neofunctionalization: POLR3G and POLR3GL. Genome Res. 2014;24(1):37–51.
- Petrie JL, Swan C, Ingram RM, et al. Effects on prostate cancer cells of targeting RNA polymerase III. Nucleic Acids Res. 2019;47(8):3937–3956.