
ABSTRACT
Objection
Primary myelofibrosis (PMF) is a familiar chronic myeloproliferative disease with an unfavorable prognosis. The effect of infection on the prognosis of patients with PMF is crucial. Immune system dysregulation plays a central role in the pathophysiology of PMF. To date, very little research has been conducted on the molecular mechanism of immune compromise in patients with PMF.
Methods
To explore potential candidate genes, microarray datasets GSE61629 and 26049 were obtained from the Gene Expression Omnibus (GEO) database. The differentially expressed genes (DEGs) between PMF patients and normal individuals were evaluated, gene function was measured and a series of hub genes were identified. Several significant immune cells were selected via cell type enrichment analysis. The correlation between hub genes and significant immune cells was determined.
Results
A total of 282 DEGs were found, involving 217 upregulated genes and 65 downregulated genes. Several immune cells were found to be reduced in PMF, such as CD4+ T cells, CD4+ Tems, CD4+ memory T cells. Gene Ontology (GO) enrichment analysis of DEGs reflected that most biological processes were associated with immune processes. Six hub genes, namely, HP, MPO, MMP9, EPB42, SLC4A1, and ALAS2, were identified, and correlation analysis revealed that these hub genes have a negative correlation with immune cell abundance.
Conclusions
Taken together, the gene expression profile of whole blood cells in PMF patients indicated a battery of immune events, and the DEGs and hub genes might contribute to immune system dysregulation.
1. Introduction
Primary myelofibrosis (PMF) is a chronic myeloproliferative disease (Ph-negative) that is a myeloproliferative neoplasm (MPN) with the main characteristics of a significantly enlarged spleen, enhanced oxidative stress, advanced bone marrow fibrosis and extramedullary haematopoiesis [Citation1]. PMF usually occurs in middle-aged and elderly individuals, and the median age is approximately 67 [Citation2]; its annual incidence is approximately 0.6∼1.3/100,000. Although PMF is uncommon, the median survival time of intermediate-risk patients is only approximately 5 years, and there is still a lack of specific treatments. The most important factors related to the prognosis of PMF are complications, such as thrombosis, haemorrhage, and infection [Citation2–4]. Among them, infections are one of the main causes of unfavorable prognosis in myelofibrosis, representing the cause of death in approximately 10% of cases [Citation6,Citation7]. Autoimmune symptoms are a main characteristic of patients with PMF [Citation5].
In general, patients with PMF have a pro-inflammatory milieu and dysregulated immune system phenomena. Immune function loss and dysregulation are potential reasons for the increased infection risk in PMF [Citation8]. Currently, much progress has been made against the immune function of PMF patients. Researchers found that myelofibrosis is closely associated with high circulating levels of inflammatory cytokines [Citation9,Citation10]. A decreased frequency of Tregs was observed in the blood of PMF patients [Citation11]; Clodagh et al. found that CD4+CD127lowCD25highFOXP3+ T regulatory cells were reduced in MPN patients [Citation12]. These previous studies provide a deep understanding of the key factors of immunosuppression in PMF patients.
A clear pathogenesis is one basic condition of the clinical protocol for precise treatment. An example is the discovery of JAK2 (V617F) or MPL (W515) mutations. This mechanism has provided inspiration for novel therapeutics for PMF patients, such as JAK2 inhibitors (although most JAK2 inhibitors are effective in ameliorating some symptoms, they have little impact on bone marrow fibrosis [Citation13]). However, to date, the molecular mechanism of infection for PMF patients is still difficult to pin down precisely. In this regard, exploring and elucidating the in-depth mechanisms of immune responses may offer some inspiration to reduce the occurrence of complications, ensure the quality of prognosis and develop targeted medicine for PMF. Rapidly developed omics and bioinformatics technologies have offered comprehensive insight into the molecular mechanisms of various clinical issues, and some satisfactory results may be obtained through bioinformatics analysis based on public databases [Citation14].
In this study, comprehensive bioinformatics analysis based on two Gene Expression Omnibus (GEO) datasets was applied to explore the potential molecular factors in PMF. We hypothesize that the mechanism of immunosuppression may be associated with the proliferation and differentiation of haematopoietic stem cells; thus, expression profiles from the whole blood cells of PMF patients were chosen as the analytic target. The purpose of this study was to identify the hub genes with immunological effects in PMF to provide a potential research strategy of the molecular mechanism.
2. Materials and methods
2.1. Affymetrix microarray data acquisition and quality control
Fig. S1 performs the whole workflow of this study. Expression profiles of GSE61629 and GSE26049 were downloaded from NCBI-GEO (https://www.ncbi.nlm.nih.gov/geo/). Pre-treatment and quality control procedures, including probe annotation, duplicates removing, data normalization and principal component analysis (PCA) were all executed by using R software (3.6.1).
2.2. Immune cell infiltration analysis
xCell [Citation15], an online tool that can achieve cell type enrichment analysis based on gene expression data, was chosen to analyze the immune cell infiltration of PMF and control groups in GSE61629 and GSE26049 datasets. Results of xCell, that is, xCell scores, were obtained and carried out significance analysis to measure the remarkable immune genes, heatmap was used to visualized the cell type enrichment scores d. The comparison of common cell types from different datasets were performed through Venn diagrams.
2.3. Identification of DEGs
A normalized expression matrix was used to identify the DEGs. DEGs between PMF and control were identified via Limma package in R, the cut-offs of statistically significant DEGs were set to |LogFC| > 1 and P < 0.05. If LogFC > 1, DEGs can be regard as up regulated; if LogFC < −1, DEGs should be deemed to be down regulated.
2.4. Gene ontology (GO) and pathway enrichment analysis of DEGs
GO enrichment and Kyoto encyclopedia of genes and genomes (KEGG) pathway analysis were chosen to explore the DEGs at the functional level. The Database for Annotation, Visualization, and Integrated Discovery (DAVID, https://david.ncifcrf.gov/summary.jsp) was used as the functional analysis tool. The cut-off criterion was set as P < 0.05. The result of GO with three terms was performed through enrich circle plot, and KEGG analysis was showed in a bubble plot.
2.5. Construction of PPI network
Search Tool for the Retrieval of Interacting Genes (STRING; http://string-db.org)(11.0b) was used to predict the PPI network of the common DEGs. The result of STRING was stored as TSV format and visualized in Cytoscape (3.7.2), an open source bioinformatic platform, to achieve the visualization of PPI network. MCODE, a plugin of Cytoscape, was used to excavate modules in the whole network.
2.6. Screening of hub genes
CytoHubba with a series of topological analysis methods was used to select hub genes, the rank of nodes was decided by their attributes in the whole network. In this study, total five selection methods of CytoHubba, involving MNC, stress, closeness, degree and radiality, were used to screen hub genes. The hub genes were selected with degrees ≥10. Venn diagram was used to obtain the intersection result of five sets that based on various taxonomy methods. The expression of six hub genes was performed by NetworkAnalyst 3.0 (https://www.networkanalyst.ca/). Human Protein Atlas was explored to ensure the specific expression tissue of hub genes.
2.7. Determination of the relationship between the immune cells and hub genes
Gene expression and xCell score matrixes were used to calculate correlation coefficients. The correlation heat map was based on the result of a built-in function in R, corr.test. The detail results of Pearson's correlation coefficient were performed by using scatter diagrams.
2.8. Construction of hub genes’ miRNA regulatory and potential drug network
The miRNet (https://www.mirnet.ca/miRNet/home.xhtml), a miRNA-centric network visual analytics platform, was chosen to predict the potential miRNAs of hub genes [Citation16]. The latent drugs for hub genes were measured through the protein-drugs interaction analysis function of NetworkAnalyst 3.0, which based on Drugbank online database (https://go.drugbank.com/). All the prediction results were visualized by using Cytoscape software.
2.9. Statistical analysis and drawing tools
The xCell data were analyzed with the Social Sciences (SPSS) software. Significant differences between groups were statistically analyzed by Tukey test (T test), P<0.05. R software (3.6.1), Hiplot tools (https://hiplot.com.cn/), Omicshare tools (https://www.omicshare.com/tools/) and graphpad prism 5 were used to draw diagrams.
3. Results
3.1. Affymetrix microarray data quality control
A total of 30 samples from GEO database were divided into control group (n = 17) and PMF group (n = 13). To remove the batch effect, each dataset was normalized. Box plots show that direct data become neat after normalization (Fig. S2a, b, c and d). 3D-PCA results reflect that the PMF group and the control group are discriminated well; the greater the distance is between two symbol points (blue triangle and red circle), the more significant the differences between the samples (Fig. S2e, f).
3.2. Identification of significant immune cells in PMF
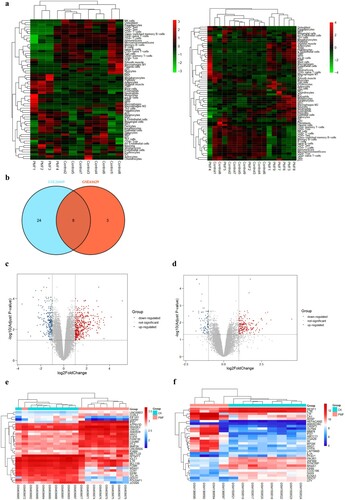
A total of 64 cell types were explored, and approximately 40% of them were immune cells. There was a markedly disparate pattern of infiltrated cell types between PMF and controls. The enrichment scores of CD4+ T cells, CD4+ Tem cells, CD4+ memory cells, and CD8+ Tem cells were decreased in the PMF group compared to the controls (a). In total, 32 and 11 significant cell types were selected from the GSE26049 and GSE61629 datasets (t-test, P<0.05), respectively. Furthermore, we found eight common significant cell types from the two datasets (b), including CD4+ T cells, CD4+ Tems, CD4+ memory T cells, CD8+ Tems, melanocytes, natural killer (NK) cells, preadipocytes and classical dendritic cells (cDCs).
Figure 1. Heat maps of potential cell types in PMF and control groups, (a): cell types of GSE61629 dataset; cell types of GSE 26049 dataset; (b): the corporate cell types in the GSE61629 and GSE26049 datasets.(c): volcano plot of DEGs in GSE61629 dataset; (d): volcano plot of DEGs in GSE26049 datasets; (e): heat map of the top 40 DEGs in GSE61629 dataset; (f): heat map of the top 40 DEGs in GSE26049 dataset.
3.3. Identification of DEGs
In the GSE61629 dataset, compared with the control group, a total of 383 DEGs were identified in the PMF group, involving 274 upregulated genes and 109 downregulated genes (c). There were 674 DEGs in the GSE26049 dataset, consisting of 436 upregulated genes and 238 downregulated genes (d). The distinct DEG expression pattern successfully grouped the PMF and control samples (e and f).
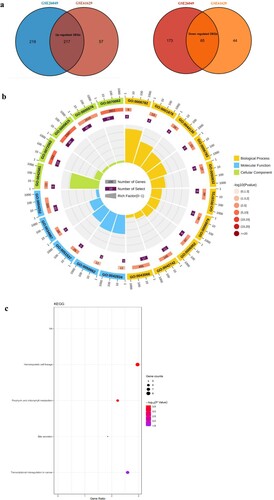
There were 282 DEGs shared by the two datasets, involving 217 upregulated DEGs and 65 downregulated DEGs (a). The top 10 genes with the most significant expression changes are listed in Table S1.
Figure 2. Functional and pathway enrichment analyses of DEGs, (a): Venn diagram displays the common DEGs in the GSE61629 and GSE26049 datasets; (b): the enrich circle plot presents the top 20 most remarkable enriched GO terms, different color module represents various term; (c): the bubble plot reflects the result of KEGG pathway analysis.
3.4. Functional enrichment analysis of DEGs
Potential biological pathways of DEGs were illustrated through GO analysis and KEGG pathway enrichment. Three terms were analysed in GO enrichment, including biological processes, cell composition and molecular function. b presents the top 20 most markedly enriched GO terms. The top 10 biological processes are marked as yellow modules, which are primarily associated with defence responses to bacteria, defence responses, haem biosynthetic processes, protoporphyrinogen IX biosynthetic processes, antibacterial humoural responses, cellular iron ion homeostasis, defence responses to fungi and so on. The most significant cell composition and molecular function terms were extracellular space and 2 iron, 2 sulfur cluster binding. Other GO analysis details are shown in Table S2.
KEGG pathway enrichment analysis was demonstrated by bubble diagram (c). The analysis shows that the major pathway of DEGs is associated with the haematopoietic cell lineage (Fig. S3a), involving a series of genes, such as IL1A, GYPA, TFRC, ITGA2B, CD3G, CD24, IL7R and MS4A1 (Fig. S3b).
3.5. Protein–protein interaction (PPI) network analysis and hub gene identification
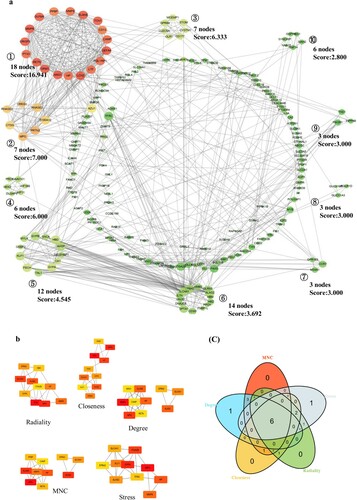
To explore the most significant clusters of DEGs, STRING was used to establish a PPI network of DEGs. Ten major modules were recognized by the MCODE plug-in of Cytoscape; among them, module 1, with 18 nodes and 144 edges, was the most significant (a). Five ranking methods of CytoHubba were chosen to identify hub genes in the whole network, and all related results were intersected via a Venn diagram. Finally, a total of 6 common hub genes (HP, MPO, MMP9, EPB42, SLC4A1 and ALAS2) were selected (b and c). Hub gene details are listed in Table S3.
Figure 3. PPI network and hub gene selection, (a): PPI network of 282 DEGs; (b): five topological analysis methods based on CytoHubba; (c): Venn plot reflects the intersected hub genes based on five taxonomic methods.
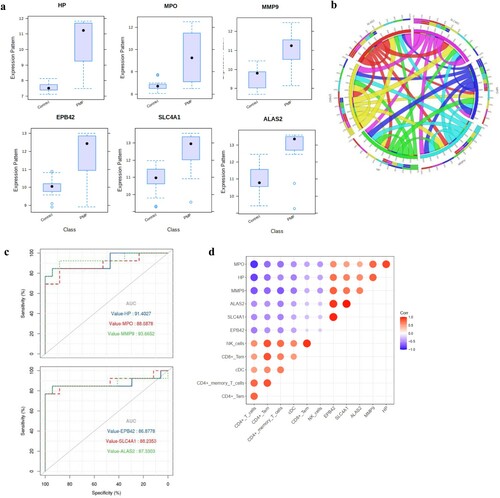
As shown in a, the expression of HP was upregulated in the PMF groups compared to the control groups. A similar differential expression pattern was identified for MPO, MMP9, EPB42, SLC4A1 and ALAS2 between these two groups; that is, their expression was upregulated in the PMF groups. Basically, these hub genes were specifically expressed in bone marrow and lymphoid tissues (Table S3). A chordal graph was used to reflect a positive association between hub genes, and the most prominent relationship was found between MPO and HP, SLC4A1 and ALAS2, and SLC4A1 and EPB42 (b). ROC curves were applied to measure the prognostic values of the six hub gene risk scores compared with the control group (c). The AUCs of HP, MPO, MMP9, EPB42, SLC4A1 and ALAS2 for the risk scores were 0.914, 0.886, 0.936, 0.868, 0.882 and 0.873, respectively.
Figure 4. Characteristics of six hub genes, (a): the expression of each hub gene in the two datasets; (b): the correlation chordal graph of hub genes; (c): ROC curve of each hub genes; (d): the correlation heat map of hub genes and significant immune cells.
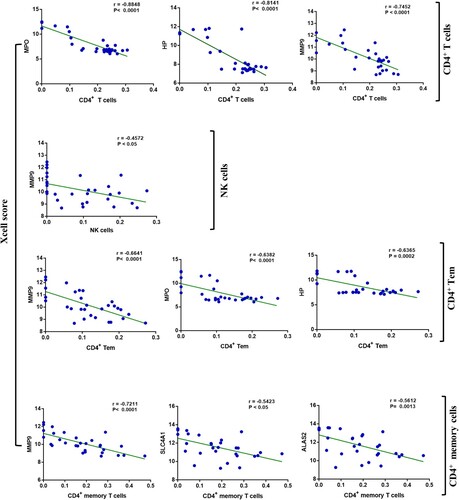
3.6. Association between hub genes and significant immune cells
We found a series of negative correlations between hub genes and significant immune cells (d). The most remarkable correlations emerged among HP, MPO, and MMP9 with CD4+ T cells, with Pearson correlation coefficients reaching −0.8848, −0.8141 and −0.7452 (P<0.0001), respectively. The threshold of the Pearson correlation coefficient is set as 0.6. Other hub genes also showed certain negative correlations with immune cells, such as SLC4A1 and memory CD4+ cells; however, their relationship was not statistically significant ().
Figure 5. Correlation between hub genes and significant immune cells. The level of association was examined with Pearson's correlation coefficients.
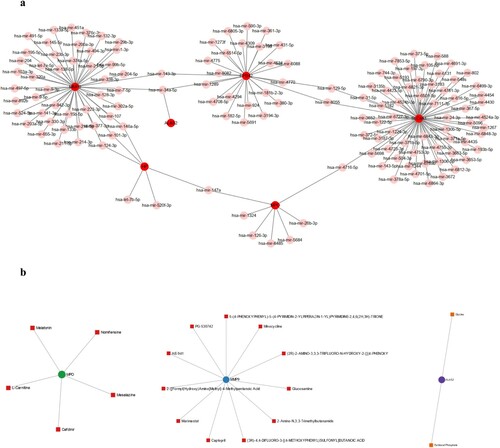
3.7. Construction of hub gene miRNA regulatory and potential drug networks
The miRNA regulatory network of the six hub genes was constructed using miRNet. Each hub gene has multiple relevant miRNAs, which form a complex communication network (a). Some miRNAs are related to two or more targeted hub genes, including hsa-miR-143-3p, hsa-miR-34a-5p, hsa-miR-129-5p, hsa-miR-8055, hsa-miR-4716-5p and hsa-miR-147a. For the protein drug interaction analysis, eighteen potential drugs related to the hub genes were screened. Among the explored drugs, five were associated with MPO, eleven drugs targeted MMP, and two drugs were associated with ALAS2 (b).
Figure 6. The miRNA regulatory and potential drug network of hub genes, (a): the miRNA regulatory network, hub genes were marked with red color; (b): the potential drug network of MPO, MMP9 and ALAS2.
4. Discussion
In clinical practice, PMF has diverse clinical presentations, which reflect a complex regulatory network. Immune system dysregulation plays a central role in the pathophysiology of PMF [Citation17], but the in-depth mechanism remains unknown. Fortunately, integrated bioinformatics tools have become incredibly powerful in extracting large-scale clinical data and gene expression profiles via public databases [Citation18]. In this study, we found 282 common DEGs and identified six hub genes. To our knowledge, these six hub genes are the first to be reported in the pathogenesis of PMF.
GO enrichment analysis indicated that most biological processes were associated with immune processes (e.g. the defence response), involving the majority of identified DEGs. Infection is one of the most important complications that affects the prognosis of PMF patients. KEGG analysis of DEGs showed that the most significant pathway was the haematopoietic cell lineage. It is known that PMF is mainly caused by clonal haematopoietic stem cell abnormalities, and the most obvious characteristics of blood are anaemia (moderate to significant) and normal or abnormal numbers of white blood cells and platelets. The morphological manifestations of peripheral blood include leuco-erythroblastosis, a significant increase in abnormal red blood cells and teardrop-shaped red blood cells.
Blood cell development initiates from haematopoietic stem cells (HSCs). HSCs can differentiate into a multi-lineage committed progenitor cells, such as common lymphoid progenitors (CLPs) and common myeloid progenitors (CMPs). CMPs give rise to the myeloid lineage, including erythrocytes, some leukocytes and megakaryocytes that produce platelets; cells belonging to the lymphoid lineage (white blood cells, leukocytes, NK cells, T and B lymphocytes) are differentiated from CLPs. At each stage, multiple genes perform different functions within the differentiation procedure (a). Haematopoiesis is orchestrated via a tightly regulated network. Haematopoiesis homeostasis is important, and the imbalance between cells, genes and the microenvironment could induce the relevant disruption to contribute to some haematological diseases, more specifically, myeloproliferative disorders [Citation19,Citation20].
Furthermore, we identified six hub genes from the PPI network, including HP, MPO, MMP9, EPB42, SLC4A1 and ALAS2. HP is an acute phase plasma protein that participates primarily in inflammatory reactions and has various functions, such as antibacterial, antioxidant, carbon monoxide inhibition, and angiogenesis functions [Citation21]. HP is closely related to coronary heart disease, diabetes, hypertension, blood diseases, autoimmune diseases and malignant tumors [Citation22], and it is regarded as a marker of inflammation in clinical cases. In general, an elevated HP level occurs during infections, injuries, and malignancies [Citation23]. Our analysis shows that the expression of HP was increased in PMF patients, which could reflect the level of infection.
MPO is a key mediator of the function of immune and non-immune cells through its non-enzymatic effects. MPO binds to the cell surface of multiple cells, such as platelets [Citation24], neutrophils [Citation25,Citation26], and erythrocytes [Citation27,Citation28], which can activate intracellular signaling processes and change cellular structural and functional characteristics. In this study, the expression profile showed an upregulated trend of MPO, indicating an increased level of halogen-containing compounds. However, the overproduction of halogen-containing compounds could lead to host cell and tissue damage, causing oxidative/halogenative stress responses and resulting in numerous inflammatory diseases [Citation29,Citation30]. The increased level of MPO could make a greater contribution to the progression of infection in PMF. Additionally, pathologic thrombus formation can be caused by an increased activity of blood platelets [Citation31]. A previous study proved that an increased activity of platelets was affected by elevated levels of MPO [Citation32]. Thus, thrombus, a common complication for PMF patients, is also related to the overexpression of MPO.
MMP9 belongs to the matrix metalloproteinase (MMP) family, and MMPs regulate tissue remodeling and repair, inflammatory responses, cellular proliferation, migration, differentiation, angiogenesis, defence response and so on [Citation33]. Similar to other MMPs, MMP9 is mainly secreted by neutrophils and macrophages and regulates inflammation in tissues and diseases [Citation34–37]. The expression of MMP9 is upregulated in some diseases associated with inflammatory processes, such as arthritis and cancer [Citation38]. Gene expression of peripheral blood MMP9 was found to be upregulated in PMF patients in this study. Coincidentally, researchers also found that the plasma levels of total and active MMP9 were increased in patients with idiopathic myelofibrosis [Citation39], and Jensen et al. found that the level of blood MMP9 was increased in polycythaemia vera patients [Citation40]. The proteolytic properties of MMP9 may exacerbate disease progression under pathophysiological conditions [Citation41], which may also indicate the role of MMP9 in the prognosis of PMF. Moreover, MMP9 affects blood cell development. Youn et al. reported that MMP9 is a negative regulator of erythroid development, and the expression level of MMP9 above the activation threshold is antagonistic to erythropoiesis [Citation42]. We propose that the overexpression of MMP9 in patients with PMF may cause the abnormal erythrocyte development.
The EPB42 gene encodes protein 4.2, which is a key protein of the erythrocyte membrane and an ATP-binding protein that regulates band 3 and ankyrin. A previous study found that EPB42 regulates the shape and mechanical properties of erythrocytes [Citation43]. We found that the expression of EPB42 was markedly enhanced in the PMF group, which perhaps implies a potential effect of EBP42 on the erythrocyte function of PMF patients. This result could even reflect an association with immune function due to the negative correlation between EPB42 and some immune cells. However, there is still less research focusing on the in-depth function of EPB42, and whether EPB42 interferes with the immune function of patients with PMF needs future study.
Cl-/HCO3-anionic exchange transporter 1 in erythrocytes (band 3/eAE1) and anionic exchange transporter 1 in α-intercalated kidney cells (kAE1) are encoded by SLC4A1[Citation44]. The encoded proteins of SLC4A1 play an important role in the maintenance of red blood cell structure and the transport of anions [Citation45]. A previous study reported that SLC4A1 has a direct effect on erythroid development [Citation46]. Peripheral blood of patients with PMF may exhibit immature redness, increased myeloblasts, and abnormal red blood cell morphology due to the destruction of bone marrow fibrous sclerosis and microenvironment structure. We suspect that erythroid hyperplasia and abnormal red blood cell morphology are associated with the upregulated expression of SLC4A1 and EPB42 in PMF patients. Furthermore, according to several recent studies, SLC4A1 is reported to be closely associated with some immune-related diseases. Kawamoto et al. found that the production of auto-antibodies that bind to erythrocyte membranes could be stimulated through band 3 expression in colorectal cancer cells, which could cause immune-related anaemia [Citation47,Citation48]. Researchers also suggested that SLC4A1 has the potential to be a candidate gene in the pathogenesis of lupus and lupus nephritis, and SLC4A1 could stimulate innate immune cell functional activity [Citation49].
5-Aminolevulinic acid synthase (ALAS) is encoded by ALAS2 and can catalyze the formation of 5-aminolevulinic acid from succinyl-coenzyme A and glycine, which is the first step in haemoglobin synthesis [Citation50]. Increased haemoglobin synthesis could promote haematopoietic cell differentiation [Citation51]. The upregulated expression of ALAS2 could cause enhanced haem production, haemoglobinization, and erythropoiesis [Citation52]. In this study, we found that the expression of ALAS2 was enhanced in patients, reflecting that ALAS2, similar to EPB42 and SLC4A1, could affect the abnormally increased erythropoiesis in PMF [Citation53], which may be related to ineffective erythropoiesis. Ineffective erythropoiesis is one of the main causes of anaemia and organomegaly. In addition, several studies revealed that haem- or haemoglobin-related genes were also expressed in non-erythrocyte cells, such as cervicovaginal epithelial cells and murine macrophages, in response to different stress conditions [Citation54,Citation55]. It is well established that haem is an important molecular factor for cellular physiological and metabolic functions. However, excessive free haem has toxic effects on cells [Citation56]. In this study, we conjecture that the enhanced expression of ALAS2 reflects an increased level of haem, indicating a feasible reason for the immunological response in patients with PMF.
To prove our conjecture, the cell proportion of the dataset was measured, and the correlativity between hub genes and significant immune cells was determined. Most stromal cells were not significant, according to the t-test. We found that the proportions of some immune cells, such as CD4+ T cells, CD4 + Tem cells, CD4 + memory cells and CD8+ Tem cells, were markedly reduced in the PMF group. This situation suggests a common phenomenon in patients with chronic infections, that is, T cell exhaustion. Due to long-term exposure to persistent antigens and inflammation, exhausted T cells gradually lose their effector functions, and memory T cell characteristics begin to be lost [Citation57]. Previous studies also support our findings; for instance, the frequency of Tregs was decreased in PMF patients [Citation11], and CD4+CD127lowCD25highFOXP3+ T regulatory cells were reduced in MPN patients [Citation12]. All of these findings suggest that T cell exhaustion, or T cell loss, plays a key role in the chronic inflammation process of PMF. However, cellular proportion analysis based on bioinformatics tools is still limited, and relevant experimental research is lacking. This hypothesis needs further verification. In addition, we think that some hub genes contribute to immune cell loss because there is a negative correlation between other hub genes and immune cells. A study proved that HP suppresses T lymphocyte responses to PHA and concanavalin A as well as B cell mitogenesis in response to LPS [Citation58]. HP could prevent Langerhans cells from undergoing functional transformation and from activating autologous T cells [Citation59]. Arredouani et al. offered evidence of the effect of HP on T lymphocyte functions and found that HP could specifically result in strong suppression-induced T cell proliferation. In addition, HP also inhibits Th2 cytokine release in vitro [Citation60]. MPO is intimately related to T cell proliferation and responses. Researchers found that the enhanced generation of T cell responses was attributable to MPO deletion in experimental glomerulonephritis and multiple sclerosis [Citation61,Citation62]; MPO could also affect adaptive immunity via the inhibition of murine and human DC activation [Citation63]. In tumors, MMP9 can support the development of myeloid-derived suppressor cells (MDSCs) via c-kit and osteopontin cleavage [Citation64], while MDSCs are negative regulatory cells that can inhibit the T cell immune response in cancer patients [Citation65]. For the other three hub genes, there is still a lack of evidence about the relationship between them and T cells; thus, further research is needed.
To measure the regulatory relationships of hub genes at a deeper level, we produced a complicated miRNA network. Certain miRNAs with multiple targets were identified, such as hsa-miR-34a-5p. Hsa-mir-34a-5p could regulate MMP9, EPB42 and ALAS2, which implies that it could be regarded as a potential target. Interestingly, according to the hypothesis of Lu, hsa-miR-34a-5p could regulate T cell differentiation by affecting epigenetic progress [Citation66]. Additionally, the T cell activation regulation function whereby hsa-miR-34a-5p mediates the WNT, Ras-ERK and NF-κB pathways has already been proven [Citation67]. Therefore, the regulatory relationship between MMP9, EPB42, ALAS2 and hsa-miR-34a-5p may play a part in the immunological process of PMF patients.
In summary, the gene expression profile of whole blood cells in patients with PMF indicates a battery of immune events. The haematopoietic cell lineage could be a pivotal pathway for erythroid and immune cell differentiation in the progression of PMF. The decrease in immune cells could be related to the upregulation of hub genes. All of these findings suggest that the identified DEGs and six hub genes may contribute to immune system dysregulation.
Availability of data and materials
The datasets GSE61629, GSE26049 can be found in the GEO (http://www.ncbi.nlm.nih.gov/geo/).
Supplemental Material
Download PDF (564.6 KB)Disclosure statement
No potential conflict of interest was reported by the author(s).
Additional information
Funding
References
- Tefferi A. Primary myelofibrosis: 2019 update on diagnosis, risk-stratification and management. Am J Hematol. 2018;93:1551–1560.
- Mesa RA, Silverstein MN, Jacobsen SJ, et al. Population-based incidence and survival figures in essential thrombocythemia and agnogenic myeloid metaplasia: an olmsted county study, 1976–1995. Am J Hematol. 1999;61:10–15.
- Vannucchi AM, Lasho TL, Guglielmelli P, et al. Mutations and prognosis in primary myelofibrosis. Leukemia. 2013;27:1861–1869.
- Oon SF, Singh D, Tan TH, et al. Primary myelofibrosis: spectrum of imaging features and disease-related complications. Insights Imaging. 2019;10:71.
- Lewis CM, Pegrum GD. Immune complexes in myeloproliferative disorders. Lancet. 1977;2:1151–1153.
- Cervantes F, Dupriez B, Pereira A, et al. New prognostic scoring system for primary myelofibrosis based on a study of the international working group for myelofibrosis research and treatment. Blood. 2009;113:2895–2901.
- Passamonti F, Cervantes F, Vannucchi AM, et al. A dynamic prognostic model to predict survival in primary myelofibrosis: A study by the IWG-MRT (international working group for myeloproliferative neoplasms research and treatment). Blood. 2010;115:1703–1708.
- Wang JC, Sindhu H, Chen C, et al. Immune derangements in patients with myelofibrosis: the role of Treg, Th17, and sIL2Rα. PLoS ONE. 2015;10:e0116723.
- Tefferi A, Vaidya R, Caramazza D, et al. Circulating interleukin (IL)-8, IL-2R, IL-12, and IL-15 levels are independently prognostic in primary myelofibrosis: a comprehensive cytokine profiling study. J Clin Oncol. 2011;29:1356–1363.
- Vaidya R, Gangat N, Jimma T, et al. Plasma cytokines in polycythemia vera: phenotypic correlates, prognostic relevance, and com-parison with myelofibrosis. Am J Hematol. 2012;87:1003–1005.
- Massa M, Campanelli R, Fois G, et al. Reduced frequency of circulating CD4+CD25brightCD127low FOXP3+ regulatory T cells in primary myelofibrosis. Blood. 2016;128:1660–1662.
- Keohane C, Kordasti S, Seidl T, et al. JAK inhibition induces silencing of T helper cytokine secretion and a profound reduction in T regulatory cells. Br J Haematol. 2015;171:60–73.
- Wilkins BS, Radia D, Woodley C, et al. Resolution of bone marrow fibrosis in a patient receiving JAK1/JAK2 inhibitor treatment with ruxolitinib. Haematologica. 2013;98:1872–1876.
- Zhu YQ, Wu LY. Identification of latent core genes and pathways associated with myelodysplastic syndromes based on integrated bioinformatics analysis. Hematology. 2020;25(1):299–308.
- Aran D, Hu ZC, Butte AJ. Xcell: digitally portraying the tissue cellular heterogeneity landscape. Genome Biol. 2017;18:220.
- Fan YN, Xia JG. Mirnet-functional analysis and visual exploration of mirna-target interactions in a network context. Methods Mol Biol. 2018;1819:215–233.
- Masarova L, Verstovsek S, Kantarjian H, et al. Immunotherapy based approaches in myelofibrosis. Expert Rev Hematol. 2017;10:903–914.
- Jia MF, Zhang H, Wang LN, et al. Identification of mast cells as a candidatesignificant target of immunotherapy for acute myeloid leukemia. Hematology. 2021;26(1):284–294.
- Wang JW, Geiger H, Rudolph KL. Immunoaging induced by hematopoietic stem cell aging. Curr Opin Immunol. 2011;23:532–536.
- Spivak JL. Myeloproliferative neoplasms. N Engl J Med. 2017;376:2168–2181.
- Dobryszycka W. Biological functions of haptoglobin–new pieces to an old puzzle. Eur J Clin Chem Clin Biochem. 1997;35:647–654.
- Langlois MR, Delanghe JR. Biological and clinical significance of haptoglobin polymorphism in human. Clin Chem. 1996;42:1589–1600.
- Masi AD, Simone GD, Ciaccio C, et al. Haptoglobin: from hemoglobin scavenging to human health. Mol Aspects Med. 2020;73:100851.
- Kolarova H, Klinke A, Kremserova S, et al. Myeloperoxidase induces the priming of platelets. Free Radic Biol Med. 2013;61:357–369.
- Klinke A, Nussbaum C, Kubala L, et al. Myeloperoxidase attracts neutrophils by physical forces. Blood. 2011;117:1350–1358.
- Lau D, Mollnau H, Eiserich JP, et al. Myeloperoxidase mediates neutrophil activation by association with CD11b/CD18 integrins. Proc Natl Acad Sci USA. 2005;102:431–436.
- Gorudko IV, Sokolov AV, Shamova EV, et al. Binding of human myeloperoxidase to red blood cells: molecular targets and biophysical consequences at the plasma membrane level. Arch Biochem Biophys. 2016;591:87–97.
- Benson TW, Weintraub NL, Kim HW, et al. A single high-fat meal provokes pathological erythrocyte remodeling and increases myeloperoxidase levels: implications for acute coronary syndrome. Lab Invest. 2018;98:1300–1310.
- Panasenko OM, Gorudko IV, Sokolov AV. Hypochlorous acid as a precursor of free radicals in living systems. Biochemistry. 2013;78:1466–1489.
- Yap YW, Whiteman M, Cheung NS. Chlorinative stress: an under appreciated mediator of neurodegeneration? Cell Signal. 2007;19:219–228.
- Vorchheimer DA, Becker R. Platelets in atherothrombosis. Mayo Clin Proc. 2006;81:59–68.
- Gorudko IV, Sokolov AV, Shamova EV, et al. Myeloperoxidase modulates human platelet aggregation via actin cytoskeleton reorganization and store-operated calcium entry. Biol Open. 2013;2:916–923.
- Mondal S, Adhikari N, Banerjee S, et al. Matrix metalloproteinase-9 (MMP-9) and its inhibitors in cancer: A minireview. Eur J Med Chem. 2020;194:112260.
- Bradley LM, Douglass MF, Chatterjee D, et al. Matrix metalloprotease 9 mediates neutrophil migration into the airways in response to influenza virus-induced toll-like receptor signaling. PLoS Pathog. 2012;8:e1002641.
- Takahashi K. Microbiological, pathological, inflammatory, immunological and molecular biological aspects of periradicular disease. Int Endod J. 1998;31:311–325.
- Reif S, Somech R, Brazovski E, et al. Matrix metalloproteinases 2 and 9 are markers of inflammation but not of the degree of fibrosis in chronic hepatitis C. Digestion. 2005;71:124–130.
- Esparza J, Kruse M, Lee J, et al. MMP-2 null mice exhibit an early onset and severe experimental autoimmune encephalomyelitis due to an increase in MMP-9 expression and activity. FASEB J. 2004;18:1682–1691.
- Halade GV, Jin YF, Lindsey ML. Matrix metalloproteinase (MMP)-9: a proximal biomarker for cardiac remodeling and a distal biomarker for inflammation. Pharmacol Therap. 2013;139:32–40.
- Xu MJ, Bruno E, Chao J, et al. Constitutive mobilization of CD34+ cells into the peripheral blood in idiopathic myelofibrosis may be due to the action of a number of proteases. Blood. 2005;105:4508–4515.
- Jensen MK, Holten-Andersen MN, Riisbro R, et al. Elevated plasma levels of TIMP-1 correlate with plasma suPAR/uPA in patients with chronic myeloproliferative disorders. Eur J Haematol. 2003;71:377–384.
- Yabluchanskiy A, Ma YG, Iyer RP, et al. Matrix metalloproteinase-9: many shades of function in cardiovascular disease. Physiology (Bethesda). 2013;28:391–403.
- Youn MY, Huang HG, Chen C, et al. MMP9 inhibition increases erythropoiesis in RPS14-deficient del(5q) MDS models through suppression of TGF-β pathways. Blood Adv. 2019;3:2751–2763.
- Karacay B, Chang LS. Induction of erythrocyte protein 4.2 gene expression during differentiation of murine erythroleukemia cells. Genomics. 1999;59:6–17.
- Rocca DB, Etchebest C, Guizouarn H. Structural model of the anion exchanger 1 (SLC4A1) and identification of transmembrane segments forming the transport site. J Biol Chem. 2013;288:26372–26384.
- Reithmeier RA, Casey JR, Kalli AC, et al. Band 3, the human red cell chloride/bicarbonate anion exchanger (AE1, SLC4A1), in a structural context. Biochim Biophys Acta. 2016;1858:1507–1532.
- McCranor BJ, Kim MJ, Cruz NM, et al. Interleukin-6 directly impairs the erythroid development of human TF-1 erythroleukemic cells. Blood Cells Mol Dis. 2014;52:126–133.
- Kawamoto S, Kamesaki T, Masutani R, et al. Ectopic expression of band 3 anion transport protein in colorectal cancer revealed in an autoimmune hemolytic anemia patient. Hum Pathol. 2019;83:193–198.
- Kitao A, Kawamoto S, Kurata K, et al. Band 3 ectopic expression in colorectal cancer induces an increase in erythrocyte membrane-bound IgG and may cause immune-related anemia. Int J Hematol. 2020;111:657–666.
- AlFadhli S, Ghanem AA, Nizam R. Genome-wide differential expression reveals candidate genes involved in the pathogenesis of lupus and lupus nephritis. Int J Rheum Dis. 2016;19:55–64.
- Kafina MD, Paw BH. Intracellular iron and hemetrafficking and metabolism in developing erythroblasts. Metallomics. 2017;9:1193–1203.
- Rio S, Gastou M, Karboul N, et al. Regulation of globin-heme balance in diamond- blackfan anemia by HSP70 / GATA1. Blood. 2019;133:1358–1370.
- La P, Oved JH, Ghiaccio V, et al. Mitochondria biogenesis modulates iron-sulfur cluster synthesis to increase cellular iron uptake. DNA Cell Biol. 2020;39:756–765.
- Pellagatti A, Cazzola M, Giagounidis AAN, et al. Gene expression profiles of CD34+ cells in myelodysplastic syndromes: involvement of interferon-stimulated genes and correlation to FAB subtype and karyotype. Blood. 2016;108:337–345.
- Saha D, Patgaonkar M, Shroff A, et al. Hemoglobin expression in nonerythroid cells: novel or ubiquitous? Int J Inflam. 2014;2014:803237.
- Liu L, Zeng M, Stamler JS. Hemoglobin induction in mouse macrophages. Proc Natl Acad Sci USA. 1999;96:6643–6647.
- Dutra FF, Bozza MT. Heme on innate immunity and inflammation. Front Pharm. 2014;5:115.
- Wherry EJ. T cell exhaustion. Nat Immunol. 2011;12:492–499.
- Baseler MW, Burrell R. Purification of haptoglobin and its effects on lymphocyte and alveolar macrophage responses. Inflammation. 1983;7:387–400.
- Xie Y, Li Y, Zhang Q, et al. Haptoglobin is a natural regulator of Langerhans cell function in the skin. J Dermatol Sci. 2000;24:25–37.
- Arredouani M, Matthijs P, Hoeyveld EV, et al. Haptoglobin directly affects T cells and suppresses T helper cell type 2 cytokine release. Immunology. 2003;108:144–151.
- Odobasic D, Kitching AR, Semple TJ, et al. Endogenous myeloperoxidase promotes neutrophil-mediated renal injury, but attenuates T cell immunity inducing crescentic glomerulonephritis. J Am Soc Nephrol. 2007;18:760–770.
- Brennan M, Gaur A, Pahuja A, et al. Mice lacking myeloperoxidase are more susceptible to experimental autoimmune encephalomyelitis. J Neuroimmunol. 2001;112:97–105.
- Odobasic D, Kitching AR, Yang Y, et al. Neutrophil myeloperoxidase regulates T-cell-driven tissue inflammation in mice by inhibiting dendritic cell function. Blood. 2013;121:4195–4204.
- Heissig B, Hattori K, Dias S, et al. Recruitment of stem and progenitor cells from the bone marrow niche requires MMP-9 mediated release of kit-ligand. Cell. 2002;109:625–637.
- Qi X, Jiang HJ, Liu P, et al. Increased myeloid-derived suppressor cells in patients with myelodysplastic syndromes suppress CD8+ T lymphocyte function through the STAT3-ARG1 pathway. Leuk Lymphoma. 2020;26:1–6.
- Lu SL, Yadav A K, Qiao XH. Identification of potential miRNA-mRNA interaction network in bone marrow T cells of acquired aplastic anemia. Hematology. 2020;25:168–175.
- Kim NH, Kim HS, Kim NG, et al. P53 and MicroRNA-34 are suppressors of canonical Wnt signaling. Sci Signal. 2011;4:ra71.