
ABSTRACT
Objectives
The objective of the current study was to investigate the relationship between changes in vital signs and intensive care unit (ICU) admission. Windsor Regional Hospital treats 15–20 new patients a year with acute leukemia. These patients are at increased risk of neutropenic fevers and admission to the ICU following induction chemotherapy.
Methods
Retrospective review examined the correlation between acute leukemia patient vitals and ICU admission. The analysis included 37 patients: 7 ICU versus 30 controls. Changes were compared to baseline over 24 hours prior to ICU admission or 5 days after the initiation of induction chemotherapy in the following vital signs: heart rate (HR), mean arterial pressure (MAP), temperature (T), respiratory rate (RR), and fraction of inspired oxygen (FiO2) required to maintain a stable oxygen saturation.
Results
RR and FiO2 demonstrated significant change over baseline leading up to ICU admission within the ICU group. T, HR and MAP did not demonstrate significant changes over time in either group. RR, FiO2 and HR were significantly higher in the ICU group at time zero compared with the control group. RR was recorded least frequently in the 24 hours leading up to ICU admission.
Discussion
Changes in RR and FiO2 predicted clinical deterioration requiring ICU admission in acute leukemia patients. This is consistent with the predominant reason for ICU admission which was respiratory failure.
Conclusion
We present preliminary evidence to support enhanced monitoring of RR and FiO2 in acute leukemia patients following induction chemotherapy with early intervention if identified.
Introduction
Acute leukemia, including acute myeloid leukemia (AML) and acute lymphoblastic leukemia (ALL), is a cancer of the hematopoietic cells that is characterized by an increased number of immature blood cells and decreased production of blood components [Citation1]. Patients with acute leukemia are treated with curative-intent, aggressive chemotherapy that requires inpatient monitoring for an average of 28 days following initial induction chemotherapy. These patients experience transfusion dependent anemia, thrombocytopenia and life-threatening neutropenia. While younger patients tend to have a better prognosis, for patients over the age of 65, about 70% will die within one year of diagnosis [Citation2].
Windsor Regional Hospital, a comprehensive acute leukemia treatment center in Ontario, Canada, treats 15-20 patients with acute leukemia per year. Chemotherapy treatment consists of two phases: induction and consolidation therapy. Close monitoring of patients during induction therapy is required due to potential complications of neutropenic sepsis and respiratory failure. Therefore, patients undergoing acute leukemia treatment are admitted to the hospital and typically receive induction chemotherapy within 5-7 days of diagnosis. The standard induction regimen most often includes daunorubicin for 3 days with continuous infusion of cytarabine for 7 days, known as 3 + 7 [Citation1]. After induction therapy, patients remain in the hospital for approximately four weeks for supportive care until their blood counts recover.
Despite inpatient monitoring, mortality in patients initially treated for acute leukemia, specifically AML, can be as high as 60% depending on patient factors, such as age, comorbidities and performance status, and disease factors such as cytogenetics [Citation3,Citation4]. Complications such as neutropenic sepsis, respiratory dysfunction, and multi-organ failure can result in admission to the intensive care unit (ICU) and eventually death. In a study of 83 AML patients admitted to the ICU, greater than one half were admitted during induction chemotherapy [Citation5].
Currently, patients undergoing induction chemotherapy are managed in the hospital. However, there is increasing evidence suggesting that outpatient management might provide more benefits to quality of life, decreased infection risk and less cost to the healthcare system [Citation6–8]. In Ontario, induction chemotherapy treatment for acute leukemia patients costs the healthcare system approximately $1500 per day with an average total cost per patient of $36,688, and an average length of stay of 23.4 days [Citation9]. During this time, patients are monitored, and vitals are taken every four to twelve hours by nursing staff. If a patient is admitted to the ICU, the average cost per day increases to $3000 per patient [Citation10].
Studies have shown ICU survival rates of 32-66%, and one-year survival post-ICU of 16-56% in acute leukemia patients [Citation5,Citation11,Citation12]. This variability is likely due to differences in patient characteristics and differing inclusion criteria between the studies. One study reported after an ICU stay, 80% of patients with hematologic malignancy (including acute leukemia) maintained a good to excellent health-related quality of life, and 80% were able to maintain the same therapeutic intensity of their cancer treatment regimen, and were in partial or complete remission [Citation13]. Therefore, acute leukemia patients can benefit significantly from ICU admission.
However, multiple sources have demonstrated that acute leukemia patients who do not require ICU admission have better outcomes than those who do [Citation11]. Factors associated with poor ICU outcomes in acute leukemia patients include older age, requiring mechanical ventilation, receiving a bone marrow transplant (BMT) preparatory regimen, increased Simplified Acute Physiology Score (SAPS) II, increased Sequential Organ Failure Assessment (SOFA) score, and increased Acute Physiologic Assessment and Chronic Health Evaluation (APACHE) II score [Citation5,Citation11,Citation12,Citation14]. Conversely, studies have shown if patients with acute leukemia or hematological malignancy are admitted to the ICU earlier, defined as within 24 hours of hospital admission or without immediate life support, they have better outcomes [Citation13,Citation15]. Worse outcomes in patients admitted to the ICU later is likely due to more significant changes in physiological variables [Citation16,Citation17]. Therefore, determining the correlation between patients’ vitals and admission to the ICU would show if frequent monitoring of vital signs and early intervention to manage changes would lead to better patient outcomes. Additionally, frequent and accurate monitoring of vital signs and its relationship to ICU admission in acute leukemia patients is important in understanding ICU admission patterns.
To determine if there is a correlation between vital sign changes and patient admission to the ICU, we reviewed acute leukemia cases at our site spanning the years 2015-2017. The specific aim of this study was to determine which vital sign changes from baseline are associated with ICU admission of acute leukemia patients during the induction phase of chemotherapy.
Methods
Study design and population
A retrospective chart review was conducted of all adult patients (≥ 18 years of age) diagnosed with acute leukemia between 1 January 2015 to 31 December 2017 from the Windsor-Essex region.
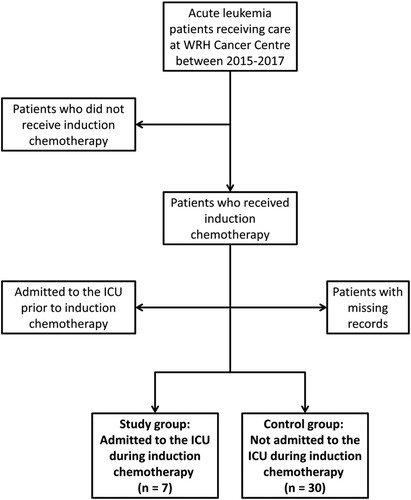
Acute leukemia patients were categorized into ICU and control groups. Patients were included in the ICU group if they were admitted to the ICU during their induction chemotherapy (). Patients were excluded from this group if they had been admitted to the ICU prior to beginning induction chemotherapy. The control group consisted of patients who had undergone induction chemotherapy and were not admitted to the ICU during or after their treatment. Any patients with partially missing records or who did not undergo induction chemotherapy were excluded from the study.
Figure 1. Inclusion and Exclusion Criteria. We reviewed the medical records of 61 patients diagnosed with acute myeloid leukemia in the years 2015-2017 treated at Windsor Regional Hospital (WRH). Patients were included in the study if they received induction chemotherapy, and were either admitted to the Intensive Care Unit (ICU) during induction chemotherapy (ICU group) or were not (control group). Patients were excluded if they did not receive induction chemotherapy, if they were admitted to the ICU prior to initiation of induction chemotherapy, and if there were missing records.
This study was approved by the Windsor Regional Hospital Research Ethics Board.
Data analysis
For the ICU group, vital signs were analyzed during the 24 hours prior to the patient’s admission to the ICU. For the control group, the 24-hour period leading up to midnight of the fifth day after induction chemotherapy initiation (5 days post-induction) was used for comparison. This time period was chosen for comparison as patients in the ICU group were admitted to the ICU an average of 5 days post-induction chemotherapy initiation. The 24-hour period was chosen for analyzing patient vitals prior to ICU admission as these patients demonstrated an acute decline in clinical status prior to ICU admission. This window of time was chosen to allow us to capture these acute deteriorations.
Reason for ICU admission was reported as percentages. An unpaired T-test was done to compare the frequency of vitals recorded over the respective 24-hour period in both groups. A one-way ANOVA test was done to compare the proportion of isolated missed vitals within the ICU group in the 24 hours prior to ICU admission.
Temperature (T), mean arterial pressure (MAP), respiratory rate (RR), heart rate (HR) and fraction of inspired oxygen (FiO2) were analyzed and graphed over 24 hours in both groups. Mean arterial pressure was calculated from standard systolic and diastolic blood pressure (BP) measurements as follows: MAP = [systolic + 2(diastolic)]/3. Fraction of inspired oxygen was used to study the amount of oxygen delivered to patients in order to maintain their oxygen saturation (O2Sat) within normal range.
The dataset of vital signs over time falls in the framework of longitudinal repeated measures data. To analyze the data, we used linear mixed models, which take into account the variations between and within subjects as well as the differential frequency of measuring vitals in different patients. According to the linear mixed models, vital signs were individually analyzed as functions of time and a group variable. If a patient was admitted to the ICU, ICU=1; otherwise ICU=0. This data analysis was performed using lme4 and lmerTest packages in R statistical analysis software [Citation18]. Therefore, vital signs were analyzed within each group to identify if there were any significant changes from baseline over 24 hours, and also analyzed between groups to identify any significant differences at time zero. Time zero is defined as the time of ICU admission in the ICU group, and midnight of day 5 post-induction in the control group.
Results
Patient characteristics
We reviewed the medical records of 61 acute leukemia patients. Of the 37 included patients, 7 patients were admitted to the ICU during induction chemotherapy, and 30 patients completed induction chemotherapy without an ICU admission. Five (71%) of the ICU patients had a diagnosis of AML, and 2 (29%) had a diagnosis of acute promyelocytic leukemia (APL), a type of AML. Twenty-five (83%) of the control patients had a diagnosis of AML, 1 (3%) had a diagnosis of APL, 3 (10%) had a diagnosis of ALL, and 1 (3%) had undifferentiated acute leukemia. In the ICU group 4 (57%) had a favorable risk stratification by genetics, and in the control group 10 (33%) were favorable [Citation19]. The mean age at diagnosis of the ICU group was 51 years (median 49 years), and the mean age at diagnosis of the control group was 63 (median 66 years). Statistically, there was no significant age difference between the two groups (p=0.07). Six (87%) of the ICU patients were female, and 14 (47%) of the control patients were female. The median Charlson score was 3 (ranging from 2-6) for the ICU group, and 5 (ranging from 2-8) for the control group. The median number of days patients spent in the ICU was 11, ranging from 1 to 27. Four (57%) of the ICU patients died in the ICU during their admission for induction chemotherapy, and two (7%) of the control patients died during their hospital admission for induction chemotherapy. Detailed patient characteristics are shown in and Appendix1.
Table 1. Patient characteristics for ICU and control groups.
Reason for ICU admission
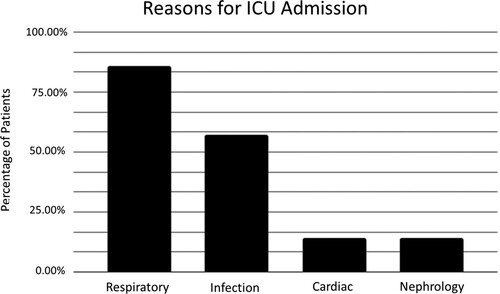
We examined the ICU records and progress notes of the ICU group. Reason for ICU admission was interpreted based on these records (). In some instances, there were multiple reasons for admission listed. 85.71% of patients were admitted for respiratory failure, 57.14% were admitted due to infection, 14.29% were admitted for cardiac arrest, and 14.29% were admitted for acute kidney injury. Out of 6 patients admitted for respiratory failure, four were secondary to infection, one was secondary to all-trans retinoic acid (ATRA) syndrome, and one did not have any underlying cause listed.
Figure 2. Reasons for ICU Admission: Cause for Intensive Care Unit (ICU) admission was interpreted based on ICU records; in some patients multiple reasons for admission were listed. ICU admission was predominantly related to respiratory failure.
Frequency of recorded vitals
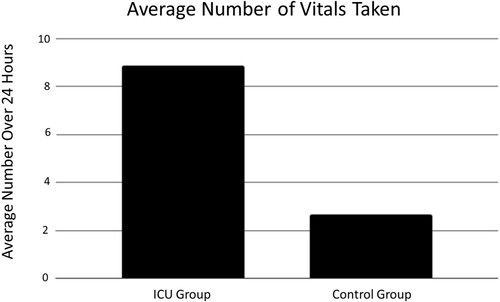
The comparison of the frequency of recorded vitals between the two groups was performed using a T-test (). The average number of vitals recorded in the ICU group in the 24 hours before ICU admission was 8.86, and the average number of vitals recorded in the control group in the 24 hours 5 days post-induction was 2.67. There was no significant difference between the two groups (p = 0.07).
Figure 3. Average Number of Vitals Taken: There is no significant difference in the average number of times vital signs were taken over the 24 hour study period between the Intensive Care Unit (ICU) group and the control group (p = 0.07).
Isolated missed vitals
If a set of vitals at a specific timepoint was missing one or more of the standard vital signs (T, BP, RR, HR, O2Sat), the missing vital signs were considered to be ‘isolated missed vital signs’. In patients of the ICU group, we compared the number of times each vital sign was missed to the total number of vitals taken and reported it as a percentage (). The average percentage of isolated missed vital signs are as follows: BP, 16.8%, RR, 26.0%, HR, 19.3%, O2Sat, 15.2% and T, 43.6%. Temperature was excluded from graphing and statistical analysis as it is not recorded on ICU consult forms, which were used for documentation in at least three patients. Therefore, it artificially inflated the number of missed temperature readings. While the difference was not statistically significant [F(3, 24) = 0.23, p = 0.87], RR was recorded the least number of times during the 24 hours before ICU admission when compared to HR, BP and O2Sat ().
Figure 4. Isolated Missed Vital Signs: ‘Isolated missed vital signs’ refers to instances where a set of vitals taken at a certain point in time was missing one or more of the standard vital signs (blood pressure, heart rate, respiratory rate, oxygen saturation). Temperature was excluded from this analysis as it is not recorded on Intensive Care Unit (ICU) consult forms. Respiratory rate was recorded the least during 24 hours leading up to ICU admission, though this was not statistically significant (p = 0.87).
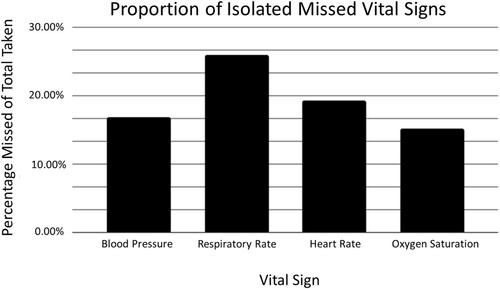
Table 2. Results of One-way ANOVA test, comparing the proportion of isolated missed vital signs for blood pressure (BP), respiratory rate (RR), heart rate (HR), and oxygen saturation (O2Sat).
Changes in vital signs
During the 24 hours before ICU admission, RR and FiO2 demonstrated considerable change from baseline within the ICU group in comparison with T, BP, and HR ( and ). This change was not observed in the control group.
Figure 5. Patient Vitals Over 24 Hours: Patient temperature (A), mean arterial pressure (MAP) (B), heart rate (C), respiratory rate (RR) (D) and fraction of inspired oxygen (FiO2) (E) as measured during the 24 hours prior to Intensive Care Unit (ICU) admission or 5 days post-induction chemotherapy initiation. Increases in RR (D) and FiO2 (E) occur in the 24 hours prior to ICU admission, but are not observed in the control group. Each line corresponds to a single patient, and each point corresponds to when the respective vital sign was checked by nursing staff. Control group, n = 30, ICU group, n = 7.
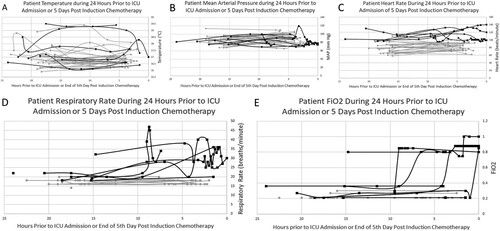
Figure 6. Changes in Vital Signs Over Time: Fraction of inspired oxygen (FiO2) (A) and respiratory rate (RR) (B) show significant increases from baseline over 24 hours prior to Intensive Care Unit (ICU) admission within the ICU group. Changes in heart rate (HR) (C) over the same time period is not significant within the ICU group. However, there were significant differences in FiO2 (A), RR (B) and HR (C) between the ICU group and control group at time zero (p<0.0001). Time zero is defined as the time of ICU admission in the ICU group, or midnight on day 5 post-induction chemotherapy initiation in the control group.
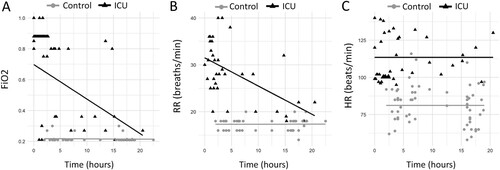
Fraction of inspired oxygen demonstrated significant increases from baseline over time leading up to ICU admission within the ICU group (E, A). For every hour closer to ICU admission, FiO2 would increase 0.023 units on average (95% CI: 0.017 - 0.029). Changes from baseline in FiO2 over time were not significant in the control group (p = 0.946). The difference in FiO2 between ICU and control groups at time zero was 0.33 (95% CI: 0.23 - 0.43, p < 0.0001).
Similar results were observed in RR measurements (D, B). In the ICU group, for every hour closer to ICU admission time, RR increased an average of 0.60 breaths per minute (95% CI: 0.62 - 0.58). In control patients, there was no significant change in RR over time. The difference in RR between ICU and control groups at time zero was 14.20 breaths per minute (95% CI: 11.82 -16.58, p < 0.0001).
While there was no significant change from baseline over time in HR within the ICU group (p > 0.12) or control group, there was a significant difference between the two groups at time zero (C, C). The difference in average HR between the two groups at the time of admission was 31 beats per minute (95% CI: 18.01 - 43.99, p < 0.00008).
There were no significant changes from baseline in MAP or T over time in either group, and there was no significant difference in MAP or T between the two groups at time zero. Neither was clinically predictive of decline or ICU admission (A and B).
Discussion
In the current retrospective study, we observed that changes in RR and FiO2 are the most predictive vital signs for ICU admission in acute leukemia patients during induction chemotherapy. The significant changes over baseline and increased value at the time of ICU admission in FiO2 and RR are essential for informing patient care, including more frequent monitoring of these vitals when changes over baseline are first noticed, followed by timely intervention. Literature reviews showed that there was minimal previous research on the predictive value of recorded vital signs in acute leukemia patients. Respiratory events in general and specifically RR > 25 breaths/minute was previously found to be predictive of death by day 45 post treatment in acute leukemia patients [Citation20]. These respiratory events can occur in >80% of patients within 10 days if they have a diagnosis of AML [Citation21].
Due to the high mortality associated with AML specifically, monitoring vital signs that could predict if a patient will require ICU admission is imperative. This frequent vitals monitoring is particularly important as a previous study has shown that AML patients have better outcomes when they are admitted to the ICU earlier due to complications of treatment [Citation15]. A study conducted on patients with hematologic malignancy, where AML patients made up 27% of their study population, showed significantly higher ICU survival if patients are admitted to the ICU within 24 hours of hospital admission [Citation13]. Other studies have shown that admission to the ICU for acute respiratory failure was not significantly associated with a poor outcome, though this may have been due to the selection criteria of the study or use of non-invasive mechanical ventilation as a first-line ventilation support [Citation20]. However, previous studies have shown that 47-54% of acute leukemia patients admitted to the ICU required intubation [Citation5,Citation12] and 5% required tracheostomy, indicating invasive mechanical ventilation is a common requirement amongst this patient population [Citation12]. This is important to note, as invasive mechanical ventilation has been shown to be associated with increased ICU mortality in acute leukemia patients [Citation5,Citation12,Citation14] and patients with hematologic malignancy [Citation13,Citation17]. Consequently, if invasive mechanical ventilation is avoided, ICU mortality is decreased [Citation5,Citation12].
Interestingly, RR was the most frequent isolated missed vital sign over the 24 hours prior to ICU admission in the ICU group compared to heart rate, blood pressure and oxygen saturation. Respiratory rate is a difficult vital sign to measure, as it requires a healthcare provider to watch for chest expansion and manually count the number of breaths over 10-15 seconds. Respiratory rate measurement is time consuming and labor-intensive compared to other vitals monitored electronically such as BP, HR and O2Sat. These differences in measuring RR may account for why it is missed more frequently. The fact that RR is manually measured as opposed to electronically also introduces increased risk for human error. However, the data presented in this study suggest that RR is an essential vital sign to monitor in the acute leukemia, specifically AML, patient population.
Respiratory failure was the most common reason for admission to the ICU in this patient population, compared to fever, cardiac, or renal causes. Previous studies agreed that one of the most frequent reasons for ICU admission in acute leukemia patients was respiratory dysfunction, accounting for between 31-82% of admissions depending on the study [Citation5,Citation11,Citation12,Citation21,Citation22]. Another study showed approximately 9% of newly diagnosed AML patients developed Acute Respiratory Distress Syndrome (ARDS) within their first 15 days of admission [Citation23]. This fits with the picture that RR and FiO2 are the most predictive vital signs in determining the likelihood of a patient needing to be admitted to the ICU. Therefore, it shows that increased attention should be paid to monitoring respiratory rate and oxygen needs in acute leukemia patients during induction chemotherapy.
Acute leukemia patients admitted to the ICU were shown to have a persistently elevated HR in the 24 hours before ICU admission. This leads us to consider closer monitoring of this patient population. Underlying comorbidities may be a cause of this finding, but further research is warranted to investigate why patients in the ICU group consistently have a higher HR at baseline.
Based on vital sign analysis, temperature was well monitored by nurses on the inpatient floor. In the 24 hours prior to ICU admission or 5-day post-induction in the control group, there appeared to be no difference in temperature between groups. Though patients from both groups would occasionally have fevers throughout their inpatient stay, these fevers seemed to be identified and treated quickly, with patient temperature often varying dramatically between time points.
Limitations
One of the main limitations of this study is the small population of acute leukemia patients treated at our site, a community hospital with lower patient volumes. This led to an even smaller sample size after exclusion. This small sample size may reduce the validity of the statistical analysis, and allow limited transferability of these results to other patient populations or healthcare facilities. Additionally, as this is a single center study conducted in Windsor-Essex County, lifestyle and demographic factors specific to this region could influence results. However, for the purposes of quality improvement in the care of this specific patient population, the results suggest that there is clinical significance in changes in FiO2 and RR.
Possible confounding variables include comorbidities such as diabetes, chronic obstructive pulmonary disease (COPD), obesity, and hypertension, and lifestyle choices, such as smoking and alcohol use. Comorbidities within the two groups were not compared in this study due to lack of standardized reporting and access to health information. However, patients with these conditions or risk factors may be more likely to deteriorate clinically with inferior outcomes, and their vital signs predictive of ICU admission could be related to those underlying conditions. Respiratory events as defined by one study occurred more often in patients with a smoking history or previous lung disease [Citation20,Citation24]. Comorbidities specifically linked to increased risk of ICU admission were cerebrovascular, hepatic and lung disease [Citation24]. Increased number of comorbidities elevated the risk of ICU admission [Citation24].
Patients would have also received a variety of medications while in hospital in addition to chemotherapy, including antibiotics, analgesics, or medications related to comorbidities. These treatments could also impact a patient’s overall condition and whether they require intensive care. For example, the use of vasopressors is related to poor ICU outcomes [Citation11,Citation14].
Future data analysis
Vital signs could be analyzed and graphed for a more extended time period prior to ICU admission. In particular, an extended analysis could provide additional information regarding HR, as it is significantly elevated in the ICU group at the time of ICU admission but did not show a significant increase over time within the 24-hour time period analyzed in this study. As discussed above, there may be specific comorbidities or underlying health conditions that put some acute leukemia patients at higher risk for admission to the ICU. It may be beneficial to analyze comorbidities and the reason for admission to the ICU in more detail in order to identify higher risk patient populations for ICU admission. These patients may need closer monitoring for signs indicative of intensive care requirements. To further understand health outcomes in this patient population, future studies could extend the monitoring time period to allow for assessment of course in ICU and overall survival as they relate to changes in vital signs.
Quality improvement and future studies
Based on current findings, we have instituted a change in protocol for acute leukemia patients who have early signs of respiratory distress, such as requiring oxygen or demonstrating increased respiratory rate. These patients will receive urgent respirology and infectious disease consultation when applicable, urgent CT scans if deemed necessary, and close monitoring. Investigating alternative etiologies of respiratory failure will also be necessary. Alternate causes of respiratory distress such as drug-induced pneumonitis from cytarabine and resistant microbial infection requiring broad spectrum therapy will be considered. We expect that these interventions will improve outcomes for acute leukemia patients. As well, patients with a consistently high heart rate will need closer monitoring and cardiology and/or pulmonary consultation.
Healthcare providers should be aware of the importance of accurate RR measurement and recording in this patient population. To assist healthcare providers in recording RR frequently and accurately, education about its importance and ensuring presence of analog clocks in hospital rooms must be implemented. The development of novel methodologies for more accurate and practical measurements of RR will decrease potential for human error and allow for RR measurements to be more standardized like other vital signs monitored electronically.
Conclusions
Respiratory rate and FiO2 increases over baseline within 24 hours prior to ICU admission were statistically significant, suggesting that changes in these vital signs are the most predictive of ICU admission in acute leukemia patients receiving induction chemotherapy. Therefore, these vital signs should be monitored frequently and accurately in this population so early intervention is instituted prior to clinical deterioration. Protocols should require urgent respirology and, when applicable, infectious disease consultation, for patients with changes to RR or FiO2 from baseline. This information will be necessary for the improved outcome in these patients being treated with curative intent.
Declarations
Ethics approval and consent to participate
Ethics approval for this research was obtained from the Windsor Regional Hospital Ethics Board. Consent to participate in research consisting of chart reviews is obtained from all Windsor Regional Hospital Cancer Centre patients at intake.
Availability of data and material
The datasets generated and analyzed during the current study are available from the corresponding author on reasonable request.
Acknowledgement
KM and AS collected, analyzed and interpreted the patient data in this retrospective chart review, they were both major contributors to writing the manuscript. AH conducted statistical analysis of the data. DM was a contributor to writing and editing the manuscript. IW and CH determined the study design and contributed to editing the manuscript. All the authors read and approved the final manuscript.
Disclosure statement
No potential conflict of interest was reported by the author(s).
Additional information
Funding
References
- Ferrara F, Schiffer CA. Acute myeloid leukaemia in adults. The Lancet. 2013 Feb: 381(9865):484–495.
- Meyers J, Yu Y, Kaye JA, et al. Medicare fee-for-service enrollees with primary acute myeloid leukemia: An analysis of treatment patterns, survival, and healthcare resource utilization and costs. Appl Health Econ Health Policy. 2013 Jun 1;11(3):275–286.
- Garcia JB, Lei X, Wierda W, et al. Pneumonia during remission induction chemotherapy in patients with acute leukemia. Ann Am Thorac Soc. 2013 Oct;10(5):432–440.
- De Kouchkovsky I, Abdul-Hay M. Acute myeloid leukemia: a comprehensive review and 2016 update. Blood Cancer J. 2016 Jul;6(7):e441.
- Rabbat A, Chaoui D, Montani D, et al. Prognosis of patients with acute myeloid leukaemia admitted to intensive care. Br J Haematol. 2005;129(3):350–357.
- El-Jawahri A, Traeger L, Kuzmuk K, et al. Quality of life and Mood of patients and family caregivers during hospitalization for hematopoietic stem cell transplantation. Cancer. 2015 Mar 15;121(6):951–959.
- Vaughn JE, Buckley SA, Walter RB. Outpatient care of patients with acute myeloid leukemia: benefits, barriers, and future considerations. Leuk Res. 2016;45:53–58.
- Walter RB, Taylor LR, Gardner KM, et al. Outpatient management following Intensive induction or salvage chemotherapy for acute myeloid leukemia. Clin Adv Hematol Oncol HO. 2013;11(9):571–577.
- Canadian Institute for Health Information. Blood and lymphatic system: Acute Myeloid Leukemia [Internet]. CIHI Patient Cost Estimator. 2019 [cited 2020 Feb 22]. Available from: https://www.cihi.ca/en/patient-cost-estimator.
- Canadian Institute for Health Information. Care in Canadian ICUs. Ottawa, ON: CIHI; 2016 Aug p. 36.
- Thakkar SG, Fu AZ, Sweetenham JW, et al. Survival and predictors of outcome in patients with acute leukemia admitted to the intensive care unit. Cancer. 2008;112(10):2233–2240.
- Kraguljac AP, Croucher D, Christian M, et al. Outcomes and predictors of mortality for patients with acute leukemia admitted to the Intensive Care unit. Can Respir J [Internet. 2016;2016, Available from: https://www.ncbi.nlm.nih.gov/pmc/articles/PMC4944052/.
- Azoulay E, Mokart D, Pène F, et al. Outcomes of critically Ill patients With hematologic malignancies: prospective multicenter data from France and Belgium—A groupe de recherche respiratoire en réanimation onco-hématologique study. J Clin Oncol. 2013 Jun 10;31(22):2810–2818.
- Rabe C, Mey U, Paashaus M, et al. Outcome of patients with acute myeloid leukemia and pulmonary infiltrates requiring invasive mechanical ventilation—a retrospective analysis. J Crit Care. 2004 Mar 1;19(1):29–35.
- Lengliné E, Raffoux E, Lemiale V, et al. Intensive care unit management of patients with newly diagnosed acute myeloid leukemia with no organ failure. Leuk Lymphoma. 2012 Jul 1;53(7):1352–1359.
- Mcdowall K, Hart A, Cadamy A. The outcomes of adult patients with haematological malignancy requiring admission to the Intensive Care unit. J Intensive Care Soc. 2011 Apr 1;12:112–125.
- Verplancke T, Van Looy S, Benoit D, et al. Support vector machine versus logistic regression modeling for prediction of hospital mortality in critically ill patients with haematological malignancies. BMC Med Inform Decis Mak. 2008 Dec 5;8(56).
- R Core Team. R: a language and enivronment for statistical computing [Internet]. Vienna, Austria: R Foundation for Statistical Computing; 2020. Available from: http://www.R-project.org/.
- Döhner H, Estey E, Grimwade D, et al. Diagnosis and management of AML in adults: 2017 ELN recommendations from an international expert panel. Blood. 2017 Jan 26;129(4):424–447.
- Chaoui D, Legrand O, Roche N, et al. Incidence and prognostic value of respiratory events in acute leukemia. Leukemia. 2004 Apr;18(4):670–675.
- Moreau A-S, Lengline E, Seguin A, et al. Respiratory events at the earliest phase of acute myeloid leukemia. Leuk Lymphoma. 2014 Nov;55(11):2556–2563.
- Jackson K, Mollee P, Morris K, et al. Outcomes and prognostic factors for patients with acute myeloid leukemia admitted to the intensive care unit. Leuk Lymphoma. 2014 Jan;55(1):97–104.
- Van de Louw A, Desai RJ, Zhu J, et al. Characteristics of early acute respiratory distress syndrome in newly diagnosed acute myeloid leukemia. Leuk Lymphoma. 2018;59(10):2369–2376.
- Halpern AB, Culakova E, Walter RB, et al. Risk factors, mortality, and care Costs of adults with acute myeloid leukemia admitted to the Intensive Care Unit: A longitudinal cohort study. JAMA Oncol. 2017 Mar 1;3(3):374–381.