
ABSTRACT
Objective
Hypoxia is emerging as a key factor in the biology of leukaemia. Here, we want to clarify the impact of hypoxia on the proliferation of T-cell acute lymphoblastic leukaemia (T-ALL) cells and the response to chemotherapy.
Methods
T-ALL cells were cultured under normoxic and hypoxic conditions. MTT assay and trypan blue staining technique was used to detect cell viability and proliferation. In vitro sensitivity to glucocorticoid was assessed by IC50. CDI was used to analyze the combined effects of glucocorticoid and hypoxia. Flow cytometry was performed to detect apoptosis and cell cycle. Western blotting was performed to detect the protein expression associated with hypoxia.
Results
Hypoxia of 1% O2 resulted different impact on cell viability and proliferation to different T-ALL cell lines, reduced, unaffected or induced, according to their different metabolic phenotype. All the cell lines showed an induction of key enzymes in glycolysis pathway following hypoxia exposure, although different effector proteins were induced in different cell lines. In GC-sensitive cells, acute hypoxia made no effect on the IC50 of dexamethasone, but chronic hypoxia may improve cell survival and induce GC resistance. However, acute hypoxia induced a higher GC resistance in GC-resistant T-ALL cells and showed an antagonistic effect while combined with high-dose dexamethasone.
Conclusion
T-ALL cells adapt well to hypoxic environment. Hypoxia may influence leukaemic cell proliferation. More importantly, hypoxia contributes to GC resistance in T-ALL blasts, especially in refractory/relapsed T-ALL.
1. Introduction
Acute lymphoblastic leukaemia (ALL) is the most common malignancy in children [Citation1]. Significant efforts have been made in the management of ALL over the past 50 years, especially in pediatric ALL, resulting in the increase of 5-year survival rates from 10% to approximately 90%, whilst outcomes for T-cell ALL (T-ALL) are still lagging behind by 5∼10% [Citation2]. T-ALL comprises about 15% of ALL in children, which is more common in older adolescents, and 25% in adults. The principal cause of treatment failure in ALL is chemoresistance, especially resistance to glucocorticoids (GCs) [Citation3–5]. GCs, including dexamethasone (Dex) and prednisolone, is the first line drug introduced in the treatment of ALL over 70 years ago and have remained essential components of all current treatment regimens for ALL and other lymphoid malignancies ever since [Citation6]. In addition, GC resistance is more common than resistance to other chemotherapies at relapse [Citation7,Citation8]. T-ALL blasts are generally more resistant to conventional chemotherapeutic drugs than B-ALL blasts [Citation2].
The role of hypoxia in promoting stemness and resistance to chemotherapy and increasing tumour invasiveness has been widely studied in solid tumours including breast cancer, lung cancer, liver cancer and colon cancer [Citation9–11]. In 2014, direct in-vivo measurements revealed a quite low oxygen tension in the bone marrow (BM) of live mice with the lowest (1.3%) oxygen tension in deeper peri-sinusoidal regions [Citation12]. Hypoxia or low oxygen tension is usually present in the BM microenvironment [Citation13–15]. Leukaemic cells originate from hypoxic BM, which not only provides survival signals, but also stimulates leukaemic cells per se to express specific genes to adapt hypoxia and confers resistance to chemotherapy [Citation14–17]. Taking advantage of this feature, we constructed a novel and convenient method to establish GC-resistant ALL cell lines from GC-sensitive ALL cells by mimicking the hypoxic BM microenvironment [Citation18]. Compared to the traditional methods, such as dose-escalation continuous exposure and high-concentration pulsatile exposure [Citation19,Citation20], the novel method has a high success rate, a single drug exposure, a short duration (5∼6 weeks) and a long maintenance of resistant phenotype without drug re-induction [Citation18]. The results suggest that hypoxic condition plays a key role in the chemoresistance in T-ALL cells.
Given its central role in tumour progression and resistance to therapy, tumour hypoxia might well be considered the best-validated target that has yet to be exploited in solid tumours [Citation11,Citation21,Citation22]. Studying the significance of hypoxia in hematological malignancies has been slowed by the lack of reliable methods to measure O2 levels in BM. Moreover, leukaemic cells are originated from the hypoxic BM, which may lead to diverse adaptation ways to hypoxia different from the ways of solid tumour cells. So far, few studies have focused on the role of hypoxia on refractory/relapsed T-ALL. To obtain more insight into the application of targeting hypoxia in T-ALL, we investigated the impact of hypoxic vs. normoxic conditions on the proliferation of T-ALL cell lines and on the sensitivity to GC.
2. Materials and methods
2.1. Cell lines and culture conditions
CEM-C7 (GC-sensitive) and CEM-C1 (GC-resistant) cell lines were subcloned from the CCRF-CEM cell line [Citation23], which was established from a patient with T-ALL [Citation24]. The two cell lines were kindly provided by Dr. Thompson (The University of Texas Medical Branch). Molt-4 (GC-resistant) cell line was kindly provided by Dr. Stephan W. Morris (St. Jude Children’s Research Hospital). Jurkat (GC-resistant) cell line was purchased from the Shanghai Institute Cell Source Bank. All cell lines were maintained in RPMI 1640 (HyClone, Logan, UT, USA) supplemented with 10% fetal bovine serum (FBS; HyClone) at 37°C under a humidified atmosphere with 5% carbon dioxide (CO2) and 21% oxygen (O2; normoxic condition). Hypoxic condition was constructed using a tri-gas CO2 incubator (Thermo Fisher, Carlsbad, CA, USA) with a 5% CO2 and 1% O2 atmosphere.
2.2. Reagents and antibodies
Propidium iodide (PI), trypan blue and 3-(4,5-dimethylthiazol-2-yl)-2,5-diphenyltetrazolium bromide (MTT) were purchased from Sigma (Sigma-Aldrich, St. Louis, MO, USA). Dex (Sigma) was dissolved in ethanol and used at a concentration of 0.001∼50 µM. The final concentration of ethanol in the medium was 0.0001∼0.01%, at which cell growth was not obviously altered. The Annexin V-PI Kit was purchased from Roche (Mannheim, Germany). Antibodies to HKII, PKM2, LDHA, p-LDHA (Tyr10), GAPDH, AMPK, p-AMPK (Thr172), Beclin-1, LC3, GRP78 and PERK, were purchased from Cell Signaling Technology (Beverly, MA, USA). Horseradish peroxidase (HRP)–conjugated donkey anti-rabbit antibody and HRP-conjugated sheep anti-mouse antibodies were obtained from Santa Cruz Biotech (Santa Cruz, CA, USA). The β-Actin antibody was obtained from Kangchen Bio-Tech (Shanghai, China).
2.3. Cell growth and viability assay
Viable cells were counted using trypan blue staining. Cell viability was evaluated by MTT assay, which was performed as described previously [Citation18]. Briefly, cells were seeded in 96-well plates. Next, 0.5 mM MTT (final concentration) was added to each well for 4 h at 37°C. Then, solubilization buffer (10% SDS in 0.01 M HCl) was added to each well, and the plates were further incubated for 24 h at 37°C. The spectrophotometric absorbance was measured at 570 nm (reference 690 nm) using a multi-plate reader (Multiskan Spectrum, Thermo Electron Co., Waltham, MA, USA). Values were calculated by comparing the experimental cells with their respective controls. Mean values were calculated from triplicate cultures.
2.4. Chemo-sensitivity assays
All cells were treated with increasing concentrations of Dex for 48 h, followed by assessment of cell viability by MTT assay, which was performed as described previously [Citation18]. IC50 (concentration that inhibits 50%) values calculated by a decrease of 50% in cell viability rate compared to that of the control cell. The coefficient of drug interaction (CDI) was used to analyze the effects of treatment combinations. The CDI is calculated as follows: CDI = AB/ (A×B). According to the absorbance of each group, AB is the ratio of the combination groups to control group; A or B is the ratio of the single treatment group to control group. Thus, a CDI value <1, = 1 or >1 indicates that the drugs are synergistic, additive or antagonistic, respectively. CDI >1.25 indicates that the drugs are significantly antagonistic.
2.5. Cell cycle analysis
For each analysis, 106 cells were harvested 48 h after treatment and fixed overnight in 70% ethanol at 4 °C. The cells were then washed and stained with 5 μg/ml PI in the presence of DNAse-free RNAse (Sigma). After 30 min at room temperature, the cells were analyzed via flow cytometry (Cytomics FC 500 and CXP & Multicycle software, Beckman Coulter Inc., Miami, FL, USA), acquiring 30,000 events.
2.6. Apoptosis assay
The samples were washed with PBS twice and stained with Annexin V-FLUOS and PI using Annexin- V-FLUOS staining kit (Roche) according to the manufacturer’s protocol. The percentage of Annexin-V positive and PI negative cells was determined by flow cytometry (Cytomics FC 500 and CXP software, Beckman Coulter), as the percentage of cells in the early stage of apoptosis, the percentage of Annexin-V positive and PI positive was recorded as the percentage of late apoptosis. The percentage of Annexin-V positive was recorded as the percentage of cell apoptosis.
2.7. Western blotting analysis
As described previously [Citation18], cells (106) were washed twice in cold PBS and then lysed by RIPA lysis buffer (Bio-Rad). Samples were boiled for 5 min at 100°C. Proteins were separated by 8∼15% SDS–polyacrylamide gel electrophoresis and transferred onto nitrocellulose membranes (0.22 μm or 0.45 μm, Millipore). Non-specific binding sites were blocked with 5% non-fat dry milk or 3% BSA dissolved in TBS (10 mM Tris–HCl, pH 7.6, 137 mM NaCl) with 0.1% Tween 20 (TTBS) for 2 h at room temperature, followed by incubation with primary antibody for 2 h at room temperature or at 4°C overnight. The membranes were then washed three times in TTBS and incubated for 2 h at room temperature with secondary HRP-conjugated donkey anti-rabbit antibody or HRP-conjugated sheep anti-mouse antibody diluted 1:5000 in TTBS with 5% non-fat milk. Proteins were visualized by incubation with ECL plus (Millipore). All experiments were conducted independently at least three times. The level of the β-Actin protein was used as a control for the amount of protein loaded into each lane.
2.8. Glucose consumption assay
Glucose consumption was measured with a Glucose (HK) Assay Kit (Sigma) performed as described previously [Citation25]. Briefly, 2×10⁶ cells were grown in 10 ml RPMI containing 2 g/L glucose. After 48 h, the medium was collected by centrifugation to remove the cells. Medium from each condition was incubated for 30 min with the glucose assay reagent. Spectrophotometric absorbance was measured at 340 nm using a multi-plate reader (Multiskan Spectrum). Values were obtained by comparing with a glucose standard solution.
2.9. Lactate concentration assay
The concentration of lactate, the final metabolic product of the glycolytic pathway, was analyzed using a Lactate Assay Kit (Jiancheng, Nanjing, China), which performed as described previously [Citation25]. Briefly, 2×10⁶ cells were grown in 10 ml RPMI containing 2 g/L glucose. After 48 h, the medium was collected by centrifugation to remove the cells. Lactate in the supernatant was detected according to the manufacturer’s instructions. Spectrophotometric absorbance was measured at 530 nm using a multi-plate reader (Multiskan Spectrum). Values were obtained by comparing with a lactate standard solution.
2.10. Statistical analysis
All assays were performed in triplicate, and data are expressed as mean values ± SD. Independent samples t test was used to compare two groups. A p-value < 0.05 was considered to be significant.
3. Results
3.1. Effects of hypoxia on cell proliferation of T-ALL cells
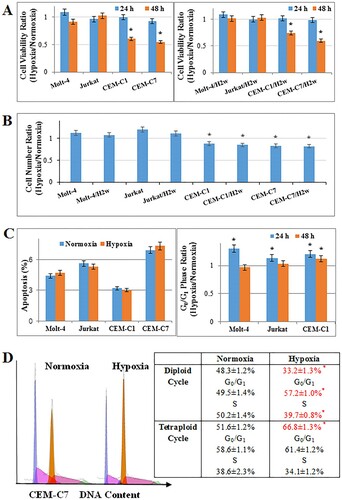
First, the effects of hypoxia on proliferation on T-ALL cell lines were examined. Hypoxia of 1% O2 did not influence the cell viability (p>0.05) and increased the cell number of Molt-4 (p<0.01) after 48 h, but resulted in an obvious reduction of cell viability and number in CEM-C1 and CEM-C7 (A,B). The similar effect was observed after two weeks of pre-culturing the cells at hypoxic conditions before running the experiment (A,B), suggesting that hypoxic adaptation did not change the impact of hypoxia on T-ALL cells. Hypoxia did not induce apoptosis in all the tested T-ALL cells (C). Consistent with the results of cell proliferation, hypoxia did not influence the distribution of G0/G1 phase in Molt-4, and induced a G0/G1 arrest in CEM-C1 (C) and led to a clone evolution with an increased tetraploid cycle in CEM-C7 cells and a G0/G1 arrest in diploid cycle at 48 h (D). Hypoxia induced G0/G1 arrest in Molt-4 and CEM-C1 cells at 24 h (C). In CEM-C7 cells, hypoxia made no influence on cell cycle distribution at 24 h (Figure S1).
Figure 1. Effects of hypoxia on proliferation of T-ALL cells. Cells pre-culturing under hypoxia of 1% O2 for 2 weeks were added H2w as a suffix. All cells were cultured under hypoxic conditions for 48 h. (A) Hypoxia did not influence the cell viability of Molt-4 at 48 h. Cell viability was reduced in CEM-C1 and CEM-C7 cells. The similar effects were observed in the pre-culturing cells. (B) Hypoxia resulted in an increase in cell numbers in Molt-4 and a decrease in cell numbers in CEM-C1 and CEM-C7. (C) Hypoxia did not induce cell apoptosis in T-ALL, whilst induced G0/G1 arrest in CEM-C1 and CEM-C7 at 48 h. (D) Hypoxia led to a clone evolution with an increased tetraploid cycle in CEM-C7 cells and a G0/G1 arrest in diploid cycle at 48 h. Experiments were performed in triplicate. *: p<0.01 hypoxia versus normoxia.
3.2. Effects of hypoxia on cell glucose metabolism
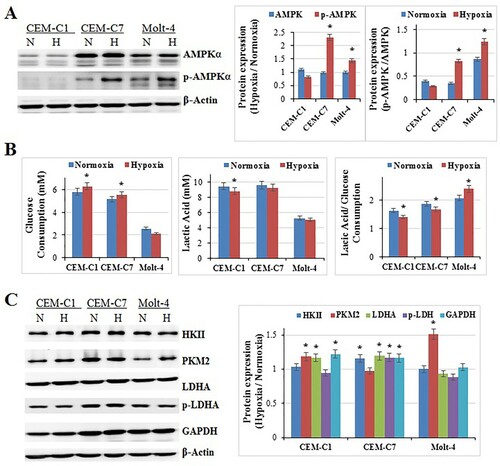
Hypoxia should interfere with the energy metabolism of the cells [26]. It has been known for many years that cancer cells and non-malignant proliferating cells can activate glycolysis in the absence of adequate oxygen levels (aerobic glycolysis or Warburg effect) [Citation27,Citation28]. Therefore, it should be easy for cancer cells to accommodate the hypoxic condition. We detected the expression of AMPK and p-AMPK, the energy sensor, which has been described as a ‘fuel gauge of the cell’ [Citation29,Citation30]. The results showed that, 48 h exposure of hypoxia induced the expression of p-AMPK and p-AMPK/AMPK obviously in CEM-C7 and Molt-4 (p<0.01), but made no change in CEM-C1 (p>0.05) (A). Our previous study showed that under normoxia, CEM-C1 showed the lowest ratio of lactate production to glucose consumption among the three cell lines, and Molt-4 exhibited the highest ratio [Citation25]. Mitochondrial respiration is an efficient mode of energy production in the cell; however, in the absence of oxygen, cells rely on glycolysis as the main source of energy. To detect the impact of hypoxia on the glycolytic phenotype of those cells, we tested the glucose consumption and lactate production. After 48 h exposure of hypoxia, the glucose consumption increased in CEM-C1and CEM-C7 (p<0.01), and did not change in Molt-4 (p>0.05) (B). Curiously, the lactate production decreased in CEM-C1 (p<0.01), and did not change in CEM-C7 and Molt-4 (p>0.05) (B). Accordingly, the lactate production/glucose consumption decreased in CEM-C1 and CEM-C7 (p<0.01), and increased in Molt-4 (p<0.01) (B). The western blotting results showed that the expression of PKM2 and GAPDH were induced in CEM-C1, HKII and GAPDH were induced in CEM-C7, PKM2 was induced in Molt-4 (p<0.01) (C). LDHA was increased in CEM-C1 (p<0.01), but p-LDHA did not change (C). LDHA and p-LDHA were increased in CEM-C7 (p<0.01) (C). LDHA and p-LDHA did not change in Molt-4 (p>0.05) (C). That means key enzymes in glycolysis pathway were induced in those cells, although different cell lines had different effector proteins. The alterations in the key enzymes of glycolysis were consistent with those of glucose consumption and lactate production in different cells. That is to say, T-ALL cells could accommodate to hypoxic condition rapidly, different cells adapted the hypoxic condition in different ways.
Figure 2. Effects of hypoxia on cell glucose metabolism. All cells were cultured under hypoxic conditions for 48 h. (A) Hypoxia induced the expression of p-AMPK in CEM-C7 and Molt-4 cells at 48 h. Experiments were performed in triplicate (n=3). β-Actin was used as an internal control. Bar graphs show the protein expression ratio of hypoxia to normoxia. *: p<0.01 hypoxia versus normoxia. (B) The glucose consumption increased in CEM-C1and CEM-C7, and did not change in Molt-4. The lactate production decreased in CEM-C1, and did not change in CEM-C7 and Molt-4. For all experiments, values of triplicate experiments are shown as the mean ± SD. *: p<0.01 hypoxia versus normoxia. (C) PKM2, p-LDHA and GAPDH were induced in CEM-C1. HKII, LDHA, p-LDHA and GAPDH were induced in CEM-C7. PKM2 was induced in Molt-4. Experiments were performed in triplicate. Bar graphs show the protein expression ratio of hypoxia to normoxia. *: p<0.01 hypoxia versus normoxia.
3.3. Effects of hypoxia on cell autophagy and endoplasmic reticulum (ER) stress
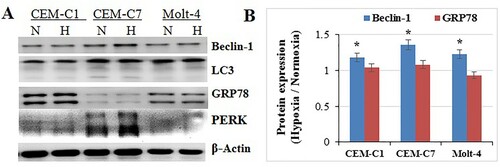
Hypoxia can induce ER stress and the unfolded protein response (UPR) [Citation26,Citation31]. The UPR and activated AMPK can induce autophagy to recycle nutrient and survive tumour cells under hypoxic stress [Citation10,Citation32]. After 48 h exposure to 1% O2 condition, T-ALL cell lines, CEM-C1, CEM-C7 and Molt-4, showed an induction in Becline 1 (p<0.05) with no alteration in LC3 (p>0.05) (A,B). GRP78 and PERK did not change (p>0.05) (A,B). Therefore, hypoxia may not activate ER stress and induce autophagy in both GC-sensitive and -resistant T-ALL cells. We speculated that it might be a homing process of leukaemic cells to enter hypoxic condition, mimicking the condition of BM hypoxic microenvironment. Hence, it is a natural ability to accommodate hypoxic condition for T-ALL cells.
Figure 3. Effects of hypoxia on cell autophagy and ER. All cells were cultured under hypoxic conditions for 48 h. (A) CEM-C1, CEM-C7 and Molt-4, showed an induction in Becline-1 with no alteration in LC3. GRP78 and PERK did not change. (B) Bar graphs show the protein expression ratio of hypoxia to normoxia. *: p<0.05 hypoxia versus normoxia.
3.4. Effects of hypoxia on GC sensitivity
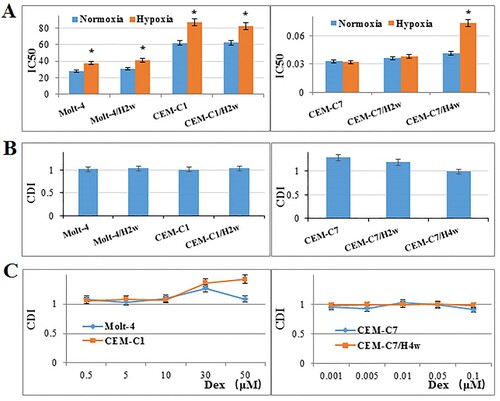
Hypoxia resulted in an induction of IC50 to Dex in GC-resistant T-ALL cell lines, Molt-4 (from 28.18–37.66 μM) and CEM-C1(from 62.12 to 87.38 μM), after 48 h (p<0.01) (A). The similar effect was observed after 2 weeks of pre-culturing the cells at hypoxic condition. The therapeutic dose of Dex (1 μM) showed an addictive effect with hypoxia (B). High dose of Dex (30 μM) combined with hypoxia produced a significant antagonistic effect, the CDI was 1.36 in CEM-C1and 1.27 in Molt-4 (C). In GC-sensitive T-ALL cell line, CEM-C7, hypoxia did not influence the IC50 to Dex (p>0.05) (A), but showed an antagonistic effect with 1 μM Dex (B). Two weeks of pre-culturing under hypoxic condition did not change the result (A,B). However, four weeks of pre-culturing under hypoxic condition resulted in an induction of IC50 (from 0.04–0.07 μM, p<0.01) (A), and an addictive effect with 1 μM Dex (B). Low-dose Dex (≤0.1 μM) showed an addictive effect with hypoxia in both CEM-C7 and CEM-C7/H4w cells (C). These results suggest that hypoxia has a protective effect on leukaemic cells to GC therapy.
Figure 4. Effects of hypoxia on GC sensitivity. (A) T-ALL cells were cultured with increasing concentrations of Dex for 48 h. Hypoxia increased IC50 of Dex in CEM-C1, CEM-C1/H2w, Molt-4 and Molt-4/H2w cells, and made no effect on the IC50 of Dex in CEM-C7 and CEM-C7/H2w cells. Chronic hypoxia (four weeks) increased IC50 of Dex. Experiments were performed in triplicate. *: p<0.01 hypoxia versus normoxia. (B, C) CDI was used to analyze effects of treatment combinations. In GC-resistant cells, the CDI was 1 when therapeutic dose of Dex (1 μM) combined with hypoxia; the CDI was 1.36 in CEM-C1and 1.27 in Molt-4 when 30 μM Dex combined with hypoxia. In GC-sensitive T-ALL cell line, CEM-C7, the CDI was 1.29 when Dex (1 μM) combined with hypoxia. Low-dose Dex showed an addictive effect with hypoxia in both CEM-C7 and CEM-C7/H4w cells. Values are the results of three determinations.
4. Discussion
Tumour microenvironment is emerging as a potential anti-cancer target [Citation27]. Hypoxia is a key feature of tumour microenvironment and is known to be associated with tumour progression and poor clinical outcome [Citation11,Citation27,Citation33]. Hypoxic cells are less likely to accumulate therapeutic concentrations of chemotherapeutics that can lead to therapeutic resistance [Citation34]. The role and application of hypoxic tumour microenvironment have been in-depth studied in solid tumours; it is now widely acknowledged that hypoxia is responsible not only for pharmacokinetics but also for supporting the selection of more malignant cells or even resistance [Citation11,Citation21,Citation27,Citation33]. The discovery and development of novel agents targeting hypoxia signaling pathways is an exciting area of developmental therapeutics that has exponentially grown over the last four decades. Several approaches for targeting hypoxic tumour cells have been proposed, including hypoxia-activated prodrugs, gene therapy and specific targeting of HIFs, or targeting pathways important in hypoxic cells such as mTOR and UPR pathways [Citation10]. However, targeting hypoxia is still in a tight spot, for it is hard to take the drugs to the hypoxic cells. Therefore, to understand the real function of hypoxia on cancer cells is the most important and fundamental work in the field of targeting hypoxia.
For a long time, we know that quiescent leukaemia stem cells (LSCs) can reside well in the BM niche, avoiding attack by chemotherapeutic agents, which is the main cause of chemotherapeutic resistance and relapse in leukaemia [Citation16,Citation35]. However, there was a controversy on the hypoxic condition of BM [Citation36]. Fortunately, direct in-vivo method was constructed to measure local oxygen tension in BM in 2014, and demonstrate that the entire BM, including the niche microenvironment, displays low oxygen pressure despite very high vascular density; the O2 levels in the BM of live animals lie between 4.8 and 31.7 mmHg or 0.6% and 4% [Citation12]. Meanwhile, using the hypoxia marker ‘Pimonidazole’, vast expansion of the hypoxic niches were confirmed in the BM from mice bearing ALL, acute myeloid leukaemia (AML) and chronic myeloid leukaemia (CML) xenografts [Citation37,Citation38]. Hypoxia has been shown as a prominent feature of the BM microenvironment in different hematological malignancies [Citation12,Citation39].
It is well known that hypoxia promotes the maintenance of hematopoietic stem cells in a quiescent and pluripotent state. Previous studies reported that hypoxic condition enhanced the expansion of mesenchymal stem cells (MSC) [Citation40–42], which is still in dispute [Citation43,Citation44]. Hypoxia may promote the stemness of cancer cells by G0 phase arrest. Hypoxia of 1% O2 resulted in a reduction of cell number in AML, CML and T-ALL cell lines and primary CML and AML blasts [Citation45–47]. Given that leukaemia is a highly heterogeneous disease with multiple signaling pathways contributing to its pathogenesis, T-ALL cells, which are originated from different patients, have different metabolic phenotype and different adaptation means to hypoxia. Therefore, our results showed that hypoxia may result in different impact on cell proliferation to different cell lines, reduced, unaffected or induced, according to their different metabolic phenotype. Moreover, the heterogeneous in the metabolic phenotype of different ALL cells resulted in individual energy adaptation to hypoxia, just like the results in chronic lymphocytic leukaemia (CLL) [Citation48]. Hypoxia induced the expression of key enzymes in glycolysis pathway in all tested T-ALL cell lines, but different cells had different effector proteins. Research on AML showed that Hypoxia induced similar changes in the metabolic profiles in different AML cells [Citation49]. Curiously, the lactate production was not increased in all the tested T-ALL cells even though in the cells the glucose consumption was increased. Lactate produced by glycolysis might be a potential nutrient for tumour cells; therefore, glycolysis and TCA cycle are uncoupled at the level of lactate [Citation50]. However, the relevance and mechanism of circulating lactate as fuel remains unclear in hypoxic ALL cells, which need further research.
Researches on solid tumours showed that hypoxia may trigger ER stress and activate AMPK, and then autophagy pathway may be activated to defense against the hypoxic stress [Citation10,Citation26,Citation31,Citation32]. However, our results showed that acute hypoxia did not activate ER stress and autophagy in T-ALL cells, although p-AMPK was induced by hypoxia in CEM-C7 and Molt-4. We know that the leukaemic cells originate from the LSC living in hypoxic BM niche, and then entry into the peripheral circulation. Therefore, leukaemic cells may have distinct metabolic response to hypoxia from solid tumour cells. And the ability to take lactate as fuel may help ALL cells accommodate hypoxia quickly. A real-time metabolism study on CLL cells showed that circulating CLL cells were primed for hypoxia and showed the same adaptive response upon secondary exposure to hypoxia [Citation48]. Studies on BM-derived MSC showed that hypoxia may conserve a reduced tendency to autophagy [Citation44], but there remains controversial [Citation51,Citation52].
Drug resistance, especially GC resistance, plays a crucial role in relapse of T-ALL. Hypoxia may promote chemoresistance in solid tumours and hematological malignancies [Citation11]. In AML cell lines and blasts from patients, hypoxia induced the resistance to cytarabine [Citation53]. B-ALL cells exhibit the same sensitivity to Methotrexate and Prednisone in both hypoxia and normoxia conditions; hypoxia showed a protective effect on B-ALL cells that is not due to an increase in the number of viable cells [Citation54]. In T-ALL, acute hypoxia did not induce GC-resistant in GC-sensitive cells, which is in accordance with the clinic condition that most of the patients with T-ALL are sensitive to chemotherapy and can be cured. The trouble is prolonged hypoxia can induce GC resistance in GC-sensitive cells, which is consistent with the previous results [Citation18]. Hypoxia even induced a higher resistant to GC in GC-resistant cells. More important, when we tried to increase the dose of GC, hypoxia performed a significant antagonistic effect to Dex, which may partly explain the ineffectiveness of high-dose chemotherapy protocols to refractory/relapsed T-ALL. Unfortunately, we can hardly find any common feature correlate GC resistance with hypoxic-associated proteins, for T-ALL cells are highly heterogeneous with distinct metabolic phenotype and diverse metabolic response to hypoxia.
Conclusively, T-ALL cells can adapt hypoxic condition well, accompanied with different impact on cell proliferation according to different metabolic phenotype. The most important discovery is that hypoxia contributes to GC resistance in T-ALL blasts, especially in refractory/relapsed T-ALL. That is to say, it is very important for T-ALL patients to select proper induction chemotherapy protocol to minimize the influence of hypoxia on ALL cells. Hypoxia is an important target for refractory/relapsed T-ALL therapy.
Availability of data and material
The datasets used and analyzed during the current study are available from the corresponding author on a reasonable request.
| Abbreviations | ||
| ALL | = | acute lymphoblastic leukaemia |
| AML | = | acute myeloid leukaemia |
| BM | = | bone marrow |
| CDI | = | coefficient of drug interaction |
| CLL | = | chronic lymphocytic leukaemia |
| CML | = | chronic myeloid leukaemia |
| Dex | = | dexamethasone |
| GC | = | glucocorticoid |
| LSCs | = | leukaemia stem cells |
| MSC | = | mesenchymal stem cells |
| MTT | = | 3-(4,5-dimethylthiazol-2-yl)-2,5-diphenyltetrazolium bromide |
| PI | = | Propidium iodide |
| UPR | = | unfolded protein response |
Disclosure statement
No potential conflict of interest was reported by the author(s).
Additional information
Funding
References
- Ward E, DeSantis C, Robbins A, et al. Childhood and adolescent cancer statistics, 2014. CA Cancer J Clin. 2014;64(2):83–103.
- Teachey DT, Pui CH. Comparative features and outcomes between paediatric T-cell and B-cell acute lymphoblastic leukaemia. Lancet Oncol. 2019;20(3):e142–e154.
- Bhojwani D, Pui CH. Relapsed childhood acute lymphoblastic leukaemia. Lancet Oncol. 2013;14(6):e205–e217.
- Locatelli F, Moretta F, Rutella S. Management of relapsed acute lymphoblastic leukemia in childhood with conventional and innovative approaches. Curr Opin Oncol. 2013;25(6):707–715.
- Tissing WJ, Meijerink JP, den Boer ML, et al. Molecular determinants of glucocorticoid sensitivity and resistance in acute lymphoblastic leukemia. Leukemia. 2003;17(1):17–25.
- Inaba H, Pui CH. Glucocorticoid use in acute lymphoblastic leukaemia. Lancet Oncol. 2010;11(11):1096–1106.
- Delgado-Martin C, Meyer LK, Huang BJ, et al. JAK/STAT pathway inhibition overcomes IL7-induced glucocorticoid resistance in a subset of human T-cell acute lymphoblastic leukemias. Leukemia. 2017;31(12):2568–2576.
- Klumper E, Pieters R, Veerman AJ, et al. In vitro cellular drug resistance in children with relapsed/refractory acute lymphoblastic leukemia. Blood. 1995;86(10):3861–3868.
- Icard P, Shulman S, Farhat D, et al. How the Warburg effect supports aggressiveness and drug resistance of cancer cells. Drug Resist Updat. 2018;38:1–11.
- Jing X, Yang F, Shao C, et al. Role of hypoxia in cancer therapy by regulating the tumor microenvironment. Mol Cancer. 2019;18(1):157.
- Wilson WR, Hay MP. Targeting hypoxia in cancer therapy. Nat Rev Cancer. 2011;11(6):393–410.
- Spencer JA, Ferraro F, Roussakis E, et al. Direct measurement of local oxygen concentration in the bone marrow of live animals. Nature. 2014;508(7495):269–273.
- Sbarba P D, Cheloni G. Tissue “hypoxia” and the maintenance of leukemia stem cells. Adv Exp Med Biol. 2019; 1143:129–145.
- Dumas PY, Naudin C, Martin-Lannerée S, et al. Hematopoietic niche drives FLT3-ITD acute myeloid leukemia resistance to quizartinib via STAT5- and hypoxia- dependent up-regulation of AXL. Haematologica. 2019;104(10):2017–2027.
- Wielockx B, Grinenko T, Mirtschink P, et al. Hypoxia pathway proteins in normal and malignant hematopoiesis. Cells. 2019;8(2):155.
- Chen Y, Liang Y, Luo X, et al. Oxidative resistance of leukemic stem cells and oxidative damage to hematopoietic stem cells under pro-oxidative therapy. Cell Death Dis. 2020;11(4):291.
- Huang X, Trinh T, Aljoufi A, et al. Hypoxia signaling pathway in stem cell regulation: good and evil. Curr Stem Cell Rep. 2018;4(2):149–157.
- Gu L, Zhang G, Zhang Y. A novel method to establish glucocorticoid resistant acute lymphoblastic leukemia cell lines. J Exp Clin Cancer Res. 2019;38(1):269.
- Coley HM. Development of drug-resistant models. Methods Mol Med. 2004;88:267–273.
- Watson MB, Lind MJ, Cawkwell L. Establishment of in-vitro models of chemotherapy resistance. Anticancer Drugs. 2007;18(7):749–754.
- Bhandari V, Hoey C, Liu LY, et al. Molecular landmarks of tumor hypoxia across cancer types. Nat Genet. 2019;51(2):308–318.
- Yang L, Shi P, Zhao G, et al. Targeting cancer stem cell pathways for cancer therapy. Signal Transduct Target Ther. 2020;5(1):8.
- Zawydiwski R, Harmon JM, Thompson EB. Glucocorticoid-resistant human acute lymphoblastic leukemic cell line with functional receptor. Cancer Res. 1983;43(8):3865–3873.
- Foley GE, Lazarus H, Farber S, et al. Continuous culture of human lymphoblasts from peripheral blood of a child with acute luekemia. Cancer. 1965;18: 522–529.
- Gu L, Yi Z, Zhang Y, et al. Low dose of 2-deoxy-D-glucose kills acute lymphoblastic leukemia cells and reverses glucocorticoid resistance via N-linked glycosylation inhibition under normoxia. Oncotarget. 2017;8(19):30978–30991.
- Lee P, Chandel NS, Simon MC. Cellular adaptation to hypoxia through hypoxia inducible factors and beyond. Nat Rev Mol Cell Biol. 2020;21(5):268–283.
- Hanahan D, Weinberg RA. Hallmarks of cancer: the next generation. Cell. 2011;144(5):646–674.
- Warburg O. On the origin of cancer cells. Science. 1956;123(3191):309–314.
- Hardie DG, Carling D. The AMP-activated protein kinase–fuel gauge of the mammalian cell. Eur J Biochem. 1997;246(2):259–273.
- Hardie DG, Ross FA, Hawley SA. AMPK: a nutrient and energy sensor that maintains energy homeostasis. Nat Rev Mol Cell Biol. 2012;13(4):251–262.
- Chipurupalli S, Kannan E, Tergaonkar V, et al. Hypoxia induced ER stress response as an adaptive mechanism in cancer. Int J Mol Sci. 2019;20(3):749.
- Hu YL, Jahangiri A, De Lay M, et al. Hypoxia-induced tumor cell autophagy mediates resistance to anti-angiogenic therapy. Autophagy. 2012;8(6):979–981.
- Quail DF, Joyce JA. Microenvironmental regulation of tumor progression and metastasis. Nat Med. 2013;19(11):1423–1437.
- Carnero A, Lleonart M. The hypoxic microenvironment: A determinant of cancer stem cell evolution. Bioessays. 2016;38: Suppl S65–S74.
- Konopleva M, Tabe Y, Zeng Z, et al. Therapeutic targeting of microenvironmental interactions in leukemia: mechanisms and approaches. Drug Resist Updat. 2009;12(4-5):103–113.
- Rieger CT, Fiegl M. Microenvironmental oxygen partial pressure in acute myeloid leukemia: Is there really a role for hypoxia. Exp Hematol. 2016;44(7):578–582.
- Benito J, Shi Y, Szymanska B, et al. Pronounced hypoxia in models of murine and human leukemia: high efficacy of hypoxia-activated prodrug PR-104. PLoS One. 2011;6(8):e23108.
- Wood C, Harutyunyan K, Sampaio D, et al. Photoacoustic-based oxygen saturation assessment of murine femoral bone marrow in a preclinical model of leukemia. Photoacoustics. 2019;14:31–36.
- Konopleva M, Thall PF, Yi CA, et al. Phase I/II study of the hypoxia-activated prodrug PR104 in refractory/relapsed acute myeloid leukemia and acute lymphoblastic leukemia. Haematologica. 2015;100(7):927–934.
- Adesida AB, Mulet-Sierra A, Jomha NM. Hypoxia mediated isolation and expansion enhances the chondrogenic capacity of bone marrow mesenchymal stromal cells. Stem Cell Res Ther. 2012;3(2):9.
- Basciano L, Nemos C, Foliguet B, et al. Long term culture of mesenchymal stem cells in hypoxia promotes a genetic program maintaining their undifferentiated and multipotent status. BMC Cell Biol. 2011;12:12.
- Santos F D, Andrade PZ, Boura JS, et al. Ex vivo expansion of human mesenchymal stem cells: a more effective cell proliferation kinetics and metabolism under hypoxia. J Cell Physiol. 2010;223(1):27–35.
- Kumar S, Vaidya M. Hypoxia inhibits mesenchymal stem cell proliferation through HIF1α-dependent regulation of P27. Mol Cell Biochem. 2016;415(1-2):29–38.
- Pezzi A, Amorin B, Laureano Á, et al. Effects of hypoxia in long-term In vitro expansion of human bone marrow derived mesenchymal stem cells. J Cell Biochem. 2017;118(10):3072–3079.
- Drolle H, Wagner M, Vasold J, et al. Hypoxia regulates proliferation of acute myeloid leukemia and sensitivity against chemotherapy. Leuk Res. 2015;39(7):779–785.
- Itoh M, Okuhashi Y, Takahashi Y, et al. Hypoxia Up-regulates HIF expression while suppressing cell growth and NOTCH activity in leukaemia cells. Anticancer Res. 2019;39(8):4165–4170.
- Ng KP, Manjeri A, Lee KL, et al. Physiologic hypoxia promotes maintenance of CML stem cells despite effective BCR-ABL1 inhibition. Blood. 2014;123(21):3316–3326.
- Koczula KM, Ludwig C, Hayden R, et al. Metabolic plasticity in CLL: adaptation to the hypoxic niche. Leukemia. 2016;30(1):65–73.
- Lodi A, Tiziani S, Khanim FL, et al. Hypoxia triggers major metabolic changes in AML cells without altering indomethacin-induced TCA cycle deregulation. ACS Chem Biol. 2011;6(2):169–175.
- Hui S, Ghergurovich JM, Morscher RJ, et al. Glucose feeds the TCA cycle via circulating lactate. Nature. 2017;551(7678):115–118.
- Lee Y, Jung J, Cho KJ, et al. Increased SCF/c-kit by hypoxia promotes autophagy of human placental chorionic plate-derived mesenchymal stem cells via regulating the phosphorylation of mTOR. J Cell Biochem. 2013;114(1):79–88.
- Liu J, Hao H, Huang H, et al. Hypoxia regulates the therapeutic potential of mesenchymal stem cells through enhanced autophagy. Int J Low Extrem Wounds. 2015;14(1):63–72.
- Degwert N, Latuske E, Vohwinkel G, et al. Deoxycytidine kinase is downregulated under hypoxic conditions and confers resistance against cytarabine in acute myeloid leukaemia. Eur J Haematol. 2016;97(3):239–244.
- Petit C, Gouel F, Dubus I, et al. Hypoxia promotes chemoresistance in acute lymphoblastic leukemia cell lines by modulating death signaling pathways. BMC Cancer. 2016;16(1):746.