
ABSTRACT
Background
Ferroptosis involves in the development and therapeutic response of various types of tumors. This study aims to explore ferroptosis-related prognostic genes that could further accurately stratify AML patients.
Methods
We investigated the prognosis significance of ferroptosis-related genes in AML by Univariate and multivariate Cox proportional hazards regression analyses. With the methylation data of TCGA samples, we looked for methylation sites associated with prognostic genes and compared the correlation between methylation and mRNA expression. R software and ‘edgeR’ packages were used to identify the DEGs between the high-and-low-risk groups divided by the FRPGs prognosis model and then run GO enrichment, KEGG pathway, and PPI network.
Results
We found a prognostic risk model that included AKR1C2 and SOCS1 predicted outcomes in AML patients. Methylation analysis showed that AKR1C2 and SOCS1 are negatively regulated by their methylation, leading to their low expression in AML patients. Besides, both decreased SOCS1 expression and hypermethylation predicted favorable OS and PFS in AML patients. Finally, this prognostic risk model exhibited a close correlation with several clinical features, especially with age (P=0.005), cytogenetic type (P=0.031), risk_cytogenetic (P=0.001), and risk_molecular (P<0.001). Functional enrichment analysis showed that DEGs are most enriched in the regulation of cell death and the PI3K-Akt signaling pathway.
Conclusion
AKR1C2 and SOCS1 are promising biomarkers for predicting prognosis in patients with AML.
KEYWORDS:
Introduction
Acute myeloid leukemia (AML) is a group of molecularly heterogeneous hematologic malignancies. Its initiation mainly attributes to changes in pivotal cellular regulatory factors, such as transcription and epigenetic factors [Citation1]. Currently, cytogenetic outcomes and molecular abnormalities at diagnosis consider being the most important prognostic factors for AML and highly predictive of complete response rate(CR), disease-free survival(DFS), overall survival(OS), and recurrence risk [Citation2,Citation3].
Current clinical guidelines classify AML into three groups (favorable, intermediate, and adverse risk) according to cytogenetic and molecular risks of AML patients. The intermediate-risk group is the most subgroups, accounting for approximately 45% of adult AML patients. AML patients with normal karyotypes (NK-AML) and patients without adverse or favorable molecular abnormalities are in this subgroup [Citation2]. The ideal therapy strategy for these patients endures unclear, and treatment outcomes are heterogeneous. Several studies have found molecular alterations to further refine risk stratification (such as KIT, AF1q, MN1, ERG, MLL, and BAALC) in this subgroup of patients [Citation4–6]. It is necessary to further perfect the risk stratification of AML patients and provide more accurate and appropriate therapy for the patients with intermediate-risk.
Epigenetic modification abnormalities appear in a large proportion of AML patients [Citation7]. As a critical regulator of gene expression, DNA methylation study may also help to the more precise grouping of AML patients. DNA methylation is a key epigenetic mechanism involved in transcriptional regulation and cell development and function [Citation8]. Hypomethylation rules in introns and repeats elements, while hypermethylation usually happens in so-called CpG islands and is correlated with gene promoter regions. Numerous studies have established a link between abnormal DNA methylation and gene silencing in disorders [Citation9–11]. These suggest the potential importance of DNA methylation as a prognostic and risk marker in AML.
Ferroptosis is an iron-dependent form of regulatory cell death caused by excessive lipid peroxidation, associates with the development and therapeutic response of various types of tumors [Citation12,Citation13]. In this study, we first selected the ferroptosis-related genes (FRGs) of AML in the TCGA database, explored the ferroptosis-related prognostic genes (FRPGs) and their DNA methylation in AML. Then, we validated the prognostic-related genes in patients at intermediate risk classified by the NCCN AML classification according to their molecular and cytogenetic risk status. Finally, according to the prognostic model, patients were divided into low- and high-risk groups. We calculated the differentially expressed genes (DEGs) between the two groups and examined the biological processes of DEGs through gene enrichment analysis to study the functional mechanism of FRPGs in AML.
Materials and methods
Acquisition of ferroptosis-related genes in AML
First, we downloaded the clinical data, transcriptional data, along with methylation profiles of patients with AML from the TCGA database via the Cbioportal website (https://www.cbioportal.org/study/summary?id=laml_tcga_pub). The inclusion criteria were patients with complete transcriptional, methylation, and clinical data. 154 AML samples were retrieved for subsequent analysis. Then, we downloaded the FRGs data from the FerrDb website (http://www.zhounan.org/ferrdb/operations/download.html). FerrDb is the database of ferroptosis regulators and markers and ferroptosis-disease associations [Citation14]. The genes in AML of the TCGA database were intersected with FRGs to obtain FRGs in AML.
Construction of a prognostic signature
We performed the univariate Cox regression analysis of FRGs in AML by using the ‘survival’ package in R software to obtain the FRPGs (P<0.05). Then, we searched an online website for gene expression profiling interactive analysis (GEPIA) to investigate the DEGs of the FRPGs in AML samples and healthy control samples. Moreover, the DEGs of prognostic significance were further put into multivariate Cox regression analysis to obtain the FRPGs for constructing the prognosis model and generated the regression coefficients of these crucial genes. To reflect the effect of the prognostic model on the survival status of AML patients, we calculated the risk score of each patient by multiplying the normalized gene expression of each FRPG with its corresponding regression coefficient and divided patients into low-and- high-risk groups according to the mean risk score. We further conducted the Kaplan-Meier curve analysis to estimate the relationship between the risk score, overall survival, and disease-free survival. We also performed time-dependent receiver operating characteristic (ROC) curve analysis to evaluate the 3-year and 5-year predictive value of the os status and calculated the area under the curve (AUC) of the ROC curve to examine the classifier performance. Besides, we analyzed the relationship between the different clinical parameters and the risk score based on FRPGs. To explore whether these prognostic genes can use as supplements to the current AML molecular risk stratification, we further applied the prognosis model in patients at intermediate risk classified by the NCCN AML classification according to their molecular and cytogenetic risk status.
DNA methylation analysis of prognostic genes
With the methylation data of TCGA samples, we looked for methylation sites associated with prognostic genes and compared the correlation between methylation and mRNA expression. MethSurv (https://biit.cs.ut.ee/methsurv/) contains the clinical and methylation data on AML in the TCGA dataset and provides online analysis [Citation15], was used to draw the heat maps of methylation sites and to do survival analysis of methylation sites. We also investigated the detailed association of FRPGs and their methylation with a range of clinical features. Graph of methylation and gene expression, survival curves, and density figures of the methylation sites were plotted.
GO and KEGG functional enrichment analysis
In the part of construction of a prognostic signature, the TCGA cohorts were divided into high-and-low-risk groups by multivariate regression analysis. Then, the ‘edgeR’ package of R software was used to compare the gene expression profiles of patients in high-and-low-risk groups and the DEGs between these two groups were obtained. Then, analyzed Gene Ontology (GO) and Kyoto Encyclopedia of Genes and Genomes (KEGG) analyses based on the DEGs (P-value < 0.05, |log2FC| ≥ 1.5) between the high-risk and low-risk groups using the ‘clusterProfiler’ R package.
Protein–protein interaction network construction and module analysis
The protein–protein interaction (PPI) network of DEGs was constructed using the gene/protein retrieval tool (https://string-db.org/), and the results were visualized by Cytoscape software (version 3.8.0). Cytoscape MCODE plug-in provided access to select the significant modular of PPI network [Citation16,Citation17]. The patterns default parameters are as follows: degree cutoff=3, node score cutoff=0.2, k-core=2, and max. depth=100. For genes in the hub modules, we use ClueGO + CluePedia for functional enrichment analysis.
Statistical analysis
The OS and DFS between different groupswere compared by Kaplan-Meier analysis with the Nonparametric test. The student's t-testwas used to compare gene expression between high-and-low groups. Pearson correlation and Spearman's rho wereused to analyzing the correlation between methylation and mRNA expression. A chi-square test wasused to investigate the detailed association of prognostic-related genes, AKR1C2 expression, SOCS1 expression, and their methylation with a set of clinical features. All statistical analyses were performed with R software and SPSS software, and statistical significance was set at probability values of p < 0.05.
Results
Ferroptosis-related gene extraction
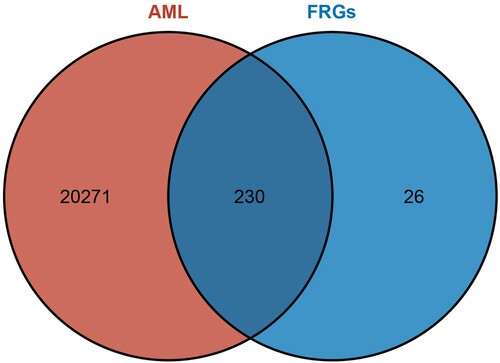
In this study, we used three FRGs data sets provided by the FerrDb database, including driver genes that promote ferroptosis, suppressor genes that prevent ferroptosis, and marker genes that indicate the occurrence of ferroptosis. Among them, four genes were listed as drivers and inhibitors simultaneously and were excluded from our study. Excluding the multi-annotated genes, 130 overlapping ferroptosis-related genes from the TCGA dataset and FRGs were selected for further analysis. The Wien diagram isshown in .
Figure 1. Wien diagram of FRGs and genes of AML in TCGA dataset
Construction of a prognostic signature
Populations of 154 patients from the TCGA dataset were identified and included in this study. The univariate Cox proportional hazards regression analysis showed that 20 genes had significant prognostic relevance (p < 0.05) (). GEPIA identified 6 genes that were differentially expressed between AML samples and normal samples (A-2F). Multivariate Cox proportional hazards regression analysis was further performed on the 6 genes, which screened AKR1C2 and SOCS1. The risk score for predicting overall survival was calculated as follows: Risk score=0.160* AKR1C2 + 0.383* SOCS1 (A). According to the risk score, patients were divided into low- and high-risk groups. Survival analysis showed that low-risk patients had longer OS and DFS than high-risk patients (median OS: 33.56 months vs. 14.04 months, p<0.0001; median DFS:26.79 months vs. 9.55 months, p<0.0001) (B、3C). The AUC of 3-year and 5-year os survival time roc curve analysis were 0.73 and 0.76, respectively (D).
Figure 2. The expression of the FRPGs between AML patients and their normal samples. A. AIFM2 B. AKR1C2 C. ENPP2 D. LPCAT3 E. MT1G. F. SOCS1. Red represents AML samples; Blue represents healthy control samples.
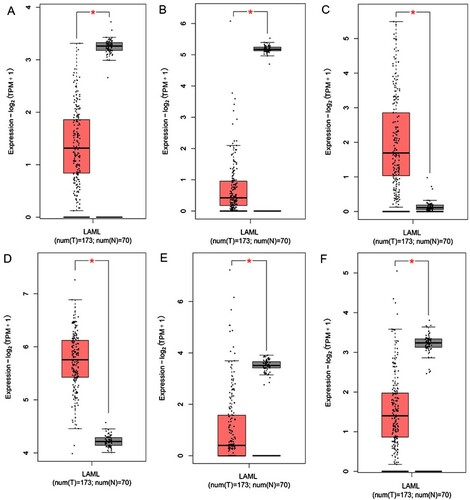
Figure 3. Survival prognosis model on the 2 FRPGs. A. Forest map of multivariate cox regression. B. Survival analysis showed that the patients in the high-risk group had worse overall survival than those in low-risk group in TCGA cohort. C. DFS analysis showed that the patients in the high-risk group had shorter DFS than those in low-risk group in TCGA cohort D. ROC analysis was performed to calculate the most optimal cutoff value to divide the AML patients into high risk and low risk group.
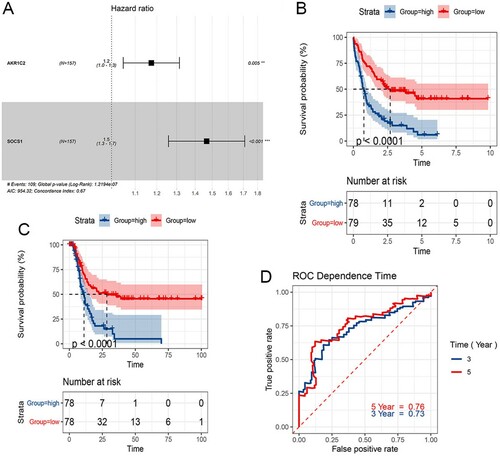
Table 1. Significant prognostic genes obtained by univariate Cox proportional hazards regression analysis.
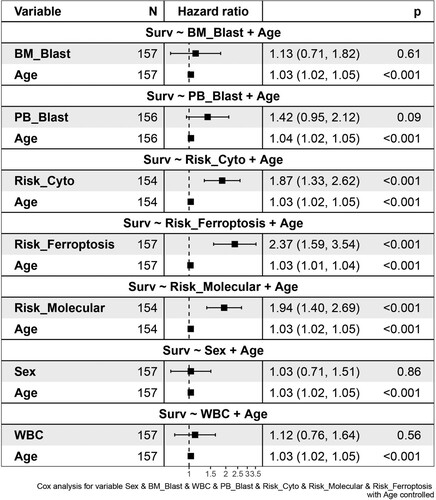
We then used age as a control variable to compare the risk score based on the 2 FRPGs with different clinical factors, such as BM blast percentage, PB blast percentage, cytogenetic risk, molecular risk, WBC count, and sex on survival. The results showed that risk scores based on 2 genes, cytogenetic stratification, and molecular stratification were more common than age factors and increased the occurrence of survival. The occurrence of BM blast percentage, PB blast percentage, WBC count, and sex were lower than that of age and did not affect the occurrence of survival ().
Figure 4. Cox Forest of the 2 FRPGs with different clinical features.
Validation of the prognostic value of the 2 FRPGs in AML patients with intermediate risk
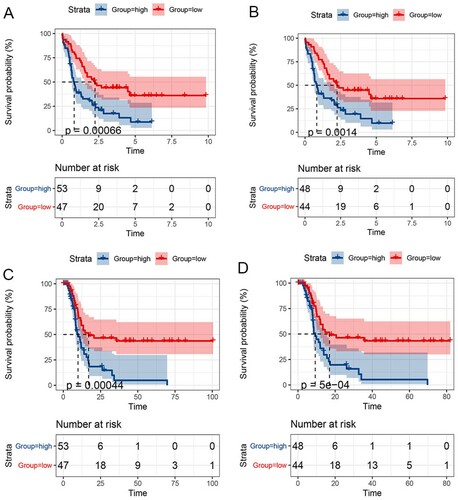
The prognostic model was further applied in patients at intermediate risk classified by the NCCN AML classification according to their molecular and cytogenetic risk status. We also found that among these intermediate-risk patients, those low-risk patients stratified according to FRPGs had longer overall survival than high-risk patients (median OS of patients stratified according to cytogenetic risk: 33.87 vs. 16.07 months, p<0.0007; median OS of patients stratified according to molecular risk: 33.73 vs. 16.69 months, p<0.0014, A, 5B). A similar and statistically significant trend of DFS was also observed (median DFS of patients stratified according to cytogenetic risk: 26.53 vs. 10.64 months, p<0.0004; median DFS of patients stratified according to molecular risk: 25.94 vs. 10.73 months, p<0.0001, C,5D).
Figure 5. Survival prognosis model on the 2 FRPGs in patients with intermediate risk. A. OS analysis of patients stratified according to cytogenetic risk. B. OS analysis of patients stratified according to molecular risk C. DFS analysis of patients stratified according to cytogenetic risk. D. DFS analysis of patients stratified according to molecular risk.
DNA methylation analysis of FRPGs
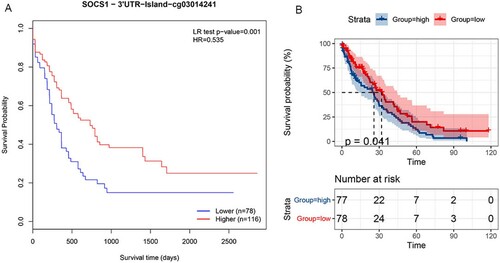
We explored the methylation status of AKR1C2 and SOCS1 genes and found that AKR1C2 has 4 methylation sites and SOCS1 has 24 methylation sites. A,6B clearly shows the distribution of CpG sites of each gene. Then Pearson correlation and Spearman's rho were used to analyzing the correlation between methylation and mRNA expression. We observed that two methylation sites were negatively correlated with gene expression. The relationship between methylation and mRNA expression is shown in A,7B. We then selected cg18841653 and cg03014241 CpG sites to investigate the prognostic values of these significant DNA CpG sites in patients with AML. Kaplan-Meier plots demonstrated that a high level of methylation of the cg03014241 CpG site was correlated with more favorable OS (A) among patients with AML (median OS: 25.24 vs. 22.93 months, P=0.001). Then, the AML patients in TCGA were dichotomized into low or high subgroups when divided by the median value of SOCS1 mRNA expression. In contrast to the effect of methylation on prognosis, survival analysis showed that a high level of mRNA expression was correlated with worse OS (B) among patients with AML (median OS: 22.93 vs. 25.24 months, p<0.041).
Figure 6. The heatmap of CpG sites of AKR1C2 and SOCS1 A. The distribution of CpG sites of AKR1C2. B. The distribution of CpG sites of SOCS1.
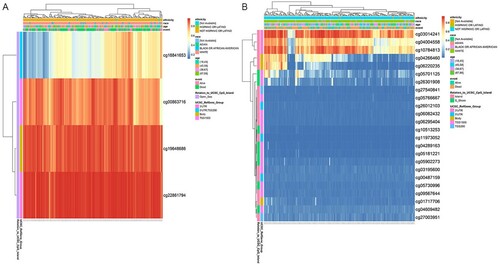
Figure 7. A. The relationship between methylation and AKR1C2 mRNA expression. B.The relationship between methylation and SOCS1 mRNA expression.
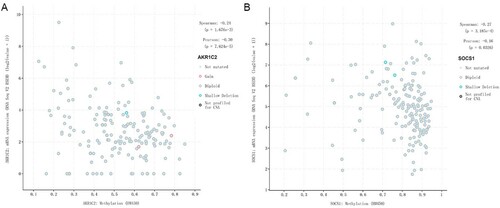
Figure 8. A. Kaplan-Meier plots of the cg03014241 CpG site. B. Kaplan-Meier plots of the SOCS1 expression.
We used the chi-square test to investigate the detailed association of FRPGs, AKR1C2, SOCS1 expression, and their methylation with a range of clinical features. As shown in , the FRPGs were correlated with age (P=0.005), cytogenetic type (P=0.031), risk_cytogenetic (P=0.001), and risk_molecular (P<0.001). The expression of SOCS1 was correlated with age (P=0.002) and FAB type (P=0.045). The methylation of SOCS1 cg03014241 CpG site was correlated with age (P=0.039), WBC count (P=0.023), PB_blast (P<0.001), and cytogenetic type (P=0.033). The FRPGs (P<0.001), AKR1C2 (P<0.001), and SOCS1 (P<0.001) expression, as well as SOCS1 methylation levels (cg03014241) (P<0.001) both affect the DFS time and OS time. Similarly, the expression of AKR1C2 (P<0.0001), the expression of SOCS1 (P<0.0001), and the SOCS1 methylation levels (cg03014241) (P=0.001) also affect the risk of FRPGs.
Table 2. Correlation between AKR1C2、SOCS1 mRNA expression/methylation、FRPGs、and clinical features in TCGA database.
GO and KEGG functional enrichment analysis
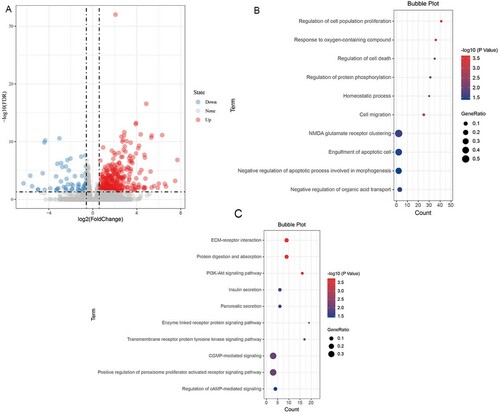
240 DEGs were found between high-riskand low-risk groups. The volcanic map of DEGs is shown in A. The results of functional and pathway enrichment analysis are shown in B, 9C. Gene Ontology (GO) analysis of DEGs showed that regulation of cell population proliferation, cell death, protein phosphorylation, cell migration, NMDA glutamate receptor clustering, and engulfment of the apoptotic cell, were mostly enriched. Among the functional and pathway enrichment analysis, ECM-receptor interaction, protein digestion, and absorption, PI3K-Akt signaling pathway, enzyme-linked receptor protein signaling pathway, transmembrane receptor protein tyrosine kinase signaling pathway, cGMP-mediated signaling, positive regulation of peroxisome proliferator-activated receptor signaling pathway, and cAMP-mediated signaling pathway were enriched most.
Figure 9. Functional and Pathway Enrichment Analysis of DEGs A. Volcanic maps of all genes. Red spot, the expression is up-regulated; Blue spot, the expression is down-regulated; Gray spot, no significantly dysregulated; The first 10 significantly differentially upregulated genes were labeled. B.The GO biological process enrichment analysis. C. The KEGG enrichment analysis.
PPI network and analysis on clusters
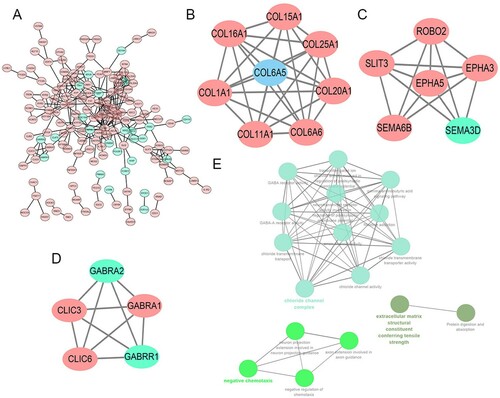
STRING mapped 240 DEGs into PPI network containing 154 nodes and 287 edges (A). Then MCODE was used to discover clusters in the network. 3 clusters were selected for GO term and KEGG pathway enrichment analysis. Among them, cluster 1 contained 8 nodes and 28 edges, with the highest score (B), cluster 2 contained 6 nodes and 14 edges (C), cluster3 contained 5 nodes and 10 edges (D). We then performed a functional analysis for the 3 important clusters using ClueGO. The results showed that chloride channel complex, negative regulation of chemotaxis, and extracellular matrix structural constituent conferring tensile strength were most enriched (E).
Figure 10. A. The PPI analysis of DEGs at STRING (https://string-db.org). B、C、D. Cluster analysis of the PPI network (B. Cluster1; C. Cluster2; D. Cluster3). E. GO and KEGG analyses on the 3 hub modules.
Discussion
In this study, we screened out the FRGs in AML based on TCGA and FerrDb datasets. We found the expression of AKR1C2 and SOCS1 were significantly different in AML samples and healthy control samples and were negatively related to the OS and DFS of the AML patients. We used age as a control variable to compare the risk score based on these 2 genes with different clinical factors and found that as the same as cytogenetic stratification and molecular stratification, risk based on these 2 genes was more common than age factors and increased the occurrence of survival. Moreover, we also verified the prognostic role of AKR1C2 and SOCS1 expression in patients with intermediate molecular and cytogenetic risk status in the NCCN AML classification. The results all emphasized the promising prognostic value of AKR1C2 and SOCS1 expression in AML patients. We compared the correlation between methylation and mRNA expression of AKR1C2 and SOCS1 genes and identified methylation sites that were negatively correlated with mRNA expression of these two genes. We also explored the prognostic role of methylation sites.
Aldo-keto reductases family 1 member C2 (AKR1C2), a member of the aldo/keto reductase superfamily. Previous studies have shown that its expression is selectively deleted in prostate and breast cancer and leads to clonal expansion of tumor cells. In addition, some studies have shown that its expression is negatively correlated with apoptosis-inducing factor (AIF), and is involved in the metastasis of liver cancer and the occurrence of NSCLC drug resistance [Citation18–20]. Suppressor of cytokine signaling 1 (SOCS1) is identified as a tumor suppressor gene. Silencing of SOCS1 expression due to promoter methylation has been found in several malignancies such as pancreatic cancer, breast cancer, lymphoma, and leukemia [Citation21–25]. There is a study mentioned that SOCS1 methylation leads to SOCS1 gene silencing, which promotes AML cell growth and proliferation by inhibiting the downstream JAK2/STAT signaling pathway [Citation26]. However, in our study, low expression of SOCS1 suggested a better prognosis. The specific role of SOCS1 methylation in AML still needs to be further investigated. Besides, no studies have been conducted on the prognostic effect of AKR1C2 and SOCS1 on AML. In this study, we systematically investigated the relationship between AKR1C2 and SOCS1 expression and survival using the TCGA database and found that low AKR1C2 and SOCS1 expression was highly correlated with more favorable OS and DFS in AML patients. Multivariate Cox regression further confirmed this conclusion, suggesting that low expression of AKR1C2 and SOCS1 is a strong prognostic factor for OS and DFS in AML patients. Finally, we further evaluated the overall prognostic value of ARK1C2 and SOCS1 in patients with a molecular and cytogenetic risk status of intermediate risk in the NCCN AML classification, proving that decreased expressions of ARK1C2 and SOCS1 are indeed associated with better OS and DFS in AML patients. Moreover, the expressions of ARK1C2 and SOCS1 are possible to further refine the risk stratification in clinic and to help accurately stratify patients with intermediate-risk. In conclusion, our analysis highlights that ARK1C2 and SOCS1 are promising biomarkers for predicting prognosis in patients with AML.
Increasing evidence has proved that abnormal DNA methylation plays a crucial role in the occurrence and development of cancers [Citation27,Citation28]. In our analysis, we first determined whether the methylation status of AKR1C2 and SOCS1 would affect their mRNA expression through Pearson correlation and Spearman's rho. There was a significant negative correlation between cg18841653 and cg03014241 CpG sites methylation and ARK1C2 and SOCS1 mRNA expression in AML. This negative correlation can well explain the low expression of AKR1C2 and SOCS1 in AML. We then investigated the prognostic significance of two selected CpG sites in AKR1C2 and SOCS1 DNA methylation and found that SOCS1 hypermethylation was strongly associated with better OS and PFS in AML patients. In summary, AKR1C2 and SOCS1 are negatively regulated by their methylation, and SOCS1 methylation status may be a strong indicator of good OS and PFS.
Ferroptosis is a new type of iron-dependent programed cell death. Its main mechanism is catalyzing the highly expressed unsaturated fatty acids on the cell membrane under the action of ferric divalent or esteroxylase, resulting in lipid peroxidation, thus inducing cell death [Citation12]. Ferroptosis involves in a variety of diseases, including inhibition of tumor cell growth [Citation29–31]. In our study, we divided patients into low and high-risk groups based on the expression of FRPGs and identified DEGs of the two groups. Functional enrichment analysis showed that DEGs enriched in regulation of cell death, unsaturated fatty acid metabolic process, PI3K-Akt signaling pathway, ECM-receptor interaction, regulation of cAMP-mediated signaling, and cGMP-mediated signaling pathway. Significantly, the metabolism of unsaturated fatty acids is associated with ferroptosis. PI3 K signaling pathway and ECM-receptor interaction are associated with cell differentiation, proliferation, and apoptosis [Citation32,Citation33]. The cAMP and cGMP-mediated signaling pathways are involved in regulating a variety of cellular physiological processes. However, although we have explored the biological processes involved in FRPGs in AML through enrichment analysis, how the expression of FRPGs and their methylation affect the prognosis of AML still needs to be further explored in biomedical experiments. Nevertheless, the role of FRPGs in the stratification of prognosis in AML is now clear. The more precise prognostic stratification, especially in patients with intermediate-risk is encouraging, and FRPGs are prognosis biomarkers worthy of further exploration.
Availability of data and materials
The clinical data, transcriptional data, along with methylation profiles of patients with AML are available in the TCGA database via the Cbioportal website (https://www.cbioportal.org/study/summary?id=laml_tcga_pub). The FRGs data are available in the FerrDb website (http://www.zhounan.org/ferrdb/index.html).
Acknowledgments
We acknowledge TCGA and FerrDb database for providing their platforms and contributors for uploading their meaningful datasets.
Disclosure statement
The authors declare that there is no conflict of interest regarding the publication of this paper.
Additional information
Funding
References
- Martelli MP, Sportoletti P, Tiacci E, et al. Mutational landscape of AML with normal cytogenetics: biological and clinical implications. Blood Rev. 2013;27(1):13–22.
- Dohner H, Estey E, Grimwade D, et al. Diagnosis and management of AML in adults: 2017 ELN recommendations from an international expert panel. Blood. 2017;129(4):424–447.
- Eisfeld AK, Kohlschmidt J, Mims A, et al. Additional gene mutations may refine the 2017 European LeukemiaNet classification in adult patients with de novo acute myeloid leukemia aged <60 years. Leukemia. 2020;34(12):3215–3227.
- Gregory TK, Wald D, Chen Y, et al. Molecular prognostic markers for adult acute myeloid leukemia with normal cytogenetics. J Hematol Oncol. 2009;2:23.
- Prada-Arismendy J, Arroyave JC, Rothlisberger S. Molecular biomarkers in acute myeloid leukemia. Blood Rev. 2017;31(1):63–76.
- Riva L, Luzi L, Pelicci PG. Genomics of acute myeloid leukemia: the next generation. Front Oncol. 2012;2:40.
- Cancer Genome Atlas Research Network, Ley TJ, Miller C, et al. Genomic and epigenomic landscapes of adult de novo acute myeloid leukemia. N Engl J Med. 2013;368(22):2059–2074.
- Jones PA, Baylin SB. The epigenomics of cancer. Cell. 2007;128(4):683–692.
- Boultwood J, Wainscoat JS. Gene silencing by DNA methylation in haematological malignancies. Br J Haematol. 2007;138(1):3–11.
- Ehrlich M. DNA hypomethylation, cancer, the immunodeficiency, centromeric region instability, facial anomalies syndrome and chromosomal rearrangements. J Nutr. 2002;132(8 Suppl):2424S–2429S.
- Galm O, Herman JG, Baylin SB. The fundamental role of epigenetics in hematopoietic malignancies. Blood Rev. 2006;20(1):1–13.
- Yang WS, Stockwell BR. Ferroptosis: death by lipid peroxidation. Trends Cell Biol. 2016;26(3):165–176.
- Mou Y, Wang J, Wu J, et al. Ferroptosis, a new form of cell death: opportunities and challenges in cancer. J Hematol Oncol. 2019;12(1):34.
- Zhou N, Bao J. Ferrdb: a manually curated resource for regulators and markers of ferroptosis and ferroptosis-disease associations. Database (Oxford). 2020;baaa021:1–8.
- Modhukur V, Iljasenko T, Metsalu T, et al. Methsurv: a web tool to perform multivariable survival analysis using DNA methylation data. Epigenomics. 2018;10(3):277–288.
- Shannon P, Markiel A, Ozier O, et al. Cytoscape: a software environment for integrated models of biomolecular interaction networks. Genome Res. 2003;13(11):2498–2504.
- Szklarczyk D, Franceschini A, Wyder S, et al. STRING v10: protein-protein interaction networks, integrated over the tree of life. Nucleic Acids Res. 2015;43(Database issue):D447–D452.
- Ji Q, Chang L, Stanczyk FZ, et al. Impaired dihydrotestosterone catabolism in human prostate cancer: critical role of AKR1C2 as a pre-receptor regulator of androgen receptor signaling. Cancer Res. 2007;67(3):1361–1369.
- Li C, Wu X, Zhang W, et al. AEG-1 Promotes metastasis through downstream AKR1C2 and NF1 in liver cancer. Oncol Res. 2015;22(4):203–211.
- Wang HW, Lin CP, Chiu JH, et al. Reversal of inflammation-associated dihydrodiol dehydrogenases (AKR1C1 and AKR1C2) overexpression and drug resistance in nonsmall cell lung cancer cells by wogonin and chrysin. Int J Cancer. 2007;120(9):2019–2027.
- Babar IA, Cheng CJ, Booth CJ, et al. Nanoparticle-based therapy in an in vivo microRNA-155 (miR-155)-dependent mouse model of lymphoma. Proc Natl Acad Sci U S A. 2012;109(26):E1695–E1704.
- Beaurivage C, Champagne A, Tobelaim WS, et al. SOCS1 in cancer: An oncogene and a tumor suppressor. Cytokine. 2016;82:87–94.
- Chen CY, Tsay W, Tang JL, et al. SOCS1 methylation in patients with newly diagnosed acute myeloid leukemia. Genes Chromosomes Cancer. 2003;37(3):300–305.
- Jiang S, Zhang HW, Lu MH, et al. MicroRNA-155 functions as an OncomiR in breast cancer by targeting the suppressor of cytokine signaling 1 gene. Cancer Res. 2010;70(8):3119–3127.
- Komazaki T, Nagai H, Emi M, et al. Hypermethylation-associated inactivation of the SOCS-1 gene, a JAK/STAT inhibitor, in human pancreatic cancers. Jpn J Clin Oncol. 2004;34(4):191–194.
- Zhang XH, Yang L, Liu XJ, et al. Association between methylation of tumor suppressor gene SOCS1 and acute myeloid leukemia. Oncol Rep. 2018;40(2):1008–1016.
- Chiappinelli KB, Strissel PL, Desrichard A, et al. Inhibiting DNA methylation causes an interferon response in cancer via dsRNA including endogenous retroviruses. Cell. 2017;169(2):361.
- Kottakis F, Nicolay BN, Roumane A, et al. LKB1 loss links serine metabolism to DNA methylation and tumorigenesis. Nature. 2016;539(7629):390–395.
- Guo J, Xu B, Han Q, et al. Ferroptosis: a novel anti-tumor action for Cisplatin. Cancer Res Treat. 2018;50(2):445–460.
- Ma S, Henson EE, Chen Y, et al. Ferroptosis is induced following siramesine and lapatinib treatment of breast cancer cells. Cell Death Dis. 2016;7(7):e2307.
- Yamaguchi Y, Kasukabe T, Kumakura S. Piperlongumine rapidly induces the death of human pancreatic cancer cells mainly through the induction of ferroptosis. Int J Oncol. 2018;52(3):1011–1022.
- Chen Y, Wan S, Li Q, et al. Genome-Wide integrated analysis revealed functions of lncRNA-miRNA-mRNA interaction in growth of intermuscular bones in megalobrama amblycephala. Front Cell Dev Biol. 2020;8:603815.
- Dou R, Qian J, Wu W, et al. Suppression of steroid 5alpha-reductase type I promotes cellular apoptosis and autophagy via PI3 K/Akt/mTOR pathway in multiple myeloma. Cell Death Dis. 2021;12(2):206.