
 ?Mathematical formulae have been encoded as MathML and are displayed in this HTML version using MathJax in order to improve their display. Uncheck the box to turn MathJax off. This feature requires Javascript. Click on a formula to zoom.
ABSTRACT
Objectives:
Multiple myeloma (MM) is one of the most common types of hematologic malignancy for which the underlying molecular mechanisms remain largely unclear. Dysregulated miRNA expression has been shown to be involved in MM tumorigenesis, progression and drug response. Therefore, a comprehensive analysis based on miRNA-level integrated strategy was performed.
Methods:
This study aimed to elucidate key miRNA signatures and pathways in MM by integrated bioinformatics analysis. Expression profiles GSE24371, GSE49261 and GSE54156 were obtained from the Gene Expression Omnibus database, and differentially expressed miRNAs (DEMirs) with p < 0.05 were identified. The target genes of these DEMirs were obtained from ENCORI database, and functional enrichment, subpathway enrichment and protein–protein interaction network construction were performed. The key target genes were identified by random walk algorithm and survival verification was performed.
Results
and discussion: First, six up-regulated and four down-regulated DEMirs shared between any two GSE data sets were identified. Second, target genes (DEMirTGs) by up-regulated and down-regulated DEMirs were obtained. Functional and subpathway enrichment analysis showed that these up-regulated DEMirs are consistently involved in the Wnt signaling pathway. Moreover, enrichment of the down-regulated DEMirs is mainly in the MAPK signaling pathway. Finally, a protein–protein interaction sub-network for these DEMirTGs was constructed, the correlations between the two key genes were identified and survival in MM was evaluated using multiple independent data sets.
Conclusion:
We identified miRNA signatures and key target genes that were closely related to MM biology, and these genes might serve as potential therapeutic targets for MM patients.
Introduction
Multiple myeloma (MM) is a plasma cell malignancy that predominantly affects the elderly, accounting for over 10% of hematologic cancers and ∼1% of all cancers [Citation1,Citation2]. In the symptomatic disease stage, its clinical features include anemia, hypercalcemia, renal dysfunction and bone lesions due to the clonal growth and accumulation of malignant plasma cells and the presence of a monoclonal immunoglobulin in the serum and/or urine [Citation1]. MM onset and evolution are driven by several chromosomal abnormalities, which have been included in the risk stratification algorithm for MM [Citation3]. Although the clinical outcomes of patients with MM have improved significantly in recent years, the prognosis of patients with MM remains poor [Citation4]. Furthermore, the outcomes of MM patients in different subgroups remain highly heterogeneous. In recent years, the use of proteasome inhibitors has improved the MM response rate, thus increasing the patient survival rate. Nevertheless, MM remains an incurable disease that can become drug resistant resulting in patient death [Citation5]. Thus, identifying molecular signatures is critically important for MM early diagnosis, prevention and personalized therapy.
To explore the MM formation or prognostic mechanism, some studies identified many signatures at the level of gene. Kuiper et al. [Citation6] identified a prognostic signature that contained 92 genes. Chng et al. [Citation7] identified a core signature combination (EMC92 + HZDCD) which provided a strategy of optimal risk estimation. In addition, a 42-gene expression signature was identified by a machine learning strategy and was applied to proteasome inhibitor treatment response [Citation8]. RNA sequencing data have also been recently used to identify gene-based signatures [Citation9]. In addition to single gene or gene set as signatures, many other researches applied network analysis strategies to explore the MM biological mechanism. For example, a weighted co-expression network was constructed based on gene expression profiles for identifying prognostic signatures [Citation10]. A novel network model for myeloma constructed in 2017 identified a novel 4-gene prognostic signature that leads to improved diagnosis and therapeutic alternatives [Citation11]. Liu et al. constructed an MM molecular causal network and explored the potential links between drug-response sub-networks and prognostic sub-networks [Citation12]. However, most of these studies focused only on the coding genes to detect the MM inner mechanism and neglected the important roles of noncoding RNAs (ncRNAs).
Compared with mRNAs, the ncRNAs displayed more tissue-specific in normal organ development or disease formation. As a major type of ncRNA, the microRNAs (miRNAs), small single-stranded 22 nucleotide RNA molecules [Citation13], have critical roles in many kinds of tumor types, including MM [Citation14]. Based on the high-throughput expression profiles, Lionetti et al. [Citation15] defined a network of putative functional miRNA regulatory relationships for the analysis of MM biological mechanisms. A study examining the expression levels of 365 miRNAs and gene expression profiling in 60 MM patients revealed that miR-1 and miR-133a were specifically over-expressed in the MM patients with the chromosomal translocation t(14; 16) [Citation16]. Other miRNAs including miR-15a/miR-16 [Citation17], miR-92a [Citation18], miR-135b [Citation19], miR-144/miR-199 [Citation20] and miR-26a [Citation21] have been shown to be involved in MM biology by low-throughput experiments. Robak et al. [Citation22] recently assessed the miRNA expression patterns in the serum of MM patients treated with bortezomib and developed a 21-miRNA based prediction model to assess their personalized treatment. However, most miRNA-level results are based on a single cohort study, creating poor reproducibility and consistency. To overcome these disadvantages, integrated bioinformatics methods should be combined with miRNA expression profiling techniques.
In the current study, we downloaded three microarray data sets, GSE24371, GSE49261 and GSE54156, from the NCBI-Gene Expression Omnibus database (NCBI-GEO), including miRNA expression data for purified plasma cell samples from 66 patients with MM and 25 healthy controls. We identified differentially expressed miRNAs (DEMiRs) by integrating multiple data sets, and obtained the target genes (DEMirTGs) of these DEMiRs using The Encyclopedia of RNA Interactomes (ENCORI) database. The Gene Ontology (GO) and KEGG subpathway enrichment analysis were performed. Furthermore, a protein–protein interaction (PPI) sub-network for these DEMirTGs was constructed and a random walk algorithm was applied to identify key target genes in MM. Finally, two gene signatures were identified based on network algorithm and their survival predictive performance was further verified in multiple independent data sets. In conclusion, identifying DEMiRs and their regulated pathways may help reveal potential biomarkers for the diagnosis and prognosis of MM patients.
Materials and methods
Microarray data information and DEMir identification
The miRNA expression profiles GSE24371, GSE49261 and GSE54156 were obtained from NCBI-GEO. The microarray data of GSE24371 are based on GPL10385 platforms and include purified plasma cell samples from 37 newly diagnosed patients with MM and 9 healthy controls. The GSE49261 data are based on GPL17759 platforms and include purified plasma cell samples from 20 newly diagnosed MM patients and nine healthy controls. The GSE54156 data are based on GPL16770 platforms and include purified plasma cell samples from nine newly diagnosed MM patients and seven healthy controls. T-test was used to calculate the p-values for DEMirs between patients with MM and healthy controls. False discovery rate adjusted p-values were calculated by using the Benjamini–Hochberg correction. In this study, genes with adjusted p-value of < 0.05 were defined as DEMirs, and up-regulated or down-regulated were decided by expression levels of corresponding miRNAs.
Target genes identification
The potential target genes of DEMirs were predicted by ENCORI, which provides platforms to analyze miRNA target, RNA–RNA and RBP–target interactions from multi-dimensional data [Citation23]. In this study, the genes screened by at least five predicted data sets simultaneously were considered as the target genes of DEMirs.
GO and subpathway enrichment analysis
GO analysis was performed using EnrichGO function in clusterProfiler R package [Citation24]. False discovery rate adjusted p-values were calculated by using the Benjamini–Hochberg correction. KEGG analysis was performed by using EnrichKEGG function in clusterProfiler R package. False discovery rate adjusted p-values were calculated by using the Benjamini–Hochberg correction. We performed the subpathway identification based on DEMirTGs by up-regulated and down-regulated DEMirs using subpathwayMiner R package [Citation25]. Parameters used in this process were defined as the default value: k = 3. P-value of < 0.05 was considered statistically significant. All the genes in global network get a score after random walk algorithm and were sorted in descending order. Then, GSEA analysis was performed based on these descending genes using clusterProfiler R package again.
PPI sub-network establishment and modular analysis
The data of PPI networks described previously [Citation26] were derived from 12 databases, including BioGRID, DFCI_NET_2016, HI-II-network, HPRD, InnateDB, INstruct, IntAct, KinomeNetworkX, MINT, PhosphoSitePlus, PINA and SignaLink2.0. For the robustness of analysis, the interactions between proteins found in at least two data sets were considered as the final PPI networks, which contained 12,512 protein nodes and 83,065 interactions. The sub-network of DEMirTGs targeted by DEMirs involved in the global PPI network was constructed. Cytoscape software version 3.7.1 was applied to establish the sub-network. MCODE, a plug-in in Cytoscape, was utilized to screen the modules from the sub-network and identify the three most significant modules based on the MCODE score and node number.
Random walk algorithm based on global PPI network
Based on the global PPI network which was contained from at least two data sets, we further performed a global risk impact analysis to optimize DEMirTGs by using the random walk algorithm [Citation27]. We, respectively, annotated DEMirTGs by up-regulated and down-regulated DEMirs into this global network and regarded these genes as seed nodes. The random walk algorithm was then used to evaluate the global risk impact of seed nodes on each component as follows:
where
is the column-normalized adjacency matrix of the global PPI network, which consisted of 0 and 1.
is a vector, in which a node in the global network held the probability of finding itself in this process up to step t. The initial probability vector,
, was constructed in such a way, where equal probabilities were assigned to all seed nodes and the sum of their probabilities was equal to 1. Additionally, the restart of the walker at each step was the probability, r (r = 0.7). When the difference between
and
fells below 10−6, the probabilities reached a steady state. Finally, each gene component in the global PPI network was given a score according to the values in the steady-state probability vector,
.
MM-related genes
We obtained MM-related genes from the Genetic Association Database (GAD) database (https://geneticassociationdb.nih.gov/). The disease search strategy is keyword ‘Multiple Myeloma’. We finally obtained 163 MM-related genes. Also, we obtained MM prognostic genes from six published papers, which contained a total of 158 genes. These two kinds of genes were labeled in the sub-network of up-regulated and down-regulated DEMirTGs.
Independent MM gene data sets with survival information
To further test the survival performance of key genes identified by random walk algorithm, we obtained five independent gene expression profiles with available patient survival information. These five data sets were GSE2658, GSE4204, GSE4452, GSE4581 and GSE57317, which contained 559, 538, 65, 414 and 55 MM patients. The survival information including survival event and survival time of corresponding patients were obtained from the Series Matrix Files.
Results and discussion
Screening for DEMirs in MM
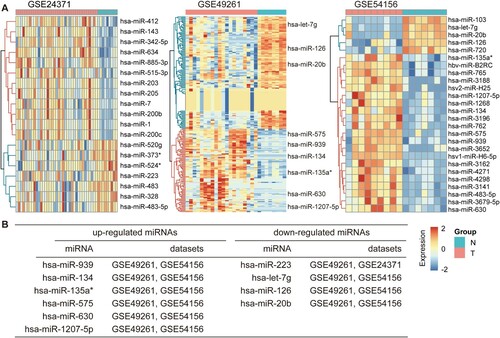
We obtained miRNA expression profiles of purified plasma cell samples from newly diagnosed patients with MM and healthy controls from the GSE24371, GSE49261 and GSE54156 data sets and identified DEMirs using the T-test method (see Materials and methods). Setting the cut-off criterion as adjusted p-value of < 0.05, we identified 19, 207 and 26 DEMirs from GSE24371, GSE49261 and GSE54156, respectively. A, respectively, shows that these DEMirs depicted as heatmap and were well clustered between patients with MM and healthy controls. Employing integrated analysis, we identified six up-regulated DEMirs and four down-regulated DEMirs as common to the two of the three data sets (B). miR-939, miR-134, miR-135a*, miR-575, miR-630 and miR-1207-5p are the up-regulated miRNAs in MM. Previous studies have revealed that the elevated expression levels of miR-134-5p in MM samples were validated in qRT-PCR analysis [Citation28]. The consistent up-regulation of miR-135a* and miR-630 was also observed in human MM cell lines [Citation29] and some down-regulated DEMirs were also related with MM formation and progression, especially miR-126. In an miRNA profiling experiment of t(4; 14) MM cells, it was found that miR-126* specifically targets the 3′-UTR of c-MYC, decreasing its protein levels by inhibiting translation [Citation30], showing the involvement of this miRNA in MM biology. The integration of multiple data sets displayed robust and advantages over single data set. Moreover, our findings provided some novel miRNA signatures, such as miR-939 and miR-20b. The detailed results of these DEMirs in these data sets are provided in Table S1.
Figure 1. Identification of DEMirs in three cohort profile data sets (GSE24371, GSE49261 and GSE54156). (A) Heatmap of the DEMirs within each of these three data sets. (B) Commonly changed DEMirs in the three data sets. DEMirs, differentially expressed miRNAs.
Prediction of DEMirTGs of DEMirs and functional enrichment analysis
To elucidate DEMirs’ regulatory mechanism in MM, target genes were predicted using ENCORI online tool. We predicted target genes for up-regulated and down-regulated DEMirs using at least five online miRNA target genes prediction programs simultaneously based on the ENCORI website. Among these DEMirs, the target genes of two up-regulated DEMirs (miR-135a-5p and miR-134-5p) and four down-regulated DEMirs (let-7g, miR-20b-5p, miR-223-3p and miR-126-3p) were obtained, and the union of target genes for DEMirs was considered as DEMirTGs (Figure S1 and Table S2). The target genes of four up-regulated DEMirs were not obtained for the following analysis, and some low-throughput experiments were further needed for biological exploration. Subsequently, 292 up-regulated DEMirTGs and 926 down-regulated DEMirTGs were obtained for the following analysis.
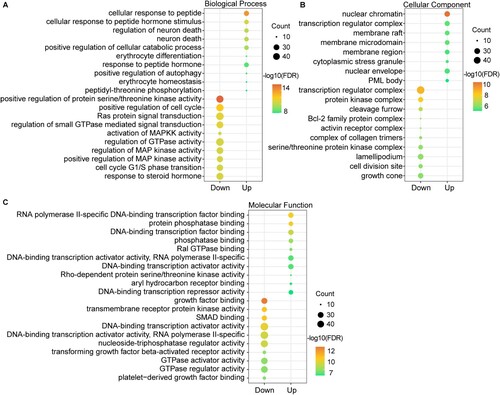
Based on these DEMirTGs, we further performed GO and KEGG pathway enrichment analysis to explore the biological roles of DEMirs. As shown in and Table S3, the DEMirTGs were examined according to three subontologies: BP, CC and MF. At the aspect of BP, the up-regulated DEMirTGs were enriched in ‘cellular response to peptide’, ‘positive regulation of autophagy’ and the down-regulated DEMirTGs were enriched in ‘positive regulation of cell cycle’, ‘Ras protein signal transduction’ and ‘activation of MAPKK activity’ terms. Previous study has found that myeloma cells increased the death of osteocyte through the up-regulation of both apoptosis and autophagy processes [Citation31]. For CC, enrichment of up-regulated DEMirTGs was primarily in the nuclear chromatin and membrane region, and that of down-regulated DEMirTGs was mainly in the transcription factor complex part. Up-regulated genes in MF are mainly involved in ‘protein phosphatase binding’ and ‘Ral GTPase binding’ and the down-regulated genes are mainly involved in ‘growth factor binding’. Many growth factor-associated proteins were reported to be involved in MM formation and prognosis. For example, insulin-like growth factor binding protein (IGFBP7) is linked to poor prognosis in MM [Citation32]. RAL GTPases mediated MM cell survival which was independent of oncogenic RAS, showing the involvement of Ral GTPase binding in MM [Citation33]. Also, we performed the KEGG pathway enrichment analysis. As shown in Figure S2, the up-regulated DEMirTGs were enriched in ‘Human T-cell leukemia virus 1 infection’ pathway, and down-regulated DEMirTGs were enriched in ‘Proteoglycans in cancer’ and ‘TGF-beta signaling pathway’. Leukemia and MM were two similar blood diseases, and many common regulatory mechanisms of miRNAs might be shared. The inhibition of TGF-beta signaling could enhance bone formation and suppress the cell growth of MM [Citation34]. These findings revealed that these biological functions or pathways were involved in the MM formation and progression processes.
Figure 2. Top five GO term enrichment analysis of DEMirTGs targeted by up-regulated DEMirs and down-regulated DEMirs. GO analysis of DEMirTGs consists of three subontologies, biological process (A), molecular function (B) and cellular component (C).
Identification of biological subpathways for DEMirTGs
The whole pathway contained several pathway regions, named subpathways. Previous studies have revealed that the dysregulation of subpathways, not whole pathways, was involved in multiple kinds of diseases [Citation25]. Therefore, we further identified the biological subpathways based on up-regulated and down-regulated DEMirTGs. As shown in and Table S4, the up-regulated DEMirTGs were enriched in many subpathways (_6 and _7) from Amphetamine addiction, and subpathways (_30 and _31) from Hepatitis B pathway. It was observed that hepatitis B virus was reactivated in the patients with MM [Citation35], and our results provided a new biological interpretation at the subpathway level. However, some tumor-related functions were identified from down-regulated DEMirTGs, including subpathways from MAPK signaling pathway, cell cycle and bladder cancer and these subpathway functions were also identified in the GO enrichment analysis mentioned above. Also, the Met-induced MAPK signaling has shown to be essential for proliferation, migration and invasion. The MAPK signaling pathway is associated with MM cell proliferation and survival [Citation36]. Interestingly, one subpathway (path: 05200_10) from pathways in cancer was both identified by up-regulated and down-regulated DEMirTGs, showing that the genes within this module might be associated with MM biological processes.
Table 1. Top five significant subpathways enriched by up-regulated and down-regulated DEMirTGs.
PPI sub-network construction and modular analysis
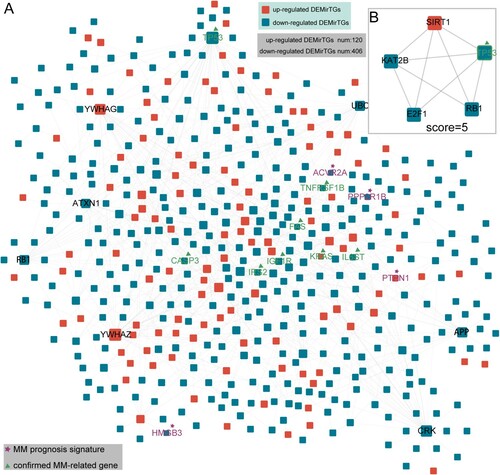
Based on the PPI network, we further constructed a PPI sub-network among up-regulated and down-regulated DEMirTGs, which contained 120 up-regulated and 406 down-regulated genes, as shown in A. Many hub genes within this network included ATXN1, APP and CRK. Furthermore, we obtained known MM-related genes from GAD database and MM prognostic genes from six published researches (see Materials and methods, Table S5). As a result, the PPI sub-network contained many MM-related genes, including IGF1R, CASP3, KRAS and prognostic genes, including PTPN1 and HMGB3. By utilizing cluster analysis of the sub-network in Cytotype MCODE, we identified one significant module based on the degree of importance, which contained five nodes and nine edges (one up-regulated and four down-regulated DEMirTGs, (B)). This module contained hub gene, TP53, which was also known as MM-related genes and other genes within this module such as KAT2B and SIRT1 might also be associated with MM formation or prognosis. The genes (SIRT2 and SIRT3) from the same family with SIRT1 were correlated with redox imbalance and advanced clinical stage in MM patients in recent research [Citation37]. Previous findings revealed that target strategy on SIRT1 can inhibit the proliferation of MM cells [Citation38], and the expression level of SIRT1 was also associated with poor prognosis of diffuse large B-cell lymphoma [Citation39].
Figure 3. Protein–protein interaction (PPI) network of DEMirTGs and module analysis. (A) Based on the global PPI database, a sub-network was constructed containing 526 DEMirTGs (120 up-regulated DEMirTGs colored in red and 406 down-regulated DEMirTGs colored in blue). Known MM-related genes from GAD database and prognostic genes from published papers were also labeled. (B) Identification of module based on the degree of importance. DEMirTGs, differentially expressed miRNA target genes; PPI, protein–protein interaction.
Random walk analysis for identifying candidate gene signatures
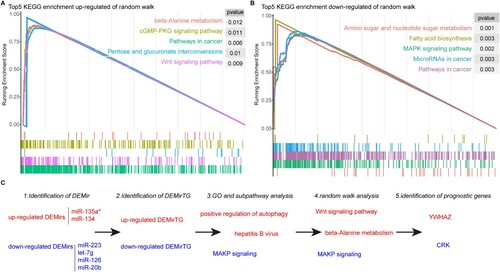
We further optimized the up-regulated and down-regulated DEMirTGs based on the global PPI network using the random walk algorithm (see Materials and methods), which can be applied to several aspects including risk gene optimization or signature selection. The human PPI networks which contained edges supported by at least two resources were regarded as background networks and the up-regulated and down-regulated DEMirTGs were, respectively, annotated into the global network and regarded as the seed nodes in the random walk algorithm. After a random walk for up-regulated and down-regulated genes, each node in the global network was given a score, reflecting the final relationship with seed nodes. The higher a score is, the higher the probability of this node to be MM risk signatures. The detailed results of the random walk algorithm are provided in Table S6. Firstly, we performed GSEA analysis based on the gene score to explore the biological roles driven by random walk. As shown in , both up-regulated and down-regulated random walks were enriched in many tumor pathways, such as pathways in cancer and microRNAs in cancer. Moreover, the up-regulated results were specifically enriched in beta-alanine metabolism and Wnt signaling pathway, and the down-regulated results were enriched in MAPK signaling pathway, which was consistent with previous subpathway results (see (C)). As a result, the top five genes from up-regulated random walk analysis were YWHAZ, YWHAG, SP1, ARL4D and PRPF40A and the top five genes from down-regulated analysis were CRK, APP, ATXN1, TP53 and GRB2. Among these genes, the TP53 was known MM risk genes, and the others were novel candidate gene signatures. In the following analysis, we treated the top one gene from up-regulated DEMirTGs (YWHAZ) and down-regulated DEMirTGs (CRK) as the candidate MM signatures.
Figure 4. The top five KEGG pathways in GSEA analysis for random walk results by up-regulated DEMirTGs (A) and down-regulated DEMirTGs (B). (C) Major findings and overall workflow of this study.
Survival analysis of candidate key genes
To explore the survival performance of these two candidate gene signatures, we further obtained five gene expression profiles with available patient survival information. As shown in , these two gene signatures all displayed significantly predictive value in these five verification data sets. In detail, YWHAZ (top one in up-regulated genes) displayed as risk prognostic factor in five data sets (GSE2658: P-value < .001; GSE4202: P-value < .001; GSE4452: P-value = .005; GSE4581: P-value = .001; GSE57317: P-value = .014). CRK (top one in down-regulated genes) displayed as protective prognostic factor in five data sets (GSE2658: P-value = .016; GSE4202: P-value = .019; GSE4452: P-value = .026; GSE4581: P-value = .008; GSE57317: P-value = .012). In one previous study, the authors performed the gene expression analysis based on samples from MM and extramedullary relapse of MM, YHHAZ was significantly deregulated between high-risk plasma cells and extramedullary plasma cells [Citation40]. However, there were currently no related studies to report the associations between CRK and MM biological roles, showing our novel findings of the CRK signature. All these findings confirmed the candidate signatures identified from global network algorithm analysis were indeed related with MM patient prognosis, displaying their potential roles for MM clinical use.
Table 2. The survival performance of two candidate gene signatures in multiple independent data sets.
Conclusion
miRNAs have a key role in MM biology. Indeed, many miRNA expression signatures have been identified as potential MM prognostic biomarkers. However, the detailed biological roles of miRNAs in MM patients remain unclear. In this study, we performed a comprehensive bioinformatics analysis based on three miRNA expression profiles. Several DEMirs involved in MM were identified and the biological functions of these DEMirs were explored by their target genes. Furthermore, we constructed a sub-network for these DEMirTGs and candidate key genes were optimized by using global network analytical method. The prognostic performance of the candidate genes was confirmed in multiple independent gene expression profiles. This is the first study to comprehensively explore the MM formation and prognosis based on large scale of miRNA-level integration analysis. Our data increase the understanding of the miRNA-level molecular or functional features that underlie MM initiation and progression. Furthermore, candidate signatures identified potential therapeutic targets for MM clinical use.
Supplemental Material
Download Zip (1.1 MB)Acknowledgements
The authors thank the GEO databases for the availability of the data.
Disclosure statement
No potential conflict of interest was reported by the author(s).
Data availability
The data that support the findings of this study are available in GEO at https://www.ncbi.nlm.nih.gov/geo/. These data were derived from the following resources available in the public domain: GSE24371, GSE49261 and GSE54156 for MM miRNA analysis, GSE2658, GSE4204, GSE4452, GSE4581 and GSE57317 for MM gene survival verification.
Additional information
Funding
References
- Palumbo A, Anderson K. Multiple myeloma. N Engl J Med. 2011;364(11):1046–1060.
- Pawlyn C, Morgan G. Evolutionary biology of high-risk multiple myeloma. Nat Rev Cancer. 2017;17(9):543–556.
- Palumbo A, Avet-Loiseau H, Oliva S, et al. Revised international staging system for multiple myeloma: a report from International Myeloma Working group. J Clin Oncol: Official J Am Soc Clin Oncol. 2015;33(26):2863–2869.
- Cejalvo M, de la Rubia J. Clinical treatment of newly diagnosed multiple myeloma. Expert Rev Hematol. 2015;8(5):595–611.
- Sonneveld P, Avet-Loiseau H, Lonial S, et al. Treatment of multiple myeloma with high-risk cytogenetics: a consensus of the International Myeloma Working group. Blood. 2016;127(24):2955–2962.
- Kuiper R, Broyl A, de Knegt Y, et al. A gene expression signature for high-risk multiple myeloma. Leukemia. 2012;26(11):2406–2413.
- Chng W, Chung T, Kumar S, et al. Gene signature combinations improve prognostic stratification of multiple myeloma patients. Leukemia. 2016;30(5):1071–1078.
- Mitra A, Harding T, Mukherjee U, et al. A gene expression signature distinguishes innate response and resistance to proteasome inhibitors in multiple myeloma. Blood Cancer J. 2017;7(6):e581.
- Zamani-Ahmadmahmudi M, Nassiri S, Soltaninezhad F. Development of an RNA sequencing-based prognostic gene signature in multiple myeloma. Br J Haematol. 2021;192(2):310–321.
- Liu X, Yin X, Meng X, et al. Development and validation of a 9-gene prognostic signature in patients with multiple myeloma. Front Oncol. 2018;8:615.
- Laganà A, Perumal D, Melnekoff D, et al. Integrative network analysis identifies novel drivers of pathogenesis and progression in newly diagnosed multiple myeloma. Leukemia. 2018;32(1):120–130.
- Liu Y, Yu H, Yoo S, et al. A network analysis of multiple myeloma related gene signatures. Cancers (Basel). 2019;11(10):1452, doi: https://doi.org/10.3390/cancers11101452.
- Kaikkonen M, Lam M, Glass C. Non-coding RNAs as regulators of gene expression and epigenetics. Cardiovasc Res. 2011;90(3):430–440.
- Ling H, Fabbri M, Calin G. MicroRNAs and other non-coding RNAs as targets for anticancer drug development. Nat Rev Drug Discov. 2013;12(11):847–865.
- Lionetti M, Biasiolo M, Agnelli L, et al. Identification of microRNA expression patterns and definition of a microRNA/mRNA regulatory network in distinct molecular groups of multiple myeloma. Blood. 2009;114(25):e20–e26.
- Gutiérrez N, Sarasquete M, Misiewicz-Krzeminska I, et al. Deregulation of microRNA expression in the different genetic subtypes of multiple myeloma and correlation with gene expression profiling. Leukemia. 2010;24(3):629–637.
- Zhang L, Zhou L, Shi M, et al. Downregulation of miRNA-15a and miRNA-16 promote tumor proliferation in multiple myeloma by increasing CABIN1 expression. Oncol Lett. 2018;15(1):1287–1296.
- Yoshizawa S, Ohyashiki J, Ohyashiki M, et al. Downregulated plasma miR-92a levels have clinical impact on multiple myeloma and related disorders. Blood Cancer J. 2012;2(1):e53.
- Umezu T, Tadokoro H, Azuma K, et al. Exosomal miR-135b shed from hypoxic multiple myeloma cells enhances angiogenesis by targeting factor-inhibiting HIF-1. Blood. 2014;124(25):3748–3757.
- Gupta N, Kumar R, Seth T, et al. Targeting of stromal versican by miR-144/199 inhibits multiple myeloma by downregulating FAK/STAT3 signalling. RNA Biol. 2020;17(1):98–111.
- Hu Y, Liu H, Fang C, et al. Targeting of CD38 by the tumor suppressor miR-26a serves as a novel potential therapeutic agent in multiple myeloma. Cancer Res. 2020;80(10):2031–2044.
- Robak P, Dróżdż I, Jarych D, et al. The value of serum MicroRNA expression signature in predicting refractoriness to bortezomib-based therapy in multiple myeloma patients. Cancers (Basel). 2020;12(9):2569.
- Li J, Liu S, Zhou H, et al. Starbase v2.0: decoding miRNA–ceRNA, miRNA–ncRNA and protein–RNA interaction networks from large-scale CLIP-Seq data. Nucleic Acids Res. 2014;42:D92–D97.
- Yu G, Wang L, Han Y, et al. Clusterprofiler: an R package for comparing biological themes among gene clusters. Omics J Integr Biol. 2012;16(5):284–287.
- Li C, Li X, Miao Y, et al. Subpathwayminer: a software package for flexible identification of pathways. Nucleic Acids Res. 2009;37(19):e131.
- Cheng F, Kovács I, Barabási A. Network-based prediction of drug combinations. Nat Commun. 2019;10(1):1197.
- Köhler S, Bauer S, Horn D, et al. Walking the interactome for prioritization of candidate disease genes. Am J Hum Genet. 2008;82(4):949–958.
- Li J, Zhang M, Wang C. Circulating miRNAs as diagnostic biomarkers for multiple myeloma and monoclonal gammopathy of undetermined significance. J Clin Lab Anal. 2020;34(6):e23233.
- Bi C, Chung T, Huang G, et al. Genome-wide pharmacologic unmasking identifies tumor suppressive microRNAs in multiple myeloma. Oncotarget. 2015;6(28):26508–26518.
- Min D, Ezponda T, Kim M, et al. MMSET stimulates myeloma cell growth through microRNA-mediated modulation of c-MYC. Leukemia. 2013;27(3):686–694.
- Toscani D, Bolzoni M, Ferretti M, et al. Role of osteocytes in myeloma bone disease: anti-sclerostin antibody as new therapeutic strategy. Front Immunol. 2018;9:2467.
- Bolomsky A, Hose D, Schreder M, et al. Insulin like growth factor binding protein 7 (IGFBP7) expression is linked to poor prognosis but may protect from bone disease in multiple myeloma. J Hematol Oncol. 2015;8:10.
- Seibold M, Stühmer T, Kremer N, et al. RAL GTPases mediate multiple myeloma cell survival and are activated independently of oncogenic RAS. Haematologica. 2020;105(9):2316–2326.
- Matsumoto T, Abe M. TGF-β-related mechanisms of bone destruction in multiple myeloma. Bone. 2011;48(1):129–134.
- Tsukune Y, Sasaki M, Komatsu N. Reactivation of Hepatitis B virus in patients with multiple myeloma. Cancers (Basel). 2019;11(11):1819.
- Lentzsch S, Chatterjee M, Gries M, et al. PI3-K/AKT/FKHR and MAPK signaling cascades are redundantly stimulated by a variety of cytokines and contribute independently to proliferation and survival of multiple myeloma cells. Leukemia. 2004;18(11):1883–1890.
- Allegra A, Innao V, Polito F, et al. SIRT2 and SIRT3 expression correlates with redox imbalance and advanced clinical stage in patients with multiple myeloma. Clin Biochem. 2021;93:42–49.
- Lu B, Zhang D, Wang X, et al. Targeting SIRT1 to inhibit the proliferation of multiple myeloma cells. Oncol Lett. 2021;21(4):306.
- Jang K, Hwang S, Kwon K, et al. SIRT1 expression is associated with poor prognosis of diffuse large B-cell lymphoma. Am J Surg Pathol. 2008;32(10):1523–1531.
- Sevcikova S, Paszekova H, Besse L, et al. Extramedullary relapse of multiple myeloma defined as the highest risk group based on deregulated gene expression data. Biomed Pap Med Fac Univ Palacky Olomouc Czech Repub. 2015;159(2):288–293.