
ABSTRACT
Objective
Long non-coding RNAs (lncRNAs) are involved in tumorigenesis and play a key role in cancer progression. To determine whether lncRNAs are involved in extramedullary disease of multiple myeloma (EMD), we analyzed the expression profile of lncRNAs in EMD.
Methods
Three pairs of EMD patients and their intramedullary MM cells were screened by microarray first. We extracted data from gene chips and made an identification of lncRNAs and mRNAs with significant differences between EMD group and non EMD group. WGCNA confirmed the EMD related gene module and drew a heat map to further determine the key gene lncRNA-NEAT1. In the meantime, bone marrow and extramedullary samples (hydrothorax and ascites) were collected from 2 MM patients and subjected to single-cell RNA-seq. Single cell Transcriptome analysis was conducted to verify the gene expression difference of malignant plasma cells derived from intramedullary and extramedullary. Then we verified high expression level of lncRNA-NEAT1 in EMD patients by using quantitative real-time PCR (qRT-PCR) and analyzed the correlation between expression patterns and survival and molecular genetics analysis of the LncRNA (NEAT1) involved in MM patients. At last, cell experiments were conducted to observe the effects of down-regulation of NEAT1on the proliferation, cell cycle and PTEN pathway related proteins of multiple myeloma cell lines U266 and RPMI8226.
Results
We identified one of the EMD related key gene is lncRNA-NEAT1. Compared with patients without extramedullary lesions, intramedullary MM cells in EMD patients expressed NEAT1 highly. The outcome of parallel single-cell RNA sequencing (RNA-seq) revealed NEAT1 level of plasma cells came from pleural effusion /ascites increased significantly compared with myeloma-stricken bone marrow. By survival and molecular genetic analysis, NEAT1 gene expression was not associated with OS and PFS in MM patients. However, the expression of NEAT1 is related to adverse therapeutic reactions and the progression of MM. We found that the expressions of NEAT1 were negatively associated with albumin levels and were positively associated with gain of chromosome 1q, IGH-CCND1, IGH@-FGFR3/WHSC1,and IGH-MAF gene fusion, respectively. At the level of cell experiment, CCK-8, soft agar clone formation experiment and CFSE staining showed that down regulating NEAT1 could inhibit the proliferation of U266 and RPMI8226 cells; Cell cycle detection showed that down-regulation of NEAT1 would interfere with the cell cycle process, and RPMI 8226 cells were blocked in G1 phase. Western blot analysis showed that when the expression of NEAT1 was down regulated in U266 and RPMI 8226 cells, the expression of PTEN and p-PTEN (phosphorylated phosphatase and tensin homologue) was up-regulated, and the expression of PI3K, p-PI3K (human phosphorylated inositol 3 kinase), Akt, p-Akt (phosphorylated protein kinase B).
Discuccion and conclusion
This study provides novel insights into the lncRNA-NEAT1 and reveals that NEAT1 maybe a potential lncRNA biomarkers in EMD.
Introduction
Multiple myeloma (MM) is the prototype of neoplasia in which the interaction between malignant plasma cells and the microenvironment confines the disease to the bone marrow (BM) and the skeleton. Some patients with MM develop the extramedullary disease (EMD) [1]. Previous studies have shown that EMD has poor outcomes [2]. To date, there is no established optimal approach for the treatment of MM with EMD, especially for relapsed/refractory multiple myeloma (RRMM) with EMD. Also, the studies on the molecular pathogenesis of EMD have not elucidated the mechanisms underlying the aforesaid heterogeneity. Understanding the molecular nature of EMD is a pivotal step in ameliorating early diagnosis, predicting prognosis, and developing effective therapeutics.
Recently, long noncoding RNAs (lncRNAs) have been shown to play critical roles on the molecular mechanism of hematopoietic malignancies [3–5]. Various lncRNAs are implicated in MM. For example, a transcriptional dynamics analysis of lncRNAs in the context of normal B-cell maturation identified 989 lncRNAs with exclusive expression in MM, among which 89 showed de novo epigenomic activation. Knockdown studies on one of these lncRNAs, SMILO (specific myeloma intergenic long noncoding RNA), resulted in reduced proliferation and induction of apoptosis of MM cells, as well as the activation of the interferon pathway [6]. The expression levels of PVT1 (a lncRNA located adjacent to the gene MYC) and MYC were significantly higher in MM than in monoclonal gammopathy of undetermined significance (MGUS) and were positively correlated with disease progression [7]. Several studies on the pathogenesis of MM have established that abnormal lncRNAs played a critical role in cancer development. However, only a few studies have explored the lncRNAs in EMD.
Thus, the present study compared the expression profiles of lncRNAs and mRNAs in malignant plasma cells (PCs) in soft tissue mass at the relapse stage with plasma cells from BM at diagnosis, with a focus on the role of lncRNAs on EMD across evolution. We found that lncRNA-nuclear enriched abundant transcript 1 (NEAT1) plays a critical role on extramedullary progression.
Materials and methods
EMD definition. MM was diagnosed according to the criteria of the International Myeloma Working Group [8]. EMD was identified at the time of enrollment in the study with the diagnostic procedures required by the patient’s specific protocol, such X-ray skeletal survey, magnetic resonance imaging (MRI), computed tomography (CT), or a histological confirmation.
Patients and samples collection. BM specimens were obtained from patients at the Department of Hematology, the First Affiliated Hospital of Nanjing Medical University. This study was approved by the Medical Ethics Committee of The Jiangsu Provincial Hospital, and written informed consent was obtained from allguardians.
BM mononuclear cells were isolated using lymphocyte separation liquid within 8 h after BM samples were harvested. For the isolation of plasma cells (PCs), all BM samples from MM patients were treated by density-gradient centrifugation, purified by CD138-coated magnetic beads (Miltenyi Biotec), and stored at −80°C. To wane the variation among samples, BM specimens from iron-deficiency anemia (IDA) patients were used as controls.
Three patients with extramedullary lesions underwent surgical resection of soft tissue masses. The soft tissue masses were collected, stored at −80°C for 2 h after the operation, investigated using RNA sequencing technology, and analyzed to evaluate the expression level of lncRNAs and mRNAs.
The procedure of dissemination and preparation of hydrothorax and ascites cells. After using 40-micron sterile strainers to filter, the hydrothorax or ascites sample were then centrifuged at 350× g for 5 min. Then the supernatant was discarded, and the sediment was resuspended in 1 ml PBS (HyClone). Afterwards, the GEXSCOPE® red blood cell lysis buffer (RCLB, Singleron) was added, and the mixture [Cell: RCLB = 1:2 (volume ratio)] was incubated at room temperature for 5–8 min to remove red blood cells.
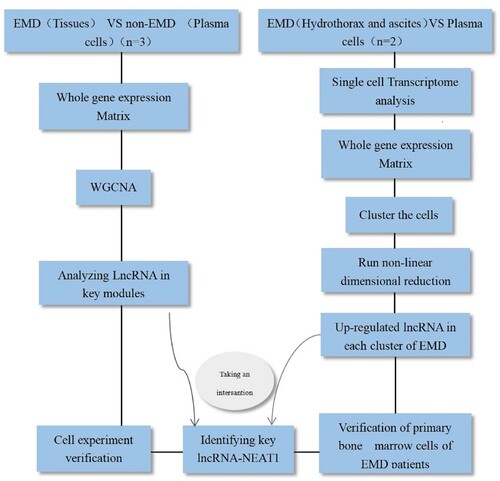
The design process of the study was as follows ().
Figure 1. The chip experiment process.
Microarray data profile. The specimens collected in this study were sequenced at the Shanghai Bohao Biotechnology Co., Ltd. SBC lncRNA chip (human 4 × 180 k) was used in this study, with 6 samples.
Mapping and identification of differentially expressed genes (DEGs). The original data were normalized by Gene Spring software, and the differential genes were screened by fold-change and Student’s t-test. The DEGs were identified based on the following criteria: (i) Fold-change (linear) ≤ 0.5 and fold-change (linear) ≥ 2; (ii) T-test P-value < 0.05 or < 0.01. The DEGs among different groups were visualized by volcano map, and heat map. The statistical heatmap of the two groups was constructed using Cluster (version 3.0) software to show the differences among genes.
Weighted gene coexpression network analysis (WGCNA). Information about tumor status (intramedullary and extramedullary) was selected to screen meaningful coexpression modules related to the occurrence of extramedullary lesions. The module trait correlation was based on the module and the trait determined by Pearson’s relevant tests, and the module was analyzed when p ≤ 0.05. The differential expression module of the hub gene in intramedullary and extramedullary lesions was defined as DEG and analyzed further.
RT & Amplification & Library Construction. Single-cell suspensions (2 × 10⁵ cells/mL) with PBS (HyClone) were loaded onto microwell chip using the Singleron Matrix® Single Cell Processing System. Barcoding Beads are subsequently collected from the microwell chip, followed by reverse transcription of the mRNA captured by the Barcoding Beads and to obtain cDNA, and PCR amplification. The amplified cDNA is then fragmented and ligated with sequencing adapters. The scRNA-seq libraries were constructed according to the protocol of the GEXSCOPE® Single Cell RNA Library Kits (Singleron). Individual libraries were diluted to 4 nM, pooled, and sequenced on Illumina novaseq 6000 with 150 bp paired end reads.
Primary analysis of raw read data. Raw reads from scRNA-seq were processed to generate gene expression matrixes using CeleScope (https://github.com/singleron-RD/CeleScope) v1.9.0 pipeline. Briefly, raw reads were first processed with CeleScope to remove low quality reads with Cutadapt v1.17 to trim poly-A tail and adapter sequences. Cell barcode and UMI were extracted. After that, we used STAR v2.6.1a to map reads to the reference genome GRCh38 (ensembl version 92 annotation). UMI counts and gene counts of each cell were acquired with featureCounts v2.0.1 software, and used to generate expression matrix files for subsequent analysis.
Quality control, dimension-reduction and clustering. Cells were filtered by gene counts below 200 and the top 2% gene counts and the top 2% UMI counts. Cells with over 20% mitochondrial content were removed. Only filtered cells can be used for downstream analysis. We used functions from Seurat v3.1.2 for dimension-reduction and clustering. Then we used NormalizeData and ScaleData functions to normalize and scale all gene expression, and selected the top 2000 variable genes with FindVariableFeautres function for PCA analysis. Using the top 20 principle components, we separated cells into multiple clusters with FindClusters. Batch effect between samples was removed by Harmony. Finally, tSNE algorithm was applied to visualize cells in a two-dimensional space.
Reverse transcription-quantitative polymerase chain reaction (qRT-PCR). qRT-PCR was performed to detect the expressions of lncRNAs NEAT1, NEAT1v2, P53, and COL1A1 in PC. Total RNA was extracted from plasma cells using TRIzol™ Reagent (Thermo Fisher Scientific) and then reverse transcribed using PrimeScript™ RT reagent Kit (Perfect Real Time) (TaKaRa). Subsequently, qPCR was performed using SYBR® Premix DimerEraser™ (TaKaRa) to quantify the expression of NEAT1, NEAT1v2, P53, and COL1A1. In addition, the expression of lncRNA NEAT1, NEAT1v2, P53, and COL1A1 was calculated using 2−ΔΔCt against GAPDH as the internal reference. Primers are listed in .
Table 1. Real-time quantitative PCR primer sequences used in this study.
Cell culture. MM cell lines U266 and RPMI8226 were a kind gift by Professor Huang Hongming of Nantong University. The cells were cultured in RPMI1640 medium (Invitrogen, Carlsbad, CA, USA) with 10% fetal bovine serum (FBS, Invitrogen) at 37°C, 95% humidity, and 5% CO2 in an incubator. All cells were divided into NC and ASO-NEAT1 groups.
Transient transfection. U266 and RPMI8226 cells were cultured to a certain density and transfected with ASO-NEAT1/NC using Lipofectamine 3000 (Invitrogen), according to the manufacturer’s instructions. The sequences of NEAT1 ASO primers were as follows: ASO-NEAT1 (5’-TAGTAACAAACCACGGTCC-3’) (Shanghai GenePharma Co., Ltd). The transfection efficiency was verified by qRT-PCR.
Cell counting kit-8 (CCK-8) assay. U266 and RPMI8226 cells prepared with different treatments were counted. Subsequently, 2000 cells/well were inoculated in a 96-well plate in five replicates. Then. 10 µL CCK-8 reagent was added to each well, incubated at 37°C for 1 h, and the absorbance was determined at OD450 on a microplate reader. This protocol was followed for 4 consecutive days. The growth curve was plotted, and the results were analyzed statistically. All assays were carried out three times.
Soft agar clone formation experiment. RPMI1640 medium (1.5 mL) containing 0.5% agarose was allowed to solidify in the 6-well cell culture plate. The MM cell lines in the blank and experimental groups were suspended into single cells, and the corresponding number of cells was added to 0.5% agarose in RPMI1640 medium with 0.35% agarose planted as the lower glue on the 6-well plate. Each well corresponds to 2000 cells, 1. 5 ml of medium. After solidification at room temperature, 2 mL of RPMI1640 complete medium (containing 10% FBS and 1% penicillin–streptomycin) was added to the upper layer. The cells were cultured in a 5% CO2 incubator at 37°C and supplemented with fresh RPMI1640 complete medium every 3 days. The experimental results were observed after 2 weeks.
Cell cycle assay. The grouping treatment was the same as above. The cells were washed with pre-cooled phosphate-buffered saline (PBS) and mixed with 300 μL suspension buffer. An equivalent of 1×10⁶ cells/mL/well was seeded in a 24-well plate and cultured in a 5% CO2 incubator at 37°C for 24 h. Then, the cells were fixed at 4°C overnight in 75% ethanol and collected and washed with PBS at 1000 rpm for 2 min. Subsequently, 200 μL Annexin V-FITC was added to the cell suspension, followed by 20 μL PI staining solution in the dark at 200 rpm in an ice bath for 45 min before detecting the changes in the cell cycle.
Western blot. Total protein was isolated from MM cells using radioimmunoprecipitation assay (RIPA) buffer (Sigma–Aldrich), and the concentration was determined using the BCA protein assay kit (Shanghai). Proteins were separated by SDS-PAGE and transferred to polyvinylidene fluoride (PVDF) membranes. After blocking with 5% skimmed milk in TBST for 2 h, the membranes were probed with primary antibodies: Phospho-Akt (Ser473) (Cell Signaling #4060, USA), Akt(pan) (Cell Signaling #4691), PTEN(D4.3) (Cell Signaling #9188), Phospho-PTEN(Ser380) (Cell Signaling #9551), Phospho-PI3 kinase p85(Tyr458)/p55(Tyr199) (Cell Signaling #4228), PI3 Kinase p85(19H8) (Cell Signaling #4257), CDK4 (Proteintech #11026-1-AP. USA), CDK6 (Proteintech #14052-1-AP), Rabbit β-Actin (HuaBio, ET1701-80, China) at 4°C overnight, followed by incubation with goat anti-rabbit secondary antibody (HuaBio, G201221, China) at room temperature for 2 h. Odyssey near-infrared laser imager was used for imaging and post-processing analysis.
Statistical analysis. Data were analyzed using the unpaired Student’s t-test to compare the different states of MM, while paired Student’s t-test were used to compare peripheral blood (PB) and BM. Kaplan–Meier survival analysis and log-rank test were utilized to assess the overall survival (OS) and progression-free survival (PFS) of MM patients with differential gene expression. All experiments were conducted at least three times. The differences between groups were evaluated using Student’s t-test for continuous variables. P-value < 0.05 was considered statistically significant. Cell distribution comparisons between two groups were performed using unpaired two-tailed Wilcoxon rank-sum tests. Comparisons of gene expression or gene signature between two groups of cells were performed using unpaired two-tailed Student’s t test. Comparisons of cell distribution of paired groups were performed using paired two-tailed Wilcoxon rank-sum tests. All statistical analyses and presentation were performed using R.and PRISM 7.0a (GraphPad, La Jolla, CA, USA).
Results
Landscape of lncRNA and mRNA expression in EMD and BM
To identify the changes in the expression levels of lncRNAs and mRNAs, total RNA was extracted from extramedullary involvement of 3 MM patients at relapse and PCs in their BM at diagnosis. The array encompasses 77103 lncRNAs and 18853 mRNAs from data sources, such as GENCODE V21, Ensembl, LNCipedia v3.1, Lncrnadb, Noncode v4, UCSC. Volcano plots were used to assess the variation of gene expression between BM and EMD. A total of 4269 lncRNAs displayed differential expression in the two groups, including 2111 upregulated lncRNAs and 2158 downregulated lncRNAs ((A,C)). Of the 3634 mRNAs that showed differential expression, 2131 were upregulated, and 1503 were downregulated ((B,D)).
Figure 2. Expression profiles of mRNAs and long non-coding RNAs (lncRNAs) in primary plasma myeloma cells and extramedullary lesions. Volcano Plot of the differentially expressed LncRNAs (A) and mRNAs (B) in primary plasma myeloma cells and extramedullary lesions. The red and green points in the plot represent differentially expressed lncRNAs with statistical significance. Heat map and hierarchical clustering dendrogram of lncRNA (C) and mRNA (D) chips.
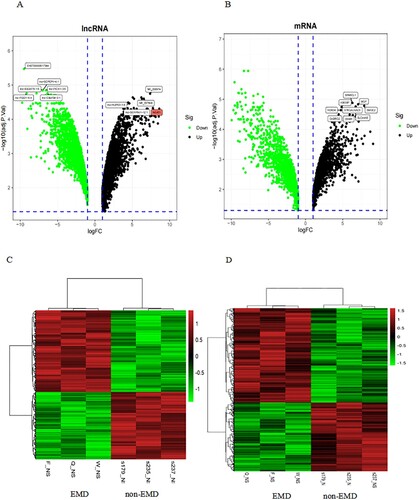
Also, hierarchical clustering analysis was employed to detect the differential expressions of lncRNAs and mRNAs. The data suggested that the expression of lncRNAs and mRNAs in EMD differed from those in BM.
Weighted gene coexpression network of extramedullary lesions in MM
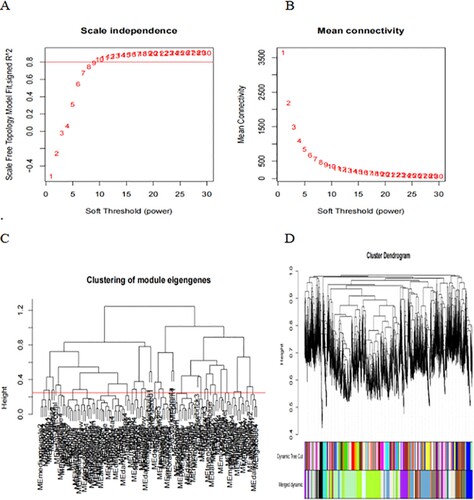
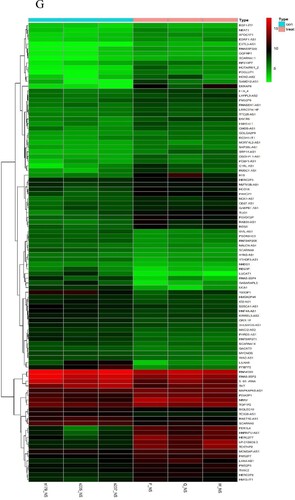
First, the data were input, and the genes with little or no change in the expression in either of the samples were removed. Then, the samples with missing values were filtered out. The mean FPKM value was 0.5. Sample tree was established and loaded with morphology data, i.e. intramedullary and extramedullary tissues and cells. The samples were clustered, a scale-free network was established, and a power value was set. The power value in this study was 15 ((A)), indicating good connectivity ((B)). Next, Tom matrix was built, the genes were clustered, and the dynamic cutting module was identified. The minimum number of genes in the module was 50. The correlation of modules was computed to establish an association between the modules ((C)), and similar modules were merged ((D)). The dynamic cut tree method was used to identify the gene modules, and those with high similarity were combined to calculate the values of MM (gene module correlation) and GS (gene clinical correlation), which are drawn on a scatter plot for output. Also, the data of MM, GS, and the corresponding genes of each module were output. The results of 25 modules ((E)) were obtained, including 6 modules related to EMD (correlation value > 0.6, P-value < 0.01). Finally, we showed one of the most correlated green-yellow modules (correlation = 0.94, P < 1e-200, F), and 98 lncRNAs in this module were extracted to draw the heat map.
Figure 3. WGCNA establishes gene module process. Construction of gene scale-free network (A–B). Visualization of correlation between modules (C). Module merging with high similarity (D). Module and trait data correlation heat map (E). The scatter diagram (F) of green-yellow module related to EMD is filtered according to mm-gs value. Heat map of 98 lncRNAs in green-yellow module (G).
A single-cell transcriptomic atlas of bone marrow and myelomatous pleural effusions or ascites from multiple myeloma patients
To profile the cellular characteristics associated with myeloma progression, we applied parallel single-cell RNA sequencing (RNA-seq) to myeloma-stricken bone marrow or extramedullary sites. One patient contributed BM tissue and hydrothorax, the other patient provided bone marrow and ascites cells.
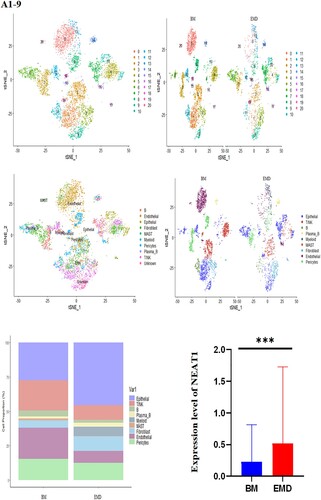
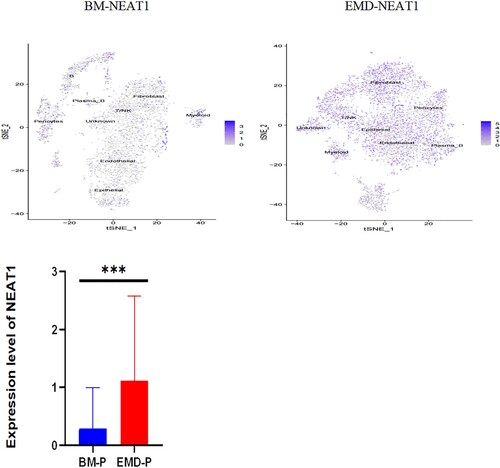
The gathered transcriptome analysis of 2 samples originating from bone marrow and pleural effusion revealed distinct populations of diverse cell clusters infiltration. Using hierarchical clustering, we identified 20 specific cell clusters that could be divided into 9 major types: Epithelial, T/NK, B, Plasma-B, Myeliod, MAST, Fibroblast cells and Endothelial populations ((A1–4)). Consistent with previous data [8,9], we observed a significant enrichment in NK/ T and endothelial groups in the diseased BM, as well as a relative decrease in epithelial and fibroblast cells and the extramedullary group showed a high level of NEAT1 expression ((A5,6)). The results indicated that increased expression of NEAT1 in plasma B cells of extramedullary lesion tissue ((A7–9)).
Figure 4. The landscape in myeloma-stricken bone marrow or extramedullary sites (pleural effusions and ascites). tSNE plots, colored by sample (A1–2, B1–2). t-SNE representation of cells clusters identified in the CD45+population (A3–4, B3–4),Cell type specification was validated by SingleR. Histogram of cell proportion of intramedullary and extramedullary specimens (A5, B5). Comparison of NEAT1 expression between intramedullary and extramedullary groups (A6, B6). The expression and distribution of NEAT1 in distinctive clusters of BM and hydrothorax and ascites cells (A7–9, B7–9).
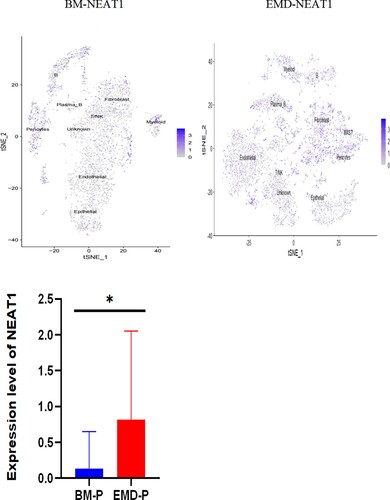
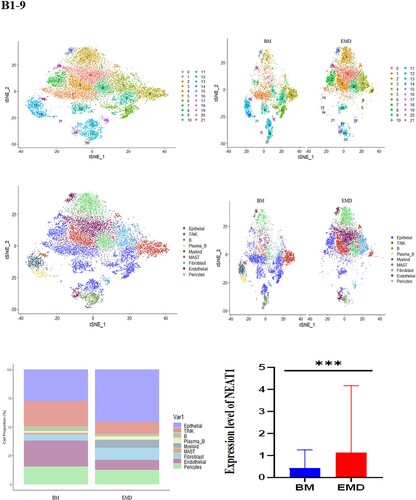
Likewise, we analyzed 11,808 cells from BM cells of the second patient who is under EMD conditions at our facility, as well as 9218 cells from his ascites. tSNE projection visualized these cells with distinctive patient-specific clusters, which contained 21 different cell populations that could be divided into 9 subgroups: Epithelial, T/NK, B, plasma-B, Myeloid, MAST, Fibroblast, Endothelial, Pericytes ((B1–4)). The cell percentage of T/NK cells in the two samples was not significantly different ((B5)). Similarly, the composition of intramedullary and extramedullary cells in this patient is different and the result showed that NEAT1 was highly expressed in extramedullary lesions ((B6,7)). The NEAT1 level of plasma cells came from pleural effusion increased significantly ((B7–9)). These results indicate that NEAT1 is closely related to the evolution of extramedullary lesions.
NEAT1 is upregulated in extramedullary lesions but not associated with the outcome of patients
NEAT1 ranked second in the heatmap ((G)) and was upregulated in multiple gene sets in the EMD group ((E–I)). We also verified the putative coexpression association of COL1A1 with the anti-cancer gene p53. The significant expression of NEAT1, p53, and COL1A1 was verified in the BM of 10 MM patients (5 cases without extramedullary lesions and 5 patients with EMD) and 5 controls. The expression of NEAT1 gene in patients with EMD was different from that in healthy individuals and those without extramedullary lesions, while that of COL1A1 and p53 genes did not differ significantly (). We analyzed the level of NEAT1 from three MM cohorts by using the ONCOMINE database. To examine the relationship between the NEAT1 and theprognosis of patients with MM, the link between overall survival, progress free survival and the diferentially expressed level of NEAT1 in MM patients was analyzed by Kaplan–Meier method. The difference in NEAT1 expression did not affect OS and PFS in MM patients ((A,B)). The expression of NEAT1 is related to adverse therapeutic reactions and the progression of MM. We found that the expressions of NEAT1 were negatively associated with albumin levels and were positively associated with gain of chromosome 1q, IGH-CCND1, IGH@-FGFR3/WHSC1,and IGH-MAF gene fusion, respectively ((C1–7)).
Figure 5. Expression of P53, NEAT1, NEAT1V2, COL1A1 in samples from patients with newly diagnosed EMD, non-EMD, and controls. NEAT1 and NEAT1V2 were significantly upregulated in primary plasma cells with EMD.
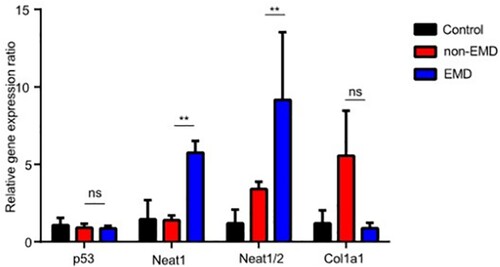
Figure 6. Correlation between NEAT1 expression and overall survival (A)/progression-free survival (B) of multiple myeloma patients (n = 225). Relationship between the expression level of NEAT1 in patients of MM and different clinical parameters in patients in each Oncomine data set (C1–7) (*p < 0.05, **p < 0.01, ***p < 0.005).

NEAT1 knockdown inhibited myeloma cell proliferation in vitro
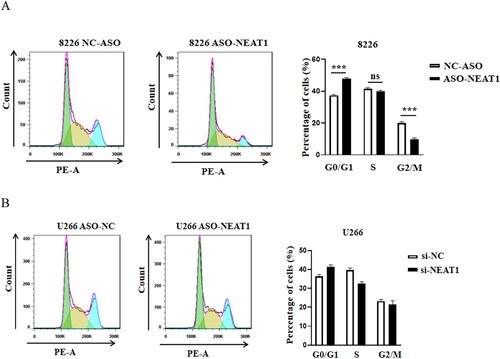
First, we reviewed the literature and found that NEAT1 was highly expressed in U266, RPMI8226 cells [10]. Next, we screened the interference fragment with the best interference effect (sequence 5’-TAGTAACAAACCACGGTCC-3’) and knocked down NEAT1 in MM cells U266 and RPMI8226 by RNAi. Consequently, the expression of NEAT1 decreased significantly, indicating a successful establishment of interference cell lines ((A–D)). This finding confirmed that the cell proliferation ability decreased significantly after downregulating the expression of NEAT1 in MM cell lines (E–H). Also, decreased expression of NEAT1 induced cell apoptosis and cell cycle arrest in the GO/G1 phase in RPMI8226 cells ((A,B)).
Figure 7. Changes of cell proliferation after down regulating the expression level of NEAT1 in RPMI 8266 and U226 cells. The expression levels of NEAT1 and NEAT1v2 in RPMI 8266 (A–B)/U266 cells (C–D) were different before and after NEAT1 knockdown. The viability of U226 (E) and RPMI 8266 (F) cells was detected by CCK-8. Effect of knockdown of NEAT 1 on soft agar cloning of RPMI 8266 (E) and U266 (F) cells. Agar clone formation assay was performed to detect proliferation of RPMI 8266 (G) and U266 cells (H) with low expression of NEAT1.**p < 0.01, ***p < 0.001.
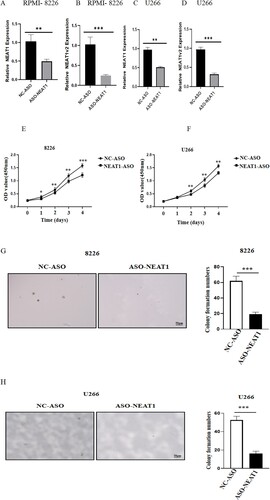
Figure 8. Effect of knockdown of NEAT1 on cell cycle of multiple myeloma cell lines RPMI8266 (A) and U226 (B). **p < 0.01, ***p < 0.001, NC indicates no statistical difference. Mann–Whitney test, n = 3.
NEAT1 is involved in the activation of the PI3K/Akt/PTEN pathway
After NEAT1 knockdown in U266 and RPMI8226 cells for 24 h, we found that the expression of p-Akt and p-PI3K of RPMI8226 were downregulated, and the expression of p-PTEN was upregulated (p < 0.05) ((A,B)). In addition, the expression of PTEN was enhanced in the experimental group of RPMI8226 cells, while the expression of CDK4 and CDK6 was downregulated in the ASO-NEAT1 group of U266 cells ((C,D)).
Figure 9. NEAT1 affects the activation of the PI3K/Akt/PTEN pathway in RPMI 8226(A–B) and U266(C–D) cells.

Discussion
EMD occurred in 6–37% of MM patients, and the frequency increased during the course of the disease [11]. The incidence was up to 70% in autopsy studies [12]. The mechanisms of extramedullary spread in MM are not well-understood. Moreover, high-risk cytogenetics are significantly enriched in MM with EMD, and studies consistently showed that EMD is associated with poor outcomes [1,13]. To date, the pathogenesis of EMD is largely unclear. Thus, developing new biomarkers of EMD to provide a basis for targeted therapy in the future is essential.
LncRNAs have been underestimated for several years, and their role on extramedullary lesions has not yet been explored. We determined the distinctive expression patterns of the transcripts of plasma cells between EMD and BM. The array consists of 4269 lncRNAs that displayed differential expression in the two groups, including 2111 upregulated lncRNAs and 2158 downregulated lncRNAs, indicating an intensive involvement of lncRNAs in EMD development. First, we simplified the complex transcript network by modularization. The GO and KEGG pathway analyses divided the lncRNA and mRNAs into several functional modules related to cell proliferation, hematopoiesis, and cancer, thereby asserting the validity of the microarray. Then, WGCNA was used to draw the key modules and identify the key lncRNA-NEAT1 within EMD development.
NEAT1 is an lncRNA that regulates gene expression by binding to the promoter of the active chromatin sites [14, 15]. Previous studies have shown that aberrant expression of NEAT1 is related to MM [16]. Taiana et al. reported that NEAT1 targets the downregulated genes involved in DNA repair processes, including the homologous recombination pathway, which in turn results in massive DNA damage. NEAT1 silencing by novel LNA-gapmeR antisense oligonucleotide inhibited MM cell proliferation and triggered apoptosis in vitro and in vivo murine MM model [10]. Another study reported that NEAT1 was highly expressed in MM patients and cell lines. Decreased expression of NEAT1 inhibits the PI3K/AKT pathway to suppress cell proliferation, promote apoptosis, and inhibit cell cycle. Moreover, the reduced expression of NEAT1 significantly inhibited tumor formation in vivo [17]. These findings were consistent with our results, but some studies had contradictory results. Strikingly, several studies have reported that NEAT1 could be used as a tumor suppressor gene. Rostami et al. demonstrated that NEAT1 expression was significantly lower in acute myeloid leukemia (AML) patients compared to healthy controls, and increased expression of NEAT1 gene might play a role on the apoptosis of AML cells [18]. NEAT1 expression was also decreased in primary chronic myeloid leukemia (CML) cells. Suppression of BCR-ABL expression or its kinase activity upregulated NEAT1 expression. Nonetheless, the effect of NEAT1 on the biological function of MM with EMD has been rarely reported.
Several comprehensive studies of myeloma genomes confirmed the heterogeneity of myeloma tumors and identified potential pathways and mutations for further investigation [19]. The common mutations accompanying progression include multiple chromosomal losses [10,11] including deletion of RB112-14 and TP53 and amplification of chromosome 1q [20]. In this study, we found that the expression level of NEAT1 was positively correlated with the gain of chromosome 1q and treatment response, respectively. NEAT1 upregulation might evolve from premalignant stages (such as MGUS) and progress to symptomatic MM and PCL. Strikingly, NEAT1 presented excellent value in distinguishing EMD patients from MM patients without extramedullary lesions. This phenomenon was consistent with the previous studies, suggesting that lncRNA NEAT1 is an oncogenic gene in MM pathology and can potentially be a biomarker for predicting disease evolution [17,21,22].
The dysregulation of PTEN/PI3K/Akt signaling pathway is closely related to the occurrence and development of tumors [10]. PTEN is a tumor suppressor gene discovered recently. Another study showed that the knockdown of NEAT1 suppresses laryngocarcinoma cell growth and metastasis via miR-524-5p/HDAC1/PTEN/AKT signaling pathway [23]. In addition, NEAT1 has been identified as an upstream modulator or downstream effector of major signaling pathways, including the PTEN/PI3K/AKT/mTOR, RAS/RAF/MEK/ERK, WNT/β-catenin, and p53, influencing endometrial cancer metastasis [24]. Loss of PTEN function leads to the overactivation of PI3K/Akt pathway and promotes the development of various tumors [25]. Recent studies demonstrated that many molecular signaling pathways regulate gene expression at the transcriptional, posttranscriptional, and epigenetic levels and are involved in tumor initiation, metastasis, and drug resistance [26–28]. Nonetheless, there is no evidence associating PTEN with the extramedullary migration of MM. Herein, we found that after downregulation of lncRNA-NEAT1 in RPMI8226 and U266 cells, the expression of PTEN protein was significantly upregulated, and the expression of p-PI3K and p-Akt protein was significantly downregulated, suggesting that NEAT1 regulates the Akt signaling pathway through PTEN.
Many comprehensive studies of myeloma genomes have confirmed the heterogeneity of myeloma tumors, and identified potential pathways and mutations of interest for further Study [19]. An early event in myelomagenesis is the dysregulation of Cyclin D1. This dysregulation results from primary immunoglobulin heavy chain (IgH) translocations with partners MMSET/FGFR3, CCND1,CCND3, cMAF, and MAFB2-7 or an alternative pathway of chromosomal hyperdiploidy. Beyond these initiating events, common mutations that accompany progression include: multiple chromosomal losses [11, 29], including deletion of RB11,12,14 and TP53, amplification of chromosome 1q [20]. We found that the expression level of NEAT1 was positively correlated with gain of chromosome 1q, IGH-CCND1, IGH@-FGFR3/WHSC1, and IGH-MAF gene fusion, treatment response, respectively. However, little study was able to address genomic changes over time and specifically changes that contribute to the EMD. This suggests that NEAT1 may also be involved in the evolution of myeloma. But NEAT1 did not affect the prognosis of myeloma patients, we speculated that prognosis of MM is affected by multiple factors such as treatment drug selection, patient compliance and heterogeneous biological characteristics. A single difference of NEAT1 expression is not enough to affect OS/PFS.
The present study provided novel insights into lncRNA-NEAT1 and hinted that NEAT1 might be a potential lncRNA biomarker in EMD. LncRNA-NEAT1 inhibits the cell cycle and activates the PI3K/Akt/PTEN pathway. These findings provide novel target therapeutic strategies for extramedullary MM.
Acknowledgements
We thank professor Hongming Huang at Nantiong University for supporting MM cells and the English revision.
Disclosure statement
No potential conflict of interest was reported by the author(s).
Data availability statement
The datasets used and/or analyzed during the current study are available from the corresponding author on reasonable request.
Additional information
Funding
References
- Usmani SZ, Heuck C, Mitchell A, et al. Extramedullary disease portends poor prognosis in multiple myeloma and is over-represented in high-risk disease even in the era of novel agents. Haematologica. 2012 Nov;97(11):1761–1767. doi:10.3324/haematol.2012.065698.
- Besse L, Sedlarikova L, Greslikova H, et al. Cytogenetics in multiple myeloma patients progressing into extramedullary disease. Eur J Haematol. 2016 Jul;97(1):93–100. doi:10.1111/ejh.12688.
- Cagnetta A, Adamia S, Acharya C, et al. Role of genotype-based approach in the clinical management of adult acute myeloid leukemia with normal cytogenetics. Leuk Res. 2014 Jun;38(6):649–659. doi:10.1016/j.leukres.2014.03.006.
- Ilyas AM, Ahmad S, Faheem M, et al. Next generation sequencing of acute myeloid leukemia: influencing prognosis. BMC Genomics. 2015;16(Suppl 1):S5. doi:10.1186/1471-2164-16-S1-S5.
- Garding A, Bhattacharya N, Claus R, et al. Epigenetic upregulation of lncRNAs at 13q14.3 in leukemia is linked to the In Cis downregulation of a gene cluster that targets NF-kB. PLoS Genet. 2013 Apr;9(4):e1003373. doi:10.1371/journal.pgen.1003373.
- Carrasco-Leon A, Ezponda T, Meydan C, et al. Characterization of complete lncRNAs transcriptome reveals the functional and clinical impact of lncRNAs in multiple myeloma. Leukemia. 2021 May;35(5):1438–1450. doi:10.1038/s41375-021-01147-y.
- Handa H, Honma K, Oda T, et al. Long noncoding RNA PVT1 Is regulated by bromodomain protein BRD4 in multiple myeloma and Is associated with disease progression. Int J Mol Sci. 2020 Sep 27;21(19). doi:10.3390/ijms21197121.
- Gagelmann N, Eikema DJ, Iacobelli S, et al. Impact of extramedullary disease in patients with newly diagnosed multiple myeloma undergoing autologous stem cell transplantation: a study from the chronic malignancies working party of the EBMT. Haematologica. 2018 May;103(5):890–897. doi:10.3324/haematol.2017.178434.
- Ryu D, Kim SJ, Hong Y, et al. Alterations in the transcriptional programs of myeloma cells and the microenvironment during extramedullary progression affect proliferation and immune evasion. Clin Cancer Res. 2020 Feb 15;26(4):935–944. doi:10.1158/1078-0432.CCR-19-0694.
- Taiana E, Favasuli V, Ronchetti D, et al. Long noncoding RNA NEAT1 targeting impairs the DNA repair machinery and triggers anti-tumor activity in multiple myeloma. Leukemia. 2020 Jan;34(1):234–244. doi:10.1038/s41375-019-0542-5.
- Zhou X, Flüchter P, Nickel K, et al. Carfilzomib based treatment strategies in the management of relapsed/refractory multiple myeloma with extramedullary disease. Cancers. 2020 Apr 23;12(4). doi:10.3390/cancers12041035.
- Bladé J, Fernández de Larrea C, Rosiñol L. Extramedullary disease in multiple myeloma in the era of novel agents. Br J Haematol. 2015 Jun;169(6):763–765. doi:10.1111/bjh.13384.
- Mangiacavalli S, Pompa A, Ferretti V, et al. The possible role of burden of therapy on the risk of myeloma extramedullary spread. Ann Hematol. 2017 Jan;96(1):73–80. doi:10.1007/s00277-016-2847-z.
- West JA, Davis CP, Sunwoo H, et al. The long noncoding RNAs NEAT1 and MALAT1 bind active chromatin sites. Mol Cell. 2014 Sep 4;55(5):791–802. doi:10.1016/j.molcel.2014.07.012.
- Chakravarty D, Sboner A, Nair SS, et al. The oestrogen receptor alpha-regulated lncRNA NEAT1 is a critical modulator of prostate cancer. Nat Commun. 2014 Nov 21;5:5383. doi:10.1038/ncomms6383.
- Geng W, Guo X, Zhang L, et al. Resveratrol inhibits proliferation, migration and invasion of multiple myeloma cells via NEAT1-mediated Wnt/β-catenin signaling pathway. Biomed Pharmacother. 2018 Nov;107:484–494. doi:10.1016/j.biopha.2018.08.003.
- Xu H, Li J, Zhou ZG. NEAT1 promotes cell proliferation in multiple myeloma by activating PI3K/AKT pathway. Eur Rev Med Pharmacol Sci. 2018 Oct;22(19):6403–6411. doi:10.26355/eurrev_201810_16053.
- Rostami M, Kharajo RS, Parsa-Kondelaji M, et al. Altered expression of NEAT1 variants and P53, PTEN, and BCL-2 genes in patients with acute myeloid leukemia. Leuk Res. 2022 Apr;115:106807. doi:10.1016/j.leukres.2022.106807.
- Chapman MA, Lawrence MS, Keats JJ, et al. Initial genome sequencing and analysis of multiple myeloma. Nature. 2011 Mar 24;471(7339):467–472. doi:10.1038/nature09837.
- Egan JB, Shi CX, Tembe W, et al. Whole-genome sequencing of multiple myeloma from diagnosis to plasma cell leukemia reveals genomic initiating events, evolution, and clonal tides. Blood. 2012 Aug 2;120(5):1060–1066. doi:10.1182/blood-2012-01-405977.
- Blume CJ, Hotz-Wagenblatt A, Hüllein J, et al. p53-dependent non-coding RNA networks in chronic lymphocytic leukemia. Leukemia. 2015 Oct;29(10):2015–2023. doi:10.1038/leu.2015.119.
- Wang J, Li H, Wang Y, et al. MicroRNA-552 enhances metastatic capacity of colorectal cancer cells by targeting a disintegrin and metalloprotease 28. Oncotarget. 2016 Oct 25;7(43):70194–70210. doi:10.18632/oncotarget.12169.
- Zhang J, Wang P, Cui Y. Long noncoding RNA NEAT1 inhibits the acetylation of PTEN through the miR-524-5p /HDAC1 axis to promote the proliferation and invasion of laryngeal cancer cells. Aging. 2021 Nov 27;13(22):24850–24865. doi:10.18632/aging.203719.
- Dong P, Xiong Y, Yue J, et al. Exploring lncRNA-mediated regulatory networks in endometrial cancer cells and the tumor microenvironment: advances and challenges. Cancers. 2019 Feb 16;11(2).doi:10.3390/cancers11020234.
- Li A, Qiu M, Zhou H, et al. PTEN,Insulin resistance and cancer. Curr Pharm Des. 2017;23(25):3667–3676. doi:10.2174/1381612823666170704124611.
- Chu EC, Tarnawski AS. PTEN regulatory functions in tumor suppression and cell biology. Med Sci Monit. 2004;10(10):235–241. doi:10.1051/medsci/20042010939.
- Alvarez-Garcia V, Tawil Y, Wise HM, et al. Mechanisms of PTEN loss in cancer: it's all about diversity. Semin Cancer Biol. 2019;59:66–79. doi:10.1016/j.semcancer.
- Cully M, You H, Levine AJ, et al. Beyond PTEN mutations: the PI3K pathway as an integrator of multiple inputs during tumorigenesis. Nat Rev Cancer. 2006 Mar;6(3):184–192. doi:10.1038/nrc1819.
- Taiana E, Ronchetti D, Favasuli V, et al. Long non-coding RNA NEAT1 shows high expression unrelated to molecular features and clinical outcome in multiple myeloma. Haematologica. 2019 Feb;104(2):e72–e76. doi:10.3324/haematol.2018.201301.