
ABSTRACT
Objective
This experiment will explore the role of TIGIT/PVR signaling pathway in the pathogenesis of MDS immune tolerance through in vitro co-culture of NK cells and MDSC cells.
Methods
Flow cytometry was used to detect the expression percentage of MDSCs and CD155 on MDSCs in the bone marrow of MDS patients and controls. The expression of NK cell surface receptors (NKG2D, NKp30, NKp46), secreted cytokines (perforin, granzyme B, CD107a, IFN-γ) and NK cell apoptosis rate were detected by flow cytometry to evaluate the effect of MDSCs on NK cell function.
Results
The number of MDSCs in bone marrow of MDS patients was notably higher than that of the control group (8.39 ± 7.01 vs 2.31 ± 1.65, P = 0.0001). Compared with the control group, the expression of CD155 on MDSCs in MDS group was increased (31.81 ± 21.33 vs. 10.49 ± 6.53, P < 0.0001). After NK cells were co-cultured with MDSCs, NKG2D, NKp30, NKp46, CD107a, IFN-γ, perforin and granzyme B were decreased, and the NK function partially recovered after the addition of inhibitors.
Conclusion
Compared with the normal control, MDSCs and CD155 on MDSCs were highly expressed in MDS patients. After co-culture with MDSCs, the expression of NK cells’ surface receptors decreased, the secretion of cytokines decreased and the apoptosis rate increased. After blocking TIGIT/CD155 pathway, NK cell function was reversed, but NK cell apoptosis was not reduced.
Introduction
Myelodysplastic syndromes (MDS) are a clonal stem/progenitor cell malignancy characterized by pathological hematopoiesis, pancytopenia and high risk of transition to acute myeloid leukemia [Citation1]. Due to biological heterogeneity, the clinical manifestations and outcomes of MDS patients vary greatly [Citation2]. Several internationally recognized scoring systems, including the original International Prognostic Scoring System (IPSS) [Citation3] and the modified International Prognostic Scoring System (IPSS-R) [Citation4], can help MDS patients assess their prognosis by classifying MDS patients into low-risk group and high-risk group.
Myeloid-derived suppressor cells (MDSCs) is an important cell population with negative immune regulation function discovered in recent years, including early bone marrow progenitor cells, naive granulocytes, macrophages and dendritic cells at different stages of differentiation [Citation5]. In humans, according to morphological and phenotypic characteristics, three main subtypes of MDSC have been reported, including polymorphonuclear MDSC (PMN-MDSC), mononuclear MDSC (M-MDSC) and early MDSC (eMDSC). eMDSCs were mostly immature myeloid precursor cells and were defined as Lin-(including CD3, CD14, CD15, CD19 and CD56) HLA-DR–CD33+ by flow cytometry [Citation6–8].
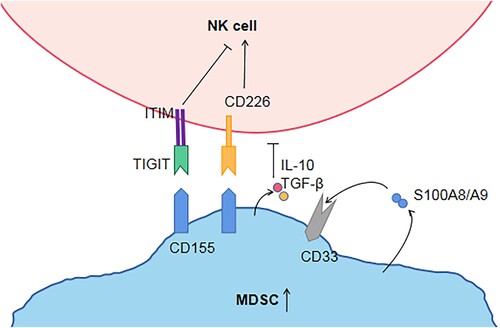
Natural killer (NK) cells are effector cells of innate immune response, capable of killing tumor or virus-infected cells, secreting cytokines and regulating innate and adaptive immune responses [Citation9]. The preliminary study of this project found that the number and function of NK cells in MDS patients decreased and the higher-risk group of MDS was significantly lower than that in the lower-risk group [Citation10,Citation11]. The reason for the decline in NK cell function is unknown. We hypothesized that MDSCs can also inhibit NK cells. In order to study whether MDSC can regulate NK cell function, I isolated MDSC from the bone marrow of MDS patients and co-cultured it with NK cells. We observed that MDSC could inhibit the expression and killing ability of NK cell surface functional molecules. TIGIT is a novel co-inhibitory receptor widely expressed in T and NK cells [Citation12]. The interaction between TIGIT + NK cells and MDSCs expressing CD155 reduced phosphorylation of ZAP70/Syk and ERK1/2, and decreased the cytolytic capacity of NK cells [Citation13]. Our previous studies have demonstrated that TIGIT is highly expressed on NK cells in peripheral blood of MDS patients, and more highly expressed in high-risk MDS [Citation10]. Besides, our study found that compared with the normal control group, the expression of PVR (CD155) on MDSC was increased. TIGIT inhibitors and CD155 inhibitors were added into the co-culture system of MDSCs and NK, respectively, and it was found that the function of NK cells was reversed. Therefore, we believe that MDSCs inhibit NK cells through TIGIT/PVR pathway (). These findings will make a significant contribution to TIGIT monoclonal antibody as a targeted therapy for MDS patients in the future.
Figure 1. Hypothesis regarding MDSCs, NK cells, the TIGIT/CD155 axis. TIGIT and CD226 on NK cells compete binding with CD155 on MDSC. TIGIT binds CD155 with higher affinity than CD226, then trigger inhibitory signals through ITIM. MDSCs produce and secrete S100A9, which also activates MDSCs in an autocrine manner. S100A9 activates CD33 to expand MDSC and secrete IL-10 and TGF-β, thereby indirectly inhibiting NK cell function. MDSC: Myeloid-derived suppressor cell; ITIM: immunoreceptor tyrosine-based inhibitory motif; NK cell: natural killer cell; TIGITT cell immunoreceptor with immunoglobulin and ITIM domain. S100A9/S100A8: calprotectin; IL-10: Interleukin-10; TGF-β: Transforming growth factor β.
Materials and methods
Patients
67 MDS patients and 23 normal volunteers admitted to Tianjin Medical University General Hospital from August 2020 to January 2022 were enrolled in this study. MDS patients were classified according to WHO in 2016 [Citation14] (). There was no difference in sex ratio or age between MDS patients and healthy volunteers (P > 0.05). This study was approved by the Ethics Committee of Tianjin Medical University General Hospital. Informed written consent was obtained from all patients and normal controls in accordance with the Declaration of Helsinki.
Table 1. Clinical characteristics of MDS patients.
Flow cytometry
In total, 100 μl of fresh bone marrow samples from MDS patients and healthy volunteers were placed into heparin sodium anticoagulant tubes and incubated with 5 µL Lin/ HLA-DR /CD33, CD155 and their isotype control antibodies at 4°C for 30 min. After incubation, erythrocytes were lysed with 2 mL hemolysin for 10 min, centrifuged at 1500 rpm for 5 min, and washed twice with phosphate buffered saline (PBS). Finally, CD155 on Lin-HLA-DR–CD33+MDSC and MDSCs was determined by flow cytometry with at least 5 × 10⁵ cells per tube. Antibodies include Lin-FITC(UCHT1; HCD14; 3G8; HIB19; 2H7; HCD56), HLA-DR-Percp(L243) CD33-PE(P67.6), and CD155-APC(SKLL.4).
Sorting NK cells and MDSCs
In total, 10 ml fresh bone marrow of MDS patients was obtained and bone marrow mononuclear cells were isolated from bone marrow with lymphocyte separation solution. Then, the human NK cell isolation kit was used to select NK cells through the Yin. In total, 10 ml of bone marrow of MDS patients was obtained, and erythrocytes were lysed with a lysis solution. After washing with PBS, 40 µL Lin\HLA-DR\CD33 antibody was added to mark MDSCs surface markers. The cells were co-incubated at 4°C for 30 min in darkness, washed twice with PBS and then isolated MDSCs were collected by FACS Aria II (BD Biosciences). The purity of isolated NK cells and MDSCs detected by FCM was greater than 95%.
TIGIT+NK cells were co-cultured with MDSCs
The isolated NK cells and MDSCs were cultured in RPMI 1640 (Gibco) medium containing 10% fetal bovine serum (FBS), 60 mg/L penicillin and 100 mg/L streptomycin in a ratio of 1:2, and cultured at 37°C in a 5% CO2 incubator for 5 days. The effect of MDSCs on NK cells was analyzed by adding 10 µg/mL Purified anti-human CD155 Monoclonal Antibody (SKLL.4,FITC) and 10 µg/mL TIGIT Monoclonal Antibody (MBSA43,FITC).
Determination of NK cell function
After the co-cultured NK cells were removed and/or the membrane was broken, the cells were washed twice and then incubated with CD3, CD56, NKG2D, NKp46, NKp30, CD107a, IFN-γ, perforin and granzyme B antibodies for 30 min, respectively. The expressions of NK cell functional molecules NKG2D, NKp46, NKp30, CD107a, IFN-γ, perforin and granzyme B were detected by flow cytometry. Antibodies include CD3-APC(OKT3), CD3-percp(SP34-2), CD56-FITC(NCAM16.2), CD56-APC(5.1H11), NKG2D-Cy7(1D11), NKP46-KO525(9E2), NKP30-PB450(P30-15) and CD107a-PE(H4A3), IFN-γ-Cy-7(4SB3), perforin-PE(DG9) and granzyme B-PE (QA16A02).
Cell apoptosis was detected
Apoptosis of NK cells co-cultured with MDSC was detected using FITC Annexin V Apoptosis Detection Kit I (BD Biosciences). The cells were washed twice with PBS and re-suspended in 1× binding buffer at the concentration of 1 × 10⁶ cells/mL. Then, 100 µL solution (1 × 10⁵ cells) was transferred to 5 mL culture tubes and 5 µL FITC Annexin V and 5 µL PI were added. The cells were swirled gently and incubated at room temperature (25°C) in dark for 15 min. Finally, 400 µL 1× binding buffer was added to each tube. Analysis was performed by flow cytometry.
Statistical analysis
SPSS17.0 was used for data analysis, and all data were expressed in the form of Mean ± SD. T test was used between the two groups of samples. A non-parametric test (Wilcoxon) was used for comparison between the two groups of samples. A non-parametric test (Friedman) was used for comparison between three or more groups of samples, and P-value < 0.05 was considered statistically significant.
Result
Compared with the normal control, MDSCs and CD155 on MDSCs were highly expressed in MDS patients
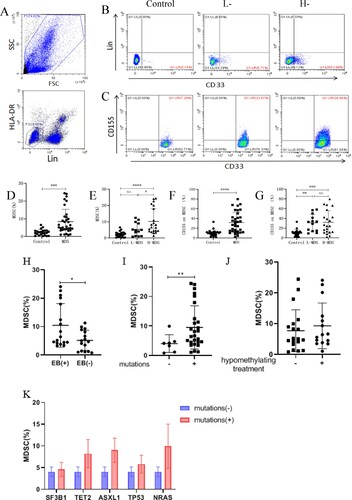
To investigate the role of CD155 on MDSCs in MDS, flow cytometry was used to detect the expression of MDSCs and CD155 on MDSCs. MDSCs expression in MDS patients (N = 34) was higher than that in the normal control group (N = 23) (8.39 ± 7.01 vs 2.31 ± 1.65, P = 0.0001), and was also different between the high-risk and low-risk groups (10.27 ± 7.84 vs 5.36 ± 4.07, P = 0.0277) ((B, D, E)). To further investigate the relationship between MDSCs and clinical characteristics, we make this comparison between MDS with and without excess blasts. The levels of MDSCs were higher in patients with excess blasts (N = 17) than in those without excess blasts (N = 16) (10.06 ± 7.61 vs 5.20 ± 3.43, P = 0.0046) ((H)). In addition, we studied the correlation between the molecular profile and the percentage of MDSCs. Patients with mutations (N = 27) also had higher MDSCs levels than those without mutations (N = 7) (9.52 ± 7.20 vs 4..04 ± 2.79, P = 0.0057), however, no significant difference was found between MDSCs levels with regard to different molecular profile mutations ((I, K)). Moreover, there was no significant difference in MDSCs levels between patients with and without hypomethylating treatment ((J)). Therefore, we believe that the high expression of MDSCs may be related to the occurrence and progression of MDS. Furthermore, the expression of CD155 on MDSCs of MDS patients (N = 34) was significantly higher than that of NC patients (31.81 ± 21.33 vs. 10.49 ± 6.53, P < 0.0001), but there was no difference between the low-risk and high-risk groups (31.11 ± 17.25 vs. 32.25 ± 23.92, P = 0.9805) ((C, F, G)). These data suggest that MDSCs may play an immunosuppressive role through CD155.
Figure 2. MDSCs and expression of CD155 on MDSCs. (A) The enclosed cells in the lower left corner are LIN-HLA-DR-cells. (B) Lin-HLA-DR-CD33 + cells, namely MDSCs, are shown in the lower right corner, and the expression of MDSCs in control, low-risk or high-risk MDS patients, respectively. (C) CD155+Lin-HLA-DR-CD33 + cells, namely CD155 on MDSCs, in the upper right corner. (D and E) Dot plots showed the comparison of MDSCs between MDS patients (including low-risk and high-risk MDS patients) and control group. (F and G) dot plots show CD155 expression on MDSCs in control, low-risk or high-risk MDS patients. (H) Dot plots showed the comparison of MDSCs between MDS with and without excess blasts. (I) The expression of MDSCs in MDS with and without mutations. (J) The expression of MDSCs in MDS with and without hypomethylating treatment. (K) The expression of MDSCs in MDS with and without different molecular profile mutations (n ≥ 3). *P < 0.05, **P < 0.01, *** P < 0.001, * * * * P < 0. 0001, NS = no significant.
After co-culture with MDSCs, the expression of NK cells’ surface receptors decreased, the secretion of cytokines decreased and the apoptosis rate increased
In humans, the main receptors responsible for NK cell recognition of tumors are NKp46, NKp30, NKp44, DNAM1 and NKG2D [Citation15]. The previous experiment of our group found that the function of NK cells in MDS patients was significantly reduced, mainly manifested in NKp46, NKp30 [Citation16], DNAM1 [Citation10] and NKG2D [Citation17] and the expression of CD107a and IFN-γ was significantly lower than that of the normal control group. In order to determine whether MDSCs play a role, we co-cultured MDSC and NK cells in vitro, and found that NK cells co-cultured with MDSCs showed lower expression of receptors such as NKp30, NKp46 and NKG2D than NK cells cultured alone (, ). Subsequently, CD107a, IFN-γ, perforin and granzyme B secreted by the two groups of NK cells were detected, and the same results were obtained. Furthermore, we detected the apoptosis rate of NK cells in the two groups and found that the apoptosis of NK cells was significantly increased after co-culture with MDSCs. These results showed that MDSCs inhibited NK cells’ ability to recognize and kill tumors, and promoted NK cell apoptosis.
Figure 3. Flow cytometry was used to analyze the expression of NKG2D, NKp30, NKp46, perforin, granase B, CD107a, IFN-γ and NK cell apoptosis in THE NK group and THE NK+MDSCs group. NK refers to the group of NK cells cultured alone, and NK+MDSCs refers to the group of NK cells co-cultured with MDSCs.
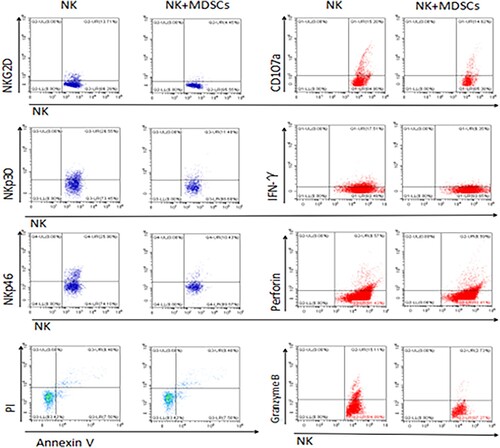
Table 2. Expression of NKG2D, NKp30, NKp46, perforin, Granzyme B, CD107a, IFN-γ and NK cell apoptosis in NK group and NK+MDSCs group.
After blocking TIGIT/CD155 pathway, NK cell function was reversed, but NK cell apoptosis was not reduced
In order to determine whether MDSC inhibits NK cell function through TIGIT/CD155 pathway, TIGIT inhibitor and CD155 inhibitor were added into NK and MDSC co-culture system, respectively, and then the function and apoptosis of NK cells were detected before and after the addition of inhibitor. The results showed that the expressions of NKG2D, NKp30, NKp46, perforin, granzyme B, CD107a and IFN-γ in NK cells with TIGIT inhibitor and CD155 inhibitor were significantly higher than those in NK+MDSC group. In addition, NKp30, NKp46 and CD107a of NK cells in TIGIT inhibitor group were significantly increased compared with NK+MDSCs group in the co-culture system. However, the expression of NKp30, NKp46, CD107a and granzyme B of NK cells increased in the addition of CD155 inhibitor group compared with the NK+MDSCs group. However, no significant difference in NK cell apoptosis was observed before and after the addition of inhibitors (, ).
Figure 4. NK+MDSCs refers to NK and MDSCs co-culture, NK+MDSCs+TIGIT inhibitor refers to NK and MDSCs co-culture system with TIGIT inhibitor, NK+MDSCs+CD155 inhibitor refers to NK and MDSCs co-culture system with CD155 inhibitor. NK+MDSCs+TIGIT inhibitor+CD155 inhibitor that is, TIGIT inhibitor and CD155 inhibitor are added simultaneously in NK and MDSCs co-culture system.
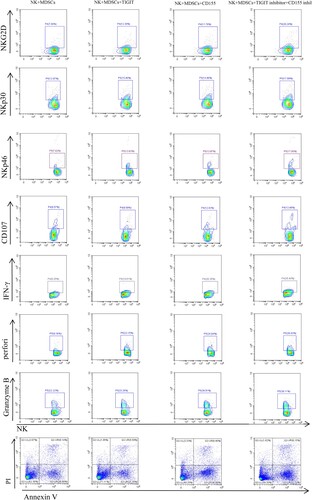
Table 3. Comparison between each group and NK + MDSCs group, * means P < 0.05, ** means P < 0.01, *** means P < 0.001, **** means P < 0.0001.
Discussion
MDSC promotes tumor growth and metastasis directly or indirectly by recognizing other immune cells, producing cytokines and exerting their immunosuppressive functions. At present, multiple studies have proved that MDSCs can inhibit the function of NK cells [Citation18–21], thus exerting immunosuppressive function. Our study found that the number of MDSCs was higher in high-risk MDS compared to both low risk and normal control group, which indicates that MDSCs play a role in immune-surveillance suppression and disease progression. Besides, a study has also shown that the expansion of MDSCs in MDS correlates with increased risk of disease progression toward acute myeloid leukemia (AML) [Citation22]. Previous studies demonstrated that myeloid-related protein S100A9 could enhance MDSCs production in cancer and MDSCs also could produce S100A8/S100A9 [Citation23,Citation24]. Chen et al. further demonstrated that the expansion of MDSCs is mediated through S100A9 ligand activation of CD33, leading to production of the suppressive cytokines interleukin-10 (IL-10) and transforming growth factor-β (TGF-β) [Citation25]. Schneider et al. recently reported that Rps14 haplodeficiency induces S100A8/9 expression to direct TLR4-dependent cell-intrinsic death of polychromatic erythroblasts, while inhibition of this pathway restored hematopoiesis [Citation26]. Besides, Ashley et al. found that S100A9 activates the NLRP3 pattern recognition receptor, which is responsible for inflammasome-mediated pyroptosis and b-catenin activation in MDS [Citation27]. In mouse models, MDSCs inhibited NK cell cytotoxicity, NKG2D expression and IFN-γ production by membrane-binding TGF-β1 [Citation21]. In this experiment, we co-cultured NK cells and MDSCs in vitro, and compared before and after adding TIGIT and CD155 inhibitors, it was also confirmed that MDSCs in MDS could inhibit NK killing function and surface receptor expression through TIGIT/CD155 pathway.
Unexpectedly, NK cell apoptosis increased after the co-culture of NK cells and MDSCs, but did not decrease after the addition of TIGIT and CD155 inhibitors in the co-culture system, which was contrary to our expectations. Through literature review, we found that MDSCs not only inhibit NK cell function through TGF-β1, but also weaken NK cell function through NO, IDO1, etc. [Citation19,Citation28]. Therefore, we speculate that there are many known and unknown pathways and factors of MDSCs that affect NK cell apoptosis.
Demethylation drugs (HMA) are the first-line treatment for MDS patients, but drug resistance increases with the progression of the disease and the extension of drug use time [Citation29]. After HMA failure, immunotherapy monotherapy and/or HMA combination therapy offer new hope for MDS patients. A large number of studies have demonstrated the therapeutic potential of antagonistic monoclonal antibody (mAb) targeting TIGIT in a variety of malignant tumors. In AML, siRNA knockdown expressed by TIGIT reversed the dysfunctional phenotype of blood TIGIT+CD8+T cells, resulting in increased IFN-γ and TNF-α production and reduced apoptosis [Citation30]. It further supports the application of TIGIT blocker in hematological tumors. It was also found that human anti-Tigit mAb increased the proliferation and production of IFN-γ and TNF-α and the degranulation of CD8+T cells in bone marrow of MM patients after anti-CD3 stimulation. Six IgG1 is otypes of human antitigit mAb have been included in clinical trials, most of them in solid tumors. In this experiment, we have proved that MDS patients exert the inhibitory effect on NK cells through TIGIT/CD155 pathway, which leads to the weakening of anti-tumor effect and participation in the progression of the disease. Moreover, the NK cell function of MDS patients was reversed after the addition of TIGIT and CD155 blockers. Therefore, we believe that targeting TIGIT can contribute to cellular immunotherapy of MDS patients in the future.
In conclusion, MDSCs in MDS may inhibit the function of NK cells through TIGIT/CD155 pathway, and the function of NK cells is reversed after adding TIGIT and CD155 inhibitors. Therefore, inhibition of TIGIT/CD155 pathway can restore the function of NK cells in MDS patients. This provides a theoretical basis for TIGIT/CD155 targeted therapy for MDS patients in the future.
Ethics statement
The study was performed according to the Declaration of Helsinki and approved by the Ethics Committee of Tianjin Medical University General Hospital. Written informed consent to participate was obtained from each individual.
Acknowledgements
Authors’ contribution: Jing Yue and JiaojiaoLi made equal contributions in research, data analysis and manuscript writing; Wei Zhang designed the experiment and ensured correct data analysis and strict revision of the manuscript; Junlan Ma, Yan Zhai and Li Shen assisted in design and research, supervised data collection and contributed to manuscript writing, Lijuan Li and Rong Fu participated in the revision and review of the article.
Disclosure statement
No potential conflict of interest was reported by the author(s).
Data availability statement
Data sets generated by this study are available from the first author and corresponding author.
Additional information
Funding
References
- Garcia-Manero G, Chien KS, Montalban-Bravo G. Myelodysplastic syndromes: 2021 update on diagnosis, risk stratification and management. Am J Hematol. 2020;95(11):1399–1420. DOI:10.1002/ajh.25950
- Raza A, Galili N. The genetic basis of phenotypic heterogeneity in myelodysplastic syndromes. Nat Rev Cancer. 2012;12(12):849–859. DOI:10.1038/nrc3321
- Greenberg P, Cox C, LeBeau MM, et al. International scoring system for evaluating prognosis in myelodysplastic syndromes. Blood. 1997;89(6):2079–2088. DOI:10.1182/blood.V89.6.2079
- Greenberg PL, Tuechler H, Schanz J, et al. Revised international prognostic scoring system for myelodysplastic syndromes. Blood. 2012;120(12):2454–2465. DOI:10.1182/blood-2012-03-420489
- Safarzadeh E, Orangi M, Mohammadi H, et al. Myeloid-derived suppressor cells: important contributors to tumor progression and metastasis. J Cell Physiol. 2018;233(4):3024–3036. DOI:10.1002/jcp.26075
- Bronte V, Brandau S, Chen S-H, et al. Recommendations for myeloid-derived suppressor cell nomenclature and characterization standards. Nat Commun. 2016;7:12150. DOI:10.1038/ncomms12150
- Damuzzo V, Pinton L, Desantis G, et al. Complexity and challenges in defining myeloid-derived suppressor cells. Cytometry B Clin Cytom. 2015;88(2):77–91. DOI:10.1002/cyto.b.21206
- Mandruzzato S, Brandau S, Britten CM, et al. Toward harmonized phenotyping of human myeloid-derived suppressor cells by flow cytometry: results from an interim study. Cancer Immunol Immunother. 2016;65(2):161–169. DOI:10.1007/s00262-015-1782-5
- Caligiuri MA. Human natural killer cells. Blood. 2008;112(3):461–469. DOI:10.1182/blood-2007-09-077438
- Meng F, Li L, Lu F, et al. Overexpression of TIGIT in NK and T cells contributes to tumor immune escape in myelodysplastic syndromes. Front Oncol. 2020;10:1595. DOI:10.3389/fonc.2020.01595
- Liu Z, Guo Y, Huang L, et al. Bone marrow mesenchymal stem cells regulate the dysfunction of NK cells via the T cell immunoglobulin and ITIM domain in patients with myelodysplastic syndromes. Cell Commun Signal. 2022;20(1):169. DOI:10.1186/s12964-022-00985-2
- Manieri NA, Chiang EY, Grogan JL. TIGIT: a key inhibitor of the cancer immunity cycle. Trends Immunol. 2017;38(1):20–28. DOI:10.1016/j.it.2016.10.002
- Sarhan D, Cichocki F, Zhang B, et al. Adaptive NK cells with low TIGIT expression are inherently resistant to myeloid-derived suppressor cells. Cancer Res. 2016;76(19):5696–5706. DOI:10.1158/0008-5472.CAN-16-0839
- Arber DA, Orazi A, Hasserjian R, et al. The 2016 revision to the world health organization classification of myeloid neoplasms and acute leukemia. Blood. 2016;127(20):2391–2405. DOI:10.1182/blood-2016-03-643544
- Vivier E, Raulet DH, Moretta A, et al. Innate or adaptive immunity? The example of natural killer cells. Science. 2011;331(6013):44–49. DOI:10.1126/science.1198687
- Xu SJ, Shao ZH, Fu R, et al. [Subtype and functional biomarker changes of NK cells in peripheral blood of patients with myelodysplastic syndrome]. Zhongguo Shi Yan Xue Ye Xue Za Zhi. 2017;25(3):832–836.
- Mi H, Fu R, Wang H, et al. [Changes of natural kill cell in peripheral blood of patients with myelodysplastic syndrome]. Zhonghua Yi Xue Za Zhi. 2014;94(10):737–741.
- Hoechst B, Voigtlaender T, Ormandy L, et al. Myeloid derived suppressor cells inhibit natural killer cells in patients with hepatocellular carcinoma via the NKp30 receptor. Hepatology. 2009;50(3):799–807. DOI:10.1002/hep.23054
- Stiff A, Trikha P, Mundy-Bosse B, et al. Nitric oxide production by myeloid-derived suppressor cells plays a role in impairing Fc receptor-mediated natural killer cell function. Clin Cancer Res. 2018;24(8):1891–1904. DOI:10.1158/1078-0432.CCR-17-0691
- Vaknin I, Blinder L, Wang L, et al. A common pathway mediated through toll-like receptors leads to T- and natural killer-cell immunosuppression. Blood. 2008;111(3):1437–1447. DOI:10.1182/blood-2007-07-100404
- Li H, Han Y, Guo Q, et al. Cancer-expanded myeloid-derived suppressor cells induce anergy of NK cells through membrane-bound TGF-beta 1. J Immunol. 2009;182(1):240–249. DOI:10.4049/jimmunol.182.1.240
- Kittang AO, Kordasti S, Sand KE, et al. Expansion of myeloid derived suppressor cells correlates with number of T regulatory cells and disease progression in myelodysplastic syndrome. Oncoimmunology. 2016;5(2):e1062208. DOI:10.1080/2162402X.2015.1062208
- Cheng P, Corzo CA, Luetteke N, et al. Inhibition of dendritic cell differentiation and accumulation of myeloid-derived suppressor cells in cancer is regulated by S100A9 protein. J Exp Med. 2008;205(10):2235–2249. DOI:10.1084/jem.20080132
- Sinha P, Okoro C, Foell D, et al. Proinflammatory S100 proteins regulate the accumulation of myeloid-derived suppressor cells. J Immunol. 2008;181(7):4666–4675. DOI:10.4049/jimmunol.181.7.4666
- Chen X, Eksioglu EA, Zhou J, et al. Induction of myelodysplasia by myeloid-derived suppressor cells. J Clin Invest. 2013;123(11):4595–4611. DOI:10.1172/JCI67580
- Schneider RK, Schenone M, Ferreira MV, et al. Rps14 haploinsufficiency causes a block in erythroid differentiation mediated by S100A8 and S100A9. Nat Med. 2016;22(3):288–297. DOI:10.1038/nm.4047
- Basiorka AA, McGraw KL, Eksioglu EA, et al. The NLRP3 inflammasome functions as a driver of the myelodysplastic syndrome phenotype. Blood. 2016;128(25):2960–2975. DOI:10.1182/blood-2016-07-730556
- Zhang J, Han X, Hu X, et al. IDO1 impairs NK cell cytotoxicity by decreasing NKG2D/NKG2DLs via promoting miR-18a. Mol Immunol. 2018;103:144–155. DOI:10.1016/j.molimm.2018.09.011
- Santini V. How I treat MDS after hypomethylating agent failure. Blood. 2019;133(6):521–529. DOI:10.1182/blood-2018-03-785915
- Kong Y, Zhu L, Schell TD, et al. T-Cell immunoglobulin and ITIM domain (TIGIT) associates with CD8+ T-cell exhaustion and poor clinical outcome in AML patients. Clin Cancer Res. 2016;22(12):3057–3066. DOI:10.1158/1078-0432.CCR-15-2626