
 ?Mathematical formulae have been encoded as MathML and are displayed in this HTML version using MathJax in order to improve their display. Uncheck the box to turn MathJax off. This feature requires Javascript. Click on a formula to zoom.
ABSTRACT
Objective
To identify biomarkers that can predict the recurrence of the central nervous system (CNS) in children with acute lymphoblastic leukemia (ALL).
Materials and Methods
The transcriptome and clinical data of ALL in children were downloaded from the TARGET database. Transcriptome data were analyzed by bioinformatics method to identify core (hub) genes and establish a risk assessment model. Univariate Cox analysis was performed on each clinical data, and multivariate Cox regression analysis was performed on the obtained results and risk score. The children ALL phase I samples from TARGET database were used for validation.
Results
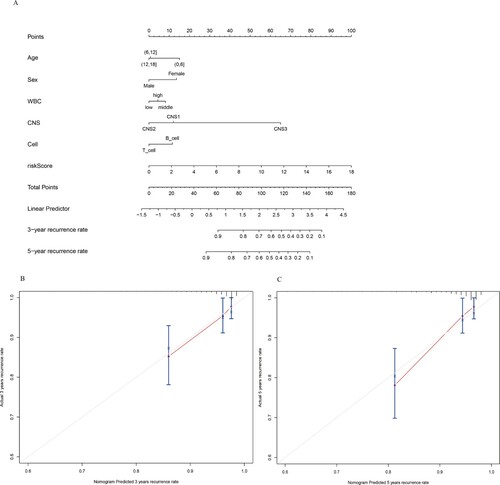
Univariate multivariate Cox analysis of 10 hub genes identified showed that PPARG (HR = 0.78, 95%CI = 0.67–0.91, p = 0.007), CD19 (HR = 1.15, 95%CI = 1.05–1.26, p = 0.003) and GNG12 (HR = 1.25, 95%CI = 1.04–1.51, p = 0.017) had statistical differences. The risk score was statistically significant in univariate (HR = 3.06, 95%CI = 1.30–7.19, p = 0.011) and multivariate (HR = 1.81, 95%CI = 1.16–2.32, p = 0.046) Cox regression analysis. The survival analysis results of the high and low-risk groups were different when the validation dataset was substituted into the model (p = 0.018). Then, we constructed a Nomogram which had a concordance index of survival prediction of 0.791(95%CI= 0.779-0.803). In addition, the CNS involvement grading status at first diagnosis CNS3 vs. CNS1 (HR = 5.74, 95%CI = 2.01–16.4, p = 0.001), T cell vs B cell (HR = 1.63, 95% CI = 1.06-2.49, p = 0.026) were also statistically significant.
Conclusions
PPARG, GNG12, and CD19 may be predictors of CNS relapse in childhood ALL.
Introduction
Childhood acute lymphoblastic leukemia (ALL) is one of the most common primary malignant tumors in children and adolescents, accounting for about 35% of all tumors in children and more than 75% of all childhood acute leukemia cases [Citation1]. Although most ALL children frequently achieve complete remission, about 3–8% of children with ALL suffer from relapse in the central nervous system (CNS). Those suffering from CNS leukemia (CNSL) are believed to have poorer outcomes than CNS-negative children [Citation2–4]. Traditional intrathecal injection of chemotherapeutic drugs and radiotherapy has been associated with side effects and CNS relapse after remission. In addition, the majority of CNS relapse occurs in patients who were CNS-negative at initial diagnosis [Citation5]. Therefore, exploring new favorable biomarkers for CNS relapse may significantly improve the early diagnosis and treatment in childhood ALL.
Studies have reported that sex, hepatomegaly, central nervous system status and age [Citation6–8], neuronal-glial antigen-2 (NG2) expression [Citation9], and CNS microenvironment [Citation10] are all associated with CNS relapse of childhood ALL. Another study showed that the up-regulation of the PBx1 gene in B-cell leukemia in mouse CNS microenvironment could enhance the chemotherapy-resistance and self-renewal characteristics of leukemia cells [Citation11]. Organomegaly at diagnosis was a highly significant clinical predictor for relapse [Citation12]. In addition, acute leukemia patients with CNSL, which showed positive CD19 expression in tumor cell immunotyping and remission after anti-CD19 CAR T cell therapy [Citation13]. It could also be a potential predictor. However, as these studies were based only on clinical data or animal experiments, there is still no independent predictor and lack of a corresponding prediction model for CNS relapse in childhood ALL.
The aim of this study was to identify biomarkers and construct a nomogram for predicting the relapse of CNS in childhood ALL and provide early preventive therapy and targeted therapy for the childhood ALL at high risk of CNS relapse.
Materials and methods
Clinical data and preprocessing
We downloaded clinical and transcriptome data for Phase I and II of the ALL program from the TARGET database (https://ocg.cancer.gov/programs/target) managed by NCI’s Office of Cancer Genomics and Cancer Therapy Evaluation Program, which is a registry specifically for pediatric tumors. The TARGET database is publicly available and includes clinical and omics information on pediatric cancer patients. The TARGET ALL phase I project was obtained from patients enrolled in biology studies and clinical trials managed through the Children’s Oncology Group (COG), POG 9906 (clinical trial for patients with newly diagnosed ALL between March 2000 and April 2003). The Phase II project is collected from patients enrolled in the COG biology studies and clinical trials, most who experienced an early bone marrow relapse (within 4 years of initial diagnosis) and adequate amount of high-quality nucleic acids for comprehensive genomic profiling.
The data obtained from the database were divided into CNS relapsed group and non-relapsed group based on the presence or absence of CNS relapse. The inclusion and exclusion criteria for the two groups of data were: (1) patients were younger than 18 years old at the time of diagnosis; (2) complete transcriptome data were obtained in both groups; (3) clinical information should include complete relapse-free survival, CNS relapse status, etc.; and (4) relapsed group included patients that had only CNS relapse and no other site relapse at the end of the follow-up; the non-relapsed group refers to patients with no recurrence in any part by the end of follow-up.
Differentially expresses genes (DEGs) and enrichment analysis
The edge R was used to identify DEGs between the two groups (relapsed group vs. non-relapsed group). A false discovery rate (FDR) adjusted p < 0.05 combined with a simultaneous absolute value of ≥2 for logFC was set as the threshold for DEGs identification. The results of the differential analysis were visualized using gplots on the volcanic map and heat map. The differential genes were imported into the Biomart application of the Ensembl website for gene ID conversion. GO function enrichment analysis (annotated from the biological process (BP), cell composition (CC), and molecular function (MF)) and KEGG pathway analysis were performed using the David website [Citation14]. The STRING was used for the analysis of protein interactions encoded by differential genes; the credibility >0.7 was used as a cut-off value to plot the protein–protein interaction network (PPI) [Citation15].
Twelve topological analysis methods, including Degree, Edge Percolated Component (EPC), Maximum neighborhood component (MNC), Density of Maximum Neighborhood Component (DMNC), and Maximal Clique Centrality (MCC), etc., were provided by the CytoHubba plug-in in the Cytoscape software [Citation16]. These methods were used to analyze protein interaction networks. The top 10 scoring genes obtained by various algorithms were counted for frequency, and the top 10 genes with the highest occurrence frequency were regarded as hub genes.
Survival analysis and stepwise backward regression, ROC curve
The top 10 DEGs with the highest occurrence frequency were used as hub genes for univariate Cox regression analysis using Survival R packet. Multivariate Cox regression included statistically significant DEGs, and the stepwise backward regression was used to establish the optimal model. Finally, the risk value was calculated using the following formula: the risk score = (β1* expression level of PPARG) + (β2* expression level of CD19) + (β3* expression level of GNG12). The ROC curves of 3–5 years were drawn in batches using the survival ROC package. ROC curve at the time point with the maximum AUC was selected to intercept the turning point, which was used as the cut-off value of the risk score. The research subjects were divided into high and low-risk groups based on the cut-off value of the risk score. The Kaplan-Meier survival curves for the cases predicted to have low or high risk were produced to verify whether the two groups showed statistical significance.
The establishment and evaluation of the nomogram
Integrate the factors associated with CNS recurrence and create the nomogram of training data. The predictive power of the model was assessed and quantified by measuring the extent to which the C-index and the baseline time predicted by the nomogram in the standard curve fit the actual recurrence time.
Validation
The data collected by the COG collaboration group in the TARGET database for phase I of the study on childhood ALL were used to verify. The expression levels of the three target genes identified in the study were included in the model, and the risk score was calculated. The high-risk group and the low-risk group were also divided, and survival analysis was conducted to verify the accuracy of the model. Finally, to further validate whether the biomarkers’ prediction was independent of other clinical variables, univariate and multivariate Cox regression, and stratified analyses were conducted. Statistical and analytical software R3.6.0 was used for all data analysis and mapping. Gene ID conversion through Ensembl (https://grch37.ensembl.org/info/data/biomart/index.html). Enrichment analysis was conducted by the David website (https://david.ncifcrf.gov/tools.jsp). PPI plot was drawn by String website String (https://string-db.org/). Hub gene was determined by Cytoscape 3.8.2. P-value of < 0.05 was considered statistical significance, and all reported p-values were two-sided.
Results
Patient characteristics
Clinical information of the subjects in the relapsed group and non-relapsed group were described by means and percentages. A total of 278 subjects were included in the training dataset, with an average age of 8.7 ± 4.6 years. The time of diagnosis was from 2001 to 2011, and the follow-up period was from 2005 to 2016 (the mean follow-up time was 6.3 years); the male-to-female ratio was 3:7. Based on the presence or absence of CNS relapse, the data were divided into CNS relapsed and non-relapsed groups, with 28 patients in the CNS relapsed group and 250 patients in the non-relapsed group. Due to many missing values of the ETV6-RUNX1 fusion gene and only four positive cases, and since only one case of TCF3-PBX1 and BCR-ABL1 genes were positive, subsequent studies were not included in the analysis ().
Table 1. Patients’ characteristics in training dataset.
DEGs analysis
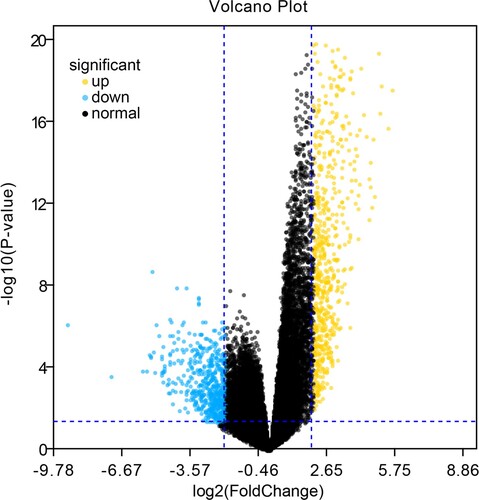
A total of 1230 differential genes were screened, including 685 up-regulated and 545 down-regulated genes. G plots were used to visualize the different analysis results, as shown in and Supplementary Figure 1.
Figure 1. Volcano map of DEGs. Yellow represents up-regulated genes, blue represents down-regulated genes, and black represents no statistically significant genetic difference.
Identification of differentially expressed genes and functional enrichment analysis
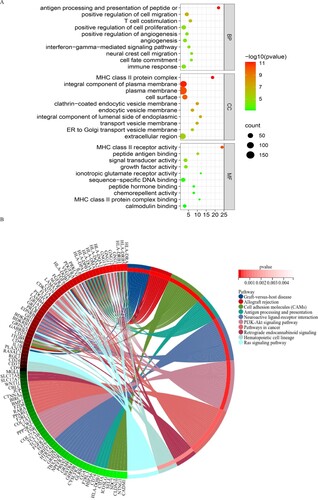
The results showed that these differential genes were mainly involved in biological processes such as antigen processing and positive regulation of T cell aggregation, angiogenesis, and cell adhesion, migration, and proliferation of presenting cells. The cell components were mainly concentrated on the cell surface, transport vesicle membrane, endocytic vesicle membrane, and involved in the composition of the MHC class II protein complex. As for molecular function, the results showed that genes were mainly involved in MHC class II receptor activity, growth factor activity, signal transduction activity, calmodulin-binding activity, etc. (p < 0.05) (A). KEGG pathway analysis showed that these genes were mainly involved in antigen processing and presentation-related pathways, PI3K-Akt signaling pathway, Ras signaling pathway, and cancer-related signaling pathways (p < 0.05) (B).
Figure 2. Gene ontology (A) and KEGG (B) pathway analysis of DEGs. The top 10 pathway with the smallest p value were selected for plotting.
Protein interaction network (PPI) and hub gene identification
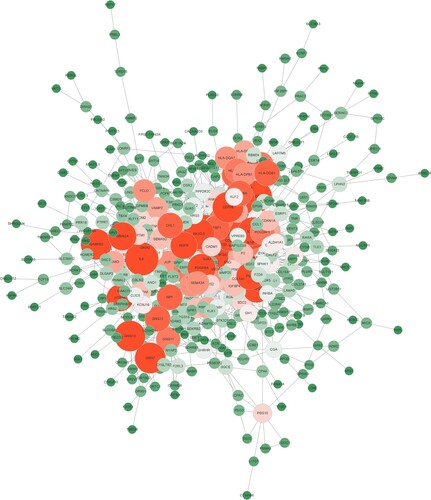
A total of 580 proteins and 647 edges were obtained with a cut-off value of credibility > 0.7. The average interaction between each node was 2.23, and the aggregation coefficient was 0.315, as shown in .
Figure 3. Differential gene-protein interaction networks.
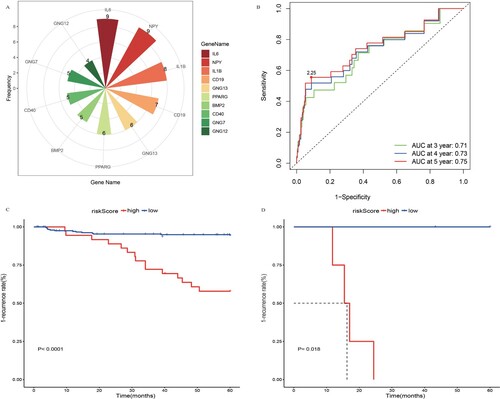
Frequency statistics were carried out for the top 10 genes scored by various algorithms, and the top 10 genes (NPY, IL1B, IL6, BMP2, PPARG, CD19, GNG13, CD40, GNG7, and GNG12) with the highest occurrence frequency were regarded as hub genes (Supplementary Table 1 and A).
Figure 4. Identification and validation of hub genes. (A) Top 10 genes with the highest occurrence frequency of twelve topological analysis methods. (B) ROC curve of the prediction model at multiple time points across 3–5 years. (C) Kaplan-Meier curve of high risk and low-risk group in training dataset. D Kaplan-Meier curve of high risk and low-risk group in validation dataset.
PPARG, CD19, and GNG12 were obtained by Cox regression analysis
Univariate Cox regression analysis was performed for the top 10 hub genes using Survival packet (recurrence as the outcome variable, time without recurrence as time-variable). The results showed that all 10 hub genes were statistically significant, and they were included in multivariate Cox regression analysis ().
Table 2. Cox regression results of hub gene.
The results of multivariate analysis showed that there were three genes with significant differences, namely PPARG, CD19, and GNG12 (). In the CNS relapsed group, PPARG (logFC = −2.67) was down-regulated expression, while CD19 (logFC = 2.06) and GNG12 (logFC = 2.20) were up-regulated expression. The risk model was obtained according to the regression results as follows:
For the obtained risk model, the ROC curves at multiple time points across 3–5 years were done in batches to compare and screen out the time point at which the maximum AUC was obtained. The results showed that the model established in this study has a good predictive ability in predicting the 5-year relapse rate (AUC max = 0.75) (B).
We calculated the risk score of the 278 research objects. The true positive and false positive difference maximum points were taken as cut-off of the risk score. Values above this score were defined as high-risk group, and below this score as a low-risk group. Kaplan–Meier survival curve and log-rank test were adopted to appraise the association of the overall survival (C).
In order to verify the accuracy of the model, we used transcriptome and clinical data collected from the COG collaboration group in the Target database for the phase I of childhood ALL for validation. The expression levels of the three target genes identified in the study were included in the model, and the risk values were calculated. The validation dataset was also divided into high- and low-risk groups, and survival analysis (K-M curve) was performed. Our results proved that the established model has a good predictive ability (p = 0.018) (D).
The risk score can be used as an independent prognostic factor
To judge whether the model’s risk score can be used as an independent predictor of a childhood ALL relapse of CNS, we conducted Cox regression analyses with clinical data (). The results showed that the risk score was statistically significant in univariate (HR = 3.06, 95%CI = 1.30–7.19, p = 0.011) and multivariate (HR = 1.81, 95%CI = 1.16–2.32, p = 0.046) Cox regression analysis. CNS3 vs. CNS1 (HR = 5.74, 95%CI = 2.01–16.4, p = 0.001) and T cell vs. B cell (HR = 1.63, 95%CI = 1.06–2.49, p = 0.026) were significantly different between the two groups; while no difference was found for patients’ gender (HR = 1.20, 95%CI = 0.72–2.02, p = 0.490).
Table 3. Cox regression results of independent predictors.
Construction of the Nomogram
We established a nomogram for the prediction of 3-year and 5-year recurrence rate in training dataset. Six independent risk factors such as age, sex, WBC at diagnosis, CNS classification, cell origin, and predictive model risk score were included in the model. (). The points of the factors indicate their corresponding contribution to the survival probability. The total points of each patient provided the estimated 3-year and 5-year recurrence rate. The C-index of our nomogram was 0.791(95%CI = 0.779–0.803). The actual recurrence rate and nomogram-predicted recurrence rate matched well at 3 and 5 years, as shown by the calibration curves( B、C)
Figure 5. Nomogram Predicting recurrence rate for CNSL Patients in training dataset. (A) The nomogram was constructed based on six prognostic factors. The calibration plots for the internal validation of the nomogram predicting 3-year (B) and 5-year (C) recurrence rate.
We stratified the analysis of the expression level of the CD19 gene according to the source of T cells and B cells. The results showed that this gene differed only in B lymphocytic leukemia (p = 0.018), as shown in .
Table 4. Layered analysis of CD19 gene between T cells and B cells.
Discussion
The CNS is a common site for the relapse of ALL. Yet, considering that most drugs cannot pass through the brain blood–brain barrier (BBB), the treatment of CNS leukemia is still very challenging [Citation17]. Therefore, identifying new potential biomarkers that could predict CNS relapse in children is extremely important. In this study, bioinformatics correlation analysis was used to identify biomarkers, revealing that PPARG, GNG12, and CD19 were independent prognostic factors for childhood ALL with CNS relapse.
PPARG gene is a member of the nuclear receptor family, which encodes peroxisome proliferative activated receptor gamma (PPARγ), PPARγ was first identified in adipocytes, as a transcription factor, the PPARγ receptor binds to its ligand, inhibits tumor proliferation, metastasis, and angiogenesis, and promotes apoptosis and immune regulation by activating signaling pathways of different tumor cells and tumor stem cells [Citation18]. For example, PPARγ can induce apoptosis by inhibiting the PI3K/Akt signaling pathway, PPARγ ligand can induce the apoptosis of leukemia cells, and can be potentially used to treat hematologic malignancies, especially leukemia [Citation19]. In our study, we found a low expression of PPARG in childhood ALL with CNS relapse. Moreover, KEGG analysis showed the activation of the PI3K/Akt signaling pathway, which suggests that PPARG might regulate CNS relapse in ALL children through the PI3K/Akt signaling pathway. Boyd et al. [Citation20] found that the injection of PPARS antibody agonist could induce adipogenesis in bone marrow tissue in mice, thereby saving healthy hematopoietic cell formation during the inhibition of leukemia cell growth. The most common way leukemia cells invade the central nervous system is from the bone marrow of the skull to the subarachnoid space via dural bridging vein [Citation21]. When the expression of the PPARG gene is low, this induction function of PPARs is inhibited, which might in turn lead to the CNS relapse of ALL in children.
The GNG12, a gene encoding Gγ12, a member of the G12 subfamily of heterotrimeric G proteins, is involved in the regulation of expression and distribution of tightly connected endothelial cells [Citation22]. The BBB is mainly composed of tight junctions (TJ) found between endothelial cells, which limit the passage of substances in the brain [Citation23]. Donato et al. found that the heterotrimer G protein has an important role in TJ’s formation and regulation, which is regulated through the intercellular signaling pathway and has an important influence on the BBB structure [Citation24]. It has also been found that Gγ12 preferentially interacts with adrenergic receptors in activated central synapses [Citation25]. Adrenergic receptors are involved in the regulation of protein kinase A(PKA) and cAMP [Citation26]. The BBB appears to be highly sensitive to PKA levels and opens when cAMP and PKA levels decrease [Citation27]. This may result in leukemic cells crossing the blood–brain barrier more easily and invading the CNS.
CD19 plays a key role in maintaining the balance of humoral immunity, antigen induction, and immune tolerance. The relationship between CD19 and ALL has not been fully defined. Still, it is well known that CD19 is the most densely expressed antigen on B cells’ surface in ALL patients and is a highly specific target for drug development [Citation28]. In particular, CAR T cells can penetrate the BBB into the CNS, killing leukemic cells in the cerebrospinal fluid [Citation29]. Jin MY et al. [Citation13] reported two cases of acute leukemia patients with CNSL, which showed positive CD19 expression in tumor cell immunotyping and remission after anti-CD19 CAR T cell therapy. In addition, studies have reported the efficacy of anti-CD19 CAR T cell therapy in patients with ALL-CNSL [Citation30,Citation31]. These treatments further revealed the relationship between CD19 and CNSL and also verified the high relapse risk of CNS in patients with high expression of the CD19 gene in this study. Meanwhile, stratified analysis results show that this difference only appeared in B-ALL, which also verified the reliability of the results of this study. In other words, the high expression of the CD19 gene is not only a marker of B-ALL but may also lead to CNS relapse when its expression level reaches a certain level.
In this study, the cell composition, molecular function, biological process, and KEGG pathway corresponding to the DEGs were enriched and analyzed. These results revealed a related pathway leading to the relapse of CNS, in which calmodulin-binding was related to the molecular composition and signal regulation of the tight junction of the BBB. Some researchers have reported that leukemia cells enter CNS via vascular transport, which involves the interaction between A6 integrin and laminin and can be blocked by specific PI3K inhibitors [Citation32]. Our results further suggest that CNS relapse in childhood ALL is related to the PI3K-Akt signaling pathway. In addition, cell adhesion molecules (CAMs), antigen processing and presentation, and neuroactive ligand–receptor interactions provide upstream and downstream factors and targets for future studies on CNSL recurrence, which should be further explored.
The results of our study confirmed that CNS grade 3 at initial diagnosis was a risk factor for CNS relapse, which was consistent with previous studies [Citation7]. Our data also suggested that T lymphocytic leukemia in children was more likely to lead to CNS relapse than B lymphocytic leukemia, which was also consistent with previous relevant reports [Citation33,Citation34]. This study failed to prove that hyperleukocytosis and male in patients were high-risk factors for CNS relapse, which was inconsistent with previous studies [Citation6,Citation35], We speculate that it may be due to sample differences and should be further clarified by future studies. Moreover, we established a nomogram for clinical-decision support that could well predict the 3- year and 5-year recurrence rate for CNSL patients by incorporating the three biomarkers and prognostic factors.
There are some limitations in our study. First, prognostic value of the critical genes was only analyzed and validated in the TARGET dataset. Thus, the results need to be validated in other databases. Second, the sample size in the validation dataset was limited and there are many missing clinical data in the training dataset. In addition, our study was based on a purely bioinformatic analysis. Therefore, further experiments are needed to verify the results.
To sum up, this study verified that CNS3 classification and the types of T lymphocytes are risk factors for CNS relapse of childhood ALL. We found that PPARG, GNG12, and CD19 can be used as independent predictors of CNS relapse in childhood ALL, yet, more studies are needed to confirm these findings. Our results may provide a theoretical basis for further studies to elucidate the molecular mechanism of CNS relapse in childhood ALL and provide more therapeutic targets for future clinical interventions.
Supplemental Material
Download PNG Image (10.4 MB)
Supplemental Material
Download MS Word (23.1 KB)Acknowledgments
We acknowledge the TARGET database for providing their platforms and contributors for uploading their meaningful datasets.
Disclosure statement
No potential conflict of interest was reported by the authors.
Data availability statement and ethical approval
The results published here are in whole based upon data generated by the Therapeutically Applicable Research to Generate Effective Treatments (https://ocg.cancer.gov/programs/target) initiative, phs000218. The patients involved in the database have obtained ethical approval. Users can download relevant data for free for research and publish relevant articles, so there are no ethical issues and other conflicts of interest. The data used for this analysis are available at https://portal.gdc.cancer.gov/projects.
Additional information
Funding
References
- Mueller KT, Maude SL, Porter DL, et al. Cellular kinetics of CTL019 in relapsed/refractory B-cell acute lymphoblastic leukemia and chronic lymphocytic leukemia. Blood. 2017;130(21):2317–2325.
- Ikonomidou C. Cerebrospinal fluid biomarkers in childhood leukemias. Cancers (Basel). 2021;13:438.
- Saeedi A, Baghestani A, Khadem Maboudi A, et al. Determining the significant prognostic factors for the recurrence of pediatric acute lymphoblastic leukemia using a competing risks approach. Iran J Med Sci. 2020;45(4):304–310.
- He GQ, Dai YL, Jiang MY, et al. Obesity as a prognostic factor of central nervous system relapse in children with acute lymphoblastic leukemia: a single-centre study and literature review. Evid Based Complement Alternat Med. 2022;2022: 7783823.
- Kinjyo I, Bragin D, Grattan R, et al. Leukemia-derived exosomes and cytokines pave the way for entry into the brain. J Leukoc Biol. 2019;105(4):741–753.
- Matloub Y, Lindemulder S, Gaynon PS, et al. Intrathecal triple therapy decreases central nervous system relapse but fails to improve event-free survival when compared with intrathecal methotrexate: results of the children’s cancer group (CCG) 1952 study for standard-risk acute lymphoblastic leukemia, reported by the children’s oncology group. Blood. 2006;108(4):1165–1173.
- Sirvent N, Suciu S, De Moerloose B, et al. CNS-3 status remains an independent adverse prognosis factor in children with acute lymphoblastic leukemia (ALL) treated without cranial irradiation: results of EORTC children leukemia group study 58951. Arch Pediatr. 2021;28(5):411–416.
- Xu LH, Geng X, Liao N, et al. Prognostic significance of CNSL at diagnosis of childhood B-cell acute lymphoblastic leukemia: a report from the south China children’s leukemia group. Front Oncol. 2022;12:943761.
- Prieto C, López-Millán B, Roca-Ho H, et al. NG2 antigen is involved in leukemia invasiveness and central nervous system infiltration in MLL-rearranged infant B-ALL. Leukemia. 2018;32(3):633–644.
- Gossai NP, Gordon PM. The role of the central nervous system microenvironment in pediatric acute lymphoblastic leukemia. Front Pediatr. 2017;5:90.
- Gaynes JS, Jonart LM, Zamora EA, et al. The central nervous system microenvironment influences the leukemia transcriptome and enhances leukemia chemo-resistance. Haematologica. 2017;102(4):e136–e1e9.
- Jaime-Pérez JC, Pinzón-Uresti MA, Jiménez-Castillo RA, et al. Relapse of childhood acute lymphoblastic leukemia and outcomes at a reference center in Latin America: organomegaly at diagnosis is a significant clinical predictor. Hematology. 2018;23(1):1–9.
- Jin MY, Han Y, Liu YJ, et al. [Treatment of central nervous system leukemia with CD19-chimeric antigen receptor T-cell immunotherapy: two cases report and literature review]. Zhonghua Xue Ye Xue Za Zhi. 2018;39(8):650–653.
- Sherman BT, Hao M, Qiu J, et al. DAVID: a web server for functional enrichment analysis and functional annotation of gene lists (2021 update). Nucleic Acids Res. 2022;50(W1):W216–W221.
- Szklarczyk D, Gable AL, Nastou KC, et al. The STRING database in 2021: customizable protein-protein networks, and functional characterization of user-uploaded gene/measurement sets. Nucleic Acids Res. 2021;49(D1):D605–Dd12.
- Wang R, Ma H, Wang C. An ensemble learning framework for detecting protein complexes from PPI networks. Front Genet. 2022;13:839949.
- Lenk L, Alsadeq A, Schewe DM. Involvement of the central nervous system in acute lymphoblastic leukemia: opinions on molecular mechanisms and clinical implications based on recent data. Cancer Metastasis Rev. 2020;39(1):173–187.
- Janani C, Ranjitha Kumari BD. PPAR gamma gene–a review. Diabetes Metab Syndr. 2015;9(1):46–50.
- Yousefnia S, Momenzadeh S, Seyed Forootan F, et al. The influence of peroxisome proliferator-activated receptor γ (PPARγ) ligands on cancer cell tumorigenicity. Gene. 2018;649, 14-22.
- Boyd A, Bhatia M. Acute myeloid leukaemia disrupts endogenous myelo-erythropoiesis by compromising the adipocyte bone marrow niche. Nat Cell Biol. 2017;19(11):1336–1347.
- Zhou F, Wen Y, Jin R, et al. New attempts for central nervous infiltration of pediatric acute lymphoblastic leukemia. Cancer Metastasis Rev. 2019;38(4):657–671.
- Li J, Jin C, Zou C, et al. GNG12 regulates PD-L1 expression by activating NF-κB signaling in pancreatic ductal adenocarcinoma. FEBS Open Bio. 2020;10(2):278–287.
- Langen UH, Ayloo S, Gu C. Development and cell biology of the blood-brain barrier. Annu Rev Cell Dev Biol. 2019;35: 591–613.
- González-Mariscal L, Raya-Sandino A, González-González L, et al. Relationship between G proteins coupled receptors and tight junctions. Tissue Barriers. 2018;6:e1414015.
- Yim YY, Betke KM, McDonald WH, et al. The in vivo specificity of synaptic Gβ and Gγ subunits to the α(2a) adrenergic receptor at CNS synapses. Sci Rep. 2019;9:1718.
- Shi Q, Li M, Mika D, et al. Heterologous desensitization of cardiac β-adrenergic signal via hormone-induced βAR/arrestin/PDE4 complexes. Cardiovasc Res. 2017;113(6):656–670.
- Fukuda S, Nakagawa S, Tatsumi R, et al. Glucagon-Like peptide-1 strengthens the barrier integrity in primary cultures of Rat brain endothelial cells under basal and hyperglycemia conditions. J Mol Neurosci. 2016;59(2):211–219.
- Pacenta HL, Laetsch TW, John S. CD19 CAR T cells for the treatment of pediatric Pre-B cell acute lymphoblastic leukemia. Paediatr Drugs. 2020;22(1):1–11.
- Maus MV, Grupp SA, Porter DL, et al. Antibody-modified T cells: CARs take the front seat for hematologic malignancies. Blood. 2014;123(17):2625–2635.
- Qi Y, Zhao M, Hu Y, et al. Efficacy and safety of CD19-specific CAR T cell-based therapy in B-cell acute lymphoblastic leukemia patients with CNSL. Blood. 2022;139(23):3376–3386.
- Nair S, Wang JB, Tsao ST, et al. Functional improvement of chimeric antigen receptor through intrinsic interleukin-15Rα signaling. Curr Gene Ther. 2019;19(1):40–53.
- Yao H, Price TT, Cantelli G, et al. Leukaemia hijacks a neural mechanism to invade the central nervous system. Nature. 2018;560(7716):55–60.
- Gupta S, Teachey DT, Chen Z, et al. Sex-based disparities in outcome in pediatric acute lymphoblastic leukemia: a children’s oncology group report. Cancer. 2022;128(9):1863–1870.
- Schrappe M, Reiter A, Ludwig WD, et al. Improved outcome in childhood acute lymphoblastic leukemia despite reduced use of anthracyclines and cranial radiotherapy: results of trial ALL-BFM 90. German-Austrian-Swiss ALL-BFM study group . Blood. 2000;95(11):3310–3322.
- Tevatia MS, Sharma I, Jadhav T, et al. Isolated CNS relapse in acute lymphoblastic leukemia (ALL): an experience from a tertiary care center. J Lab Physicians. 2021;13(2):134–138.