
ABSTRACT
Objectives
Body composition assessment is comprised by skeletal muscle mass (SMM) and subcutaneous and visceral adipose tissue (SAT and VAT) and can be quantified by imaging. It can be predictive of several clinically outcomes in patients with hematological diseases. Our aim was to establish the effect of body composition parameters on overall survival (OS) and progression-free survival (PFS) in patients with multiple myeloma (MM).
Materials and methods
All patients with MM were retrospectively analyzed between 2009 and 2019. One hundred twenty-three patients were included into the analysis. Whole-body computed tomography (CT) was used to calculate SMM, VAT, and SAT.
Results
Overall, 22 patients (17.9%) of the patient sample died. Forty patients were sarcopenic (32.5%), 79 patients were visceral obese (64.2%), and 18 patients (14.6%) were sarcopenic obese. Parameter of body composition did not influence OS: sarcopenia, hazard ratio (HR) = 1.3 (95% CI 0.50–3.34), p = .59; visceral obesity, HR = 1.6 (95% CI 0.70–3.76), p = .26; sarcopenic obesity, HR = 2.3 (95% CI 0.90–5.63), p = 0.08. Patients with infectious complications showed higher VAT values.
Conclusions
CT-defined body composition parameters have no influence on survival in patients with MM undergoing autologous stem-cell therapy. These results corroborate previous smaller studies that body composition might have a limited role in this tumor entity. VAT may predict the occurrence of infectious complications.
KEYWORDS:
Introduction
Sarcopenia is defined in the literature as a progressive loss of skeletal muscle mass, strength, and function below 2 standard deviations of the general population. Reasons for this process are as primary cause due to aging or secondary due to malnutrition, diseases, and physical inactivity [Citation1,Citation2]. Hence, prevalence of sarcopenia depends on age resulting in a frequency over half of the patients above 80 years [Citation1,Citation2]. The term low-skeletal muscle mass (LSMM) is a well-established predictive and prognostic factor for several clinically important outcomes, especially well investigated in the field of oncology [Citation3–7].
One the one hand, LSMM can be assessed by clinical tests, such as anthropometrical measures (i.e. mid-arm muscular circumference, triceps skinfold thickness). On the other hand, body tissue composition defined by cross-sectional imaging is considered as a more reliable method to quantify LSMM [Citation1,Citation2].
For this approach, a single axial slice of computed tomography (CT) images is utilized. Most common used is a slice obtained of the L3 intervertebral height to quantify the muscle area, which consists of the paraspinal, abdominal wall, and psoas muscles [Citation6,Citation7].
Another aspect of the modern body composition assessment is the calculation of different fat areas. These comprise visceral adipose tissue (VAT), subcutaneous adipose tissue (SAT), and total adipose tissue (TAT). Different fat fractions show different associations with clinically outcomes in various tumors entities, as demonstrated in recent studies [Citation6,Citation7]. One important one is the combination of sarcopenia and visceral obesity called sarcopenic obesity, which seems to be a strong predictor of worse outcome in oncology patients [Citation8,Citation9].
Noteworthy, the CT is performed for staging purposes and the body composition parameters can be obtained as a by-product. Thus, there is no need for extra imaging costs or time.
Regarding patients with multiple myeloma (MM), body composition assessment might be of special interest, as these patients are of severe risk for anorexia, malnutrition, and muscle wasting [Citation10–12]. Moreover, frailty and potential risk for fractures are of utter importance, as these patients can frequently develop pathological osteolysis [Citation12]. The association between the risk of fractures and LSMM has been established in patients with osteoporosis with results [Citation13,Citation14]. Moreover, the prognostic effect of LSMM assessment was demonstrated in hematological diseases in a recent meta analysis [Citation15]. However, the exact benefit in MM patients is still scarce and further research is needed in this disease. In MM patients this can also be of great importance as the patients undergo regular staging CT investigations to rule out or diagnose new osteolysis.
Therefore, the aim of the present study was to assess the associations between body composition parameters derived from CT images for overall and progression-free survival in MM patients undergoing autologous stem-cell therapy (aPBSCT).
Materials and methods
Patient acquisition
This retrospective observational study was approved by the institutional review board (IRB 00001750; registration number 118/18-ek).
All patients with MM were retrospectively included between the time period 2009–2019. Overall, 123 patients (47 female patients, 38.2%) with a mean age of 57.9 ± 7.8 years were identified in the database, which had sufficient clinical and imaging data for the analysis.
Clinical parameters
The following clinical parameters were retrieved from the patients’ records: blood cell count; the serum levels of C-reactive protein, lactate dehydrogenase (LDH), b2-microglobulin, creatinine, albumin, and calcium; creatinine clearance as a factor of kidney insufficiency; quality and quantity of M protein in blood and urine samples; clinical stage according to the Salmon and Duriee classification and International Staging System (ISS); hypercalcemia, renal failure, anemia, and/or a diagnosis of the bone lesion (CRAB); cytogenetics: autologous peripheral blood stem-cell transplantation (aPBSCT); response to previous chemotherapy; the disease progression was evaluated according to the guidelines of the International Myeloma Working Group [Citation16]; death with overall survival. Weight, height, and BMI were additionally collected to calculate SMI.
Imaging technique
CT imaging was performed on a 128-slice or 256-slice clinically used CT scanner (Ingenuity or iCT256, Philips, Hamburg, Germany). The CT investigation at diagnosis was used for the body composition calculation. The used imaging parameters were 120 kVp, 36 mAs, collimation of 64 × 0.6 mm and pitch of 0.8. The scan length included the following body regions: head, neck, chest, abdomen/pelvis, upper limb, and the proximal half of the lower limb. The minimal slice thickness was 1 mm.
The CT technique can be considered similar to standard low-dose CT for attenuation correction in Positron-emissions tomography.
LSMM calculation
Body composition parameter was semiautomatically quantified with ImageJ software 1.48v (National Institutes of Health Image program). Skeletal muscle areas were calculated on the level L3 including, psoas muscle, paraspinal muscles, and the abdominal wall muscles. The muscle area was identified employing the HU threshold levels of −29 and 150 HU, as proposed in similar studies [Citation3,Citation7]. The skeletal muscle area was dived by the height to calculate the skeletal muscle index (SMI). For sarcopenia definition, the SMI threshold proposed by Prado et al. was used: 52.4 cm²/m² for male and 38.5 cm²/m² for female [Citation3].
Adipose tissue quantification
VAT and SAT were calculated on the same level as the muscle areas. TAT is the sum of both areas.
The fat areas were semiautomatically identified employing the HU threshold levels of −190 and −30 HU [Citation7]. The proposed threshold value of 100 cm² was used as a threshold value to determine visceral obesity for VAT and to divide the patients into high subcutaneous and low subcutaneous fat area [Citation17].
Sarcopenic obesity was defined as the occurrence of sarcopenia and visceral obesity.
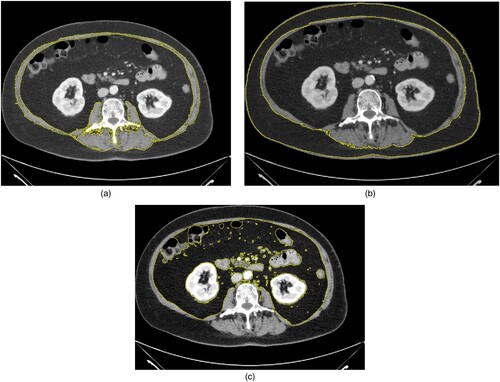
displays a representative patient of the study to show the body composition quantifications.
Figure 1. Explanatory patient of the patient sample. The region of interest is drawn to measure the skeletal muscle area (a), (b) subcutaneous fat area, and (c) visceral fat area. The patient was sarcopenic and was visceral obese with a VAT of 120 cm².
Statistical analysis
The statistical analysis and graphics creation were performed utilizing GraphPad Prism (GraphPad Software, La Jolla, CA, USA) and SPSS package (IBM SPSS Statistics for Windows, version 225.0: IBM Corporation, Chicaco, IL, USA). Data were expressed by means of descriptive statistics (absolute and relative frequencies). Spearman’s correlation coefficient (r) was used to analyze associations between the body composition parameters and the clinical parameters. Possible group differences were tested with Mann–Whitney test and Fisher exact test, when suitable. Cox regression analysis was used for associations with overall and progression-free survival. Kaplan–Meier analysis was performed for overall survival analysis. For all tests, p-values <.05 were used to express statistical significance.
Results
Patients and body composition
Overall n = 22 patients (17.9%) of the patient sample died with a median of 24 months of PFS, range 3–109 months. All cases died due to MM-related causes.
provides an overview of the demographics of the investigated patient sample.
Table 1. Baseline characteristics, treatments, and causes of death.
According to the threshold definition by Prado et al., 40 patients were considered as sarcopenic (32.5%). According to the threshold for visceral obesity, 79 patients were considered as visceral obese (64.2%). Only 18 patients (14.6%) were considered as sarcopenic obese.
Correlation analysis
A weak correlation was identified between SMI and Hb (r = 0.19, p = .03), no other parameter correlated with SMI.
There was a weak correlation between VAT with IgM (r = 0.20, p = .03) and with glomerular clearance rate (r = −0.24, p = .008).
No significant correlation was identified between ISS stage and the investigated CT parameters.
Moreover, there were no statistically significant correlations between CT parameters with albumin serum levels, a parameter for malnutrition (with SMI r = .11, p = .24, with VAT r = .07, p = .44, with SAT r = 0.14, p = .13).
Infectious complications
Eight patients (6.5%) suffered from therapy-associated infectious complications.
SMI was not different between patients with complications and without (mean 43.5 ± 12.8 cm2/m2 versus 50.8 ± 8.9 cm2/m2, p = .96). Similar results were identified for SAT (mean 234.7 ± 107.9 cm2 versus 151.0 ± 95.1 cm2, p = .68).
VAT was higher in patients with infectious complications compared to without (mean 243.7 ± 107.9 cm2 versus 151.0 ± 95.3 cm2, p = .04).
Survival analysis
Body composition parameters did not show prognostic relevance for progression-free or overall-survival ( and ). Sarcopenia did not predict OS, HR = 1.3 (95% CI 0.50–3.34, p = .59) and PFS, HR = 1.42 (95% CI 0.55–3.67, p = .46). Also, visceral obesity did not influence survival, OS: HR = 1.6 (95% CI 0.70–3.76, p = .26), PFS: HR = 1.59 (95% CI 0.68–3.69, p = .24). Finally, sarcopenic obesity was not associated with OS, HR = 2.3 (95% CI 0.90–5.63, p = .08). However, sarcopenic obesity had a statistical trend for PFS, HR = 2.22 (95% CI 0.90–5.50, p = .08).
Table 2. Cox regression analysis for the effect of the investigated body composition parameters on OS (Univariable Analysis).
Table 3. Cox regression analysis for the effect of the investigated body composition parameters on PFS (Univariable Analysis).
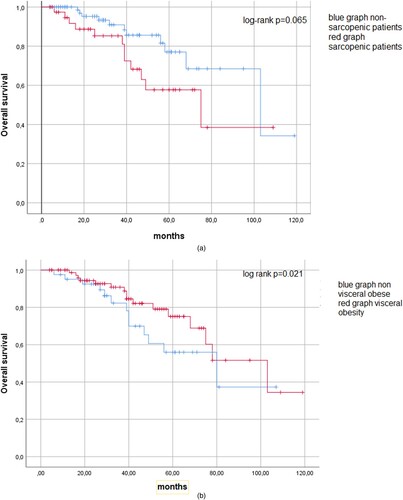
Similar results were depicted by Kaplan–Meier analysis (). There was a statistical trend between sarcopenia and non-sarcopenic patients regarding overall survival (log-rank test p = .065). For visceral obesity (p = .021) there was also no difference between the groups.
Figure 2. (a) Kaplan–Meier curve for overall survival analysis. There was no statistically significant difference between sarcopenic and non-sarcopenic patients (p = .065). (b) Kaplan–Meier curve regarding overall survival comparing visceral obesity (p = .21)
Similar results were identified in further sub-analysis according to gender and older patients above 60 years.
Only the frequency of sarcopenic obesity showed a statistical trend to differ between survivors and non-survivors (p = .057) (). Other body composition parameters were not different between these groups.
Table 4. Comparison of body composition parameters according to survival.
Discussion
The present study investigated the impact of CT-defined body composition on OS and PFS in patients with MM undergoing autologous stem-cell therapy.
In short, the investigated body composition parameters were not of prognostic relevance in this patient collective, which might imply the lesser importance of body composition assessment in patients with MM compared to other tumor entities.
Yet, body composition is an evolving field of research with extensive studies in several disease entities with overall promising results [Citation1–7]. Noteworthy, various possible applications and interesting prognostic implications of LSMM and fat area assessment throughout many fields of clinical care were reported [Citation1–7]. It should be strengthened that body composition assessment is a by-product of imaging, which can easily be calculated [Citation6,Citation7].
For MM patients, cross-sectional imaging by whole-body CT and MRI is routinely acquired and should be used for forms of assessment beyond the sole detection of osteolysis and extramedullary manifestations [Citation16].
Especially oncologic and hematological patients are at risk of skeletal muscle loss due to several factors including prolonged bed rest and systematic inflammation [Citation1,Citation2]. Presumably, elderly patients with primary sarcopenia are more at risk for muscle wasting than patients without primary sarcopenia. The present analysis was presumably not able to detect these important patients at risk.
One important factor is a great variation of LSMM calculation throughout published studies [Citation1–5]. Most commonly, skeletal muscle index (SMI) is analyzed in the studies, which uses the whole muscle area on the L3 level which includes paraspinal, abdominal wall, and psoas muscle [Citation6,Citation7]. This index has a strong association with overall muscle area in the body. Moreover, especially for fat area assessment more heterogeneity exists with less standardization. One important point to consider is that LSMM is indexed to the body height, whereas for fat area assessment, most studies do not perform an index. Thus, the used approach in this study reflects the current status of the literature.
The importance of LSMM assessment for hematological diseases was shown in a recent meta analysis comprising 7 studies with overall 1578 patients [Citation15]. In the overall analysis pooling every hematological disease, sarcopenia was independently associated with lower OS HR = 1.94, CI 95% 1.30–2.90, p < .001 [Citation15]. However, most included studies investigated patients with lymphomas and leukemia, and only one study analyzed patients with MM [Citation10].
The effect of sarcopenia in patients with MM was then analyzed in small single-center studies. The frequency of sarcopenia in the present analysis was significantly lower compared to the reported 66% of patients within the study by Takeoka et al. [Citation10]. Contrary, to the present analysis Takeoka utilized the threshold values by Martin et al., which are slightly different compared to Prado et al. [Citation3,Citation10,Citation18]. This could explain the different frequency of sarcopenia between the patient samples.
In another recent study by da Cunha Júnior et al. the prognostic relevance of body composition derived from FDG-PET was investigated in 76 patients with MM [Citation11]. One key finding of this study was that the metabolic activity of the visceral fat area quantified by the SUV was strongly associated with the overall-survival with a HR of 13.36 (95% CI 3.12, 57.15, p < .001), which remained statistically significant in multivariate analysis [Citation11]. Furthermore, skeletal muscle areas and visceral fat areas did not imply prognostic relevance for overall survival [Citation11]. These aspects can be corroborated by the present analysis that conventional body composition assessment in MM does not harbor prognostic relevance. It is especially of importance, as MM patients should be staged by PET-CT nowadays. However, one should consider that the investigated body composition parameters can be considered reliable and stable between whole-body low-dose CT and the low-dose CT derived from PET-CT.
Another recent PET-CT study from Turkey investigated 105 patients with a metabolic approach of the PET aspect and a muscle density quantification using the CT aspect [Citation19]. The authors identified that the survival was associated with the metabolic information of the PET aspect (p = .016) but not with the CT density assessment in this study (p = .09) [Citation19]. One can assume that the metabolic information of the muscle tissue seems to be of greater prognostic relevance than the morphological information provided by CT.
Another interesting recent study investigated the frequency of sarcopenia by means of muscle quality [Citation20]. This study investigated 142 patients and defined sarcopenia by the threshold value of 80% of high density and consequently good quality employing Hounsfield unit quantification. The authors could show that sarcopenia was associated with early post-transplant cardiovascular diseases but was not associated with overall survival [Citation19]. The present study had a lower mortality rate compared to da Cunha (48.7%) and Takeoka (30.4%), which could be one reason to explain the differences between the studies [Citation10,Citation11].
Notably, sarcopenic obesity was not investigated previously in other studies. In the present analysis, sarcopenic obesity showed a trend to be associated with overall survival. This should be elucidated in further studies.
For other hematological diseases such as leukemia and lymphoma, there is a clear association between sarcopenia defined by CT images with overall survival, HR = 1.57 (95% CI 1.07–2.31), p = .02 and 3.05 (95% 2.30–4.05), p < .0001, respectively [Citation15]. The underlying reasons for the contradictory findings in MM should be further investigated.
Clearly, larger multi-centric analyses are needed to harmonize the current overall negative results regarding CT-body composition in patients with MM.
There are limitations of the present study to admit. First, the retrospective observational study design with possible inherent bias. Second, the patient sample is relatively small caused by the single-center design. Third, only patients undergoing aPBSCT were investigated in the present study. These patients are younger and more fit to undergo this extensive treatment. There might be a selection bias because of this. Moreover, older patients unfit for this treatment might have a higher prevalence of sarcopenia and for these patients sarcopenia might be of prognostic relevance. This should be investigated by further studies.
In conclusion, CT-defined body composition parameters have no influence on OS in patients with MM undergoing autologous stem-cell therapy. These results corroborate previous smaller studies that body composition might have a limited role in this tumor entity. VAT may predict the occurrence of infectious complications.
Ethical statement
This study was conducted and complied with all international and local laws, the principles of the Declaration of Helsinki, and the Good Clinical Practice Guidelines. The study protocol and all its amendments were approved by the relevant institutional review boards or independent ethics committees.
Disclosure statement
No potential conflict of interest was reported by the author(s).
References
- Wang C, Bai L. Sarcopenia in the elderly: basic and clinical issues. Geriatr Gerontol Int. 2012;12:388–396.
- Janssen I. The epidemiology of sarcopenia. Clin Geriatr Med. 2011;27:355–363.
- Prado CM, Lieffers JR, McCargar LJ, et al. Prevalence and clinical implications of sarcopenic obesity in patients with solid tumours of the respiratory and gastrointestinal tracts: a population-based study. Lancet Oncol. 2008;9:629–635.
- Fielding RA, Vellas B, Evans WJ, et al. Sarcopenia: an undiagnosed condition in older adults. Current consensus definition: prevalence, etiology, and consequences. International working group on sarcopenia. J Am Med Dir Assoc. 2011;12:249–256.
- Jang MK, Park C, Hong S, et al. Skeletal muscle mass change during chemotherapy: a systematic review and meta-analysis. Anticancer Res. 2020;40:2409–2418.
- Chianca V, Albano D, Messina C, et al. Sarcopenia: imaging assessment and clinical application. Abdom Radiol (NY). 2022;47:3205–3216.
- Hemke R, Buckless C, Torriani M. Quantitative imaging of body composition. Semin Musculoskelet Radiol. 2020;24:375–385.
- Batsis JA, Villareal DT. Sarcopenic obesity in older adults: aetiology, epidemiology and treatment strategies. Nat Rev Endocrinol. 2018;14:513–537.
- Choi KM. Sarcopenia and sarcopenic obesity. Korean J Intern Med. 2016;31:1054–1060.
- Takeoka Y, Sakatoku K, Miura A, et al. Prognostic effect of low subcutaneous adipose tissue on survival outcome in patients with multiple myeloma. Clin Lymphoma Myeloma Leuk. 2016;16:434–441.
- da Cunha Júnior AD, Silveira MN, Takahashi MES, et al. Visceral adipose tissue glucose uptake is linked to prognosis in multiple myeloma patients: an exploratory study. Clin Nutr. 2021;40:4075–4084.
- Zweegman S, Engelhardt M, Larocca A. EHA SWG on ‘aging and hematology’. Elderly patients with multiple myeloma: towards a frailty approach? Curr Opin Oncol. 2017;29:315–321.
- Wang WF, Lin CW, Xie CN, et al. The association between sarcopenia and osteoporotic vertebral compression refractures. Osteoporos Int. 2019;30:2459–2467.
- Nielsen BR, Abdulla J, Andersen HE, et al. Sarcopenia and osteoporosis in older people: a systematic review and meta-analysis. Eur Geriatr Med. 2018;9:419–434.
- Surov A, Wienke A. Sarcopenia predicts overall survival in patients with malignant hematological diseases: a meta-analysis. Clin Nutr. 2022;40:1155–1160.
- Rajkumar SV, Dimopoulos MA, Palumbo A, et al. International myeloma working group updated criteria for the diagnosis of multiple myeloma. Lancet Oncol. 2014;15:e538–e548.
- Saravana-Bawan B, Goplen M, Alghamdi M, et al. The relationship between visceral obesity and post-operative complications: a meta-analysis. J Surg Res. 2021;267:71–81.
- Martin L, Birdsell L, Macdonald N, et al. Cancer cachexia in the age of obesity: skeletal muscle depletion is a powerful prognostic factor, independent of body mass index. J Clin Oncol. 2013;31:1539–1547.
- Umit EG, Korkmaz U, Baysal M, et al. Evaluation of Sarcopenia with F-18 FDG PET/CT and relation with disease outcomes in patients with multiple myeloma. Eur J Cancer Care (Engl). 2020;29:e13318.
- Williams A, Baruah D, Patel J, et al. Prevalence and significance of sarcopenia in multiple myeloma patients undergoing autologous hematopoietic cell transplantation. Bone Marrow Transplant. 2021;56:225–231.