
ABSTRACT
Objectives:
MicroRNA (miRNA) is a kind of highly conserved single-stranded small endogenous non-coding RNA associated with multiple diseases, particularly cancer. The miRNAs expression profile in multiple myeloma (MM) has been barely elucidated.
Methods:
The miRNAs expression profiles in bone marrow plasma cells of 5 MM individuals and 5 iron-deficiency anemia volunteers were analyzed using RNA-sequencing. Quantitative polymerase chain reaction (QPCR) was performed to validate the expression of selected miR-100-5p. The biological function of selected miRNA was predicated by bioinformatics analysis. Finally, the function of miR-100-5p and its target on MM cells were evaluated.
Results:
MiRNA-sequencing showed that miR-100-5p was obviously upregulated in MM patients, which was further validated in an expanded cohort. Receiver operating characteristic curve analysis characterized miR-100-5p as a valuable biomarker of MM. Bioinformatics analysis predicted that miR-100-5p is targeted to CLDN11, ICMT, MTMR3, RASGRP3, and SMARCA5, and their low expression are associated with poor prognosis of MM patients. Kyoto encyclopedia of genes and genomes analysis suggested that the major interacting proteins of these five targets are mainly enriched in inositol phosphate metabolism and phosphatidylinositol signaling system pathway. In vitro study showed that miR-100-5p inhibition promoted the expression of these targets, especially MTMR3. In addition, miR-100-5p inhibition declined living number and metastasis, whereas promoted apoptosis of RPMI 8226 and U266 MM cells. The function of miR-100-5p inhibition was weakened by MTMR3 inhibition.
Conclusion:
These results indicates that miR-100-5p is a promising biomarker for MM, and that it may involve in the pathogenesis of MM by targeting MTMR3.
Introduction
Multiple myeloma (MM) is the most prevalent type of malignant plasma cell diseases, characterized by abnormal proliferation of bone marrow plasma cells and overproduction of monoclonal immunoglobulin or light chain, accounting for 1% of all malignancies and 10% of hematological malignancies [Citation1,Citation2]. Its clinical manifestations are bone pain and fracture, anemia, renal insufficiency, hypercalcemia, and infection, with significant heterogeneity [Citation2]. Despite the development of novel drugs, such as immunomodulatory agents (lenalidomide and pomalidomide) and proteasome inhibitors (bortezomib, ixazomib, and carfilzomib), MM is still incurable and often occurs relapse [Citation3,Citation4]. Therefore, it is urgent to understand the molecular mechanism of MM, uncovering new therapeutic targets to develop novel treatment strategy and improve the prognosis of MM patients.
MicroRNA (miRNA) is a kind of highly conserved single-stranded small endogenous non-coding RNA and widely exists in various eukaryotes, showing an important regulatory effect in many biological processes, such as proliferation, differentiation, apoptosis, and signal transduction of somatic cells [Citation5,Citation6]. Accumulating studies have confirmed that miRNA is involved in the progression of various tumors by regulating proliferation, apoptosis, differentiation, and metastasis of tumor cells [Citation7–9]. Evidences has demonstrated that heterogeneously expressed miRNAs show a crucial function in MM pathology, including tumor initiation, progression, metastasis, prognosis, and drug response [Citation10]. MiRNAs are involved in regulating the interaction between myeloma cells and bone marrow microenvironment in MM. miRNA can affect the immune and metabolic state of bone marrow microenvironment, and microenvironment changes also affect the nutritional environment of myeloma cells, indicating miRNAs as expected targets and prognostic biomarkers for MM therapy [Citation11]. As reported by Papadimitriou et al., miR-181a is upregulated in MM patients, strongly associated with inferior disease outcome, demonstrating miR-181a as a personalized prognostic biomarker and treatment target [Citation12].
Herein, we first evaluated the miRNAs expression profiles in bone marrow plasma cells of 5 MM individuals (MM group) and 5 iron-deficiency anemia volunteers (Control group), founding that miR-100-5p was significantly overexpressed in MM samples, which was validated using quantitative polymerase chain reaction (qPCR). Moreover, we predicted the biological function of miR-100-5p by bioinformatics analysis, and investigate the potential function of miR-100-5p in the pathogenesis of MM.
Materials and methods
Study population
A total of 21 patients with MM admitted to Gansu Provincial People’s Hospital from July 2021 to June 2022 were selected, and another 30 patients with iron deficiency anemia admitted at the same time were set as control group. Patients were diagnosed as MM according to the criteria of International Myeloma Working Group 2014 (IMWG) [Citation13]. MM patients with the presence of other malignancies, complicated with other autoimmune diseases and hematological malignancies, during pregnancy and lactation, or with mental disorders and inability to cooperate with treatment were excluded. The baseline characteristics of patients were collected, including age, gender, leukocytes, hemoglobin, platelets, albumin, globulin, β2 microglobulin, blood calcium, lactate dehydrogenase, diagnosis stage (DS, ISS, and R-ISS), ECOG performance score, proportion of plasma cells, and extramedullary lesions. The details were shown in . All individuals received 4 mL of bone marrow blood isolated plasma cells for RNA sequencing. The research was approved by the Ethics Committee of Gansu Provincial People’s Hospital (Approval number: 2022-234). All patients voluntarily participated in the trial and signed informed consent.
Table 1. Baseline characteristics of MM patients.
RNA sequencing (RNA-seq)
Total RNA was extracted from bone marrow plasma cells using TRIzol reagent (Invitrogen, Cat. NO:15596026) according to the methods reported by Chomczynski et al. [Citation14]. Thereafter, DNA digestion was carried out using DNaseI. RNA quality was determined by examining A260/A280 using NanodropTM OneCspectrophotometer (Thermo Fisher Scientific Inc), and its integrity was confirmed by 1.5% agarose gel electrophoresis. The collected qualified RNAs were finally quantified by Qubit3.0 using QubitTM RNA Broad Range Assay kit (Life Technologies, Cat. NO: Q10210). 3 μl of extracted RNA in each sample was utilized for miRNA library preparation using small RNA Library Prep Kit for Illumina following the manufacturer’s instruction. The eluted cDNA library was separated by 6% PAGE gel, and ∼160 bp bands were isolated, purified, and quantified by Qubit3.0, subsequently sequenced using Hiseq X-10 sequencer (Illumina) with PE150 model.
miRNA-Seq data analysis
To obtain clean reads, low-quality reads were filtered using fastx_toolkit software (version: 0.0.13.2), and adaptor sequences were trimmed using cutadapt software (version: 1.15). Clean Reads were then treated with in-house scripts to eliminate duplication bias introduced in library preparation and sequencing. In brief, clean reads were clustered according to the UMI sequences, in which reads with the same UMI sequence were grouped into the same cluster. Reads in the same cluster were compared to each other by pairwise alignment, and then reads with 100% sequence identity were extracted to a new sub-cluster. Thereafter, multiple sequence alignment was performed to get one consensus sequence for each sub-cluster to eliminate any errors and biases introduced by PCR amplification or sequencing. The de-duplicated consensus sequences were mapped to the human reference genome (GRCh37/HG19), using bowtie (version: 1.1.2) with default parameters. The package of mirdeep2 (version:2.0.0.8) was used for mapping the reads to the known primary-miRNA in the database of miRBase and predicting the novel miRNA. The miRNA differential expressed between groups was identified using the edgeR package (version: 3.12.1). A cutoff of p-value < 0.05 and |Log2Fold-change| >1 were used to evaluate the statistical significance of miRNA expression differences.
Bioinformatics analysis
The target mRNA of the most obvious differentially expressed known miRNA was predicted by miRanda v3.3a (http://www.microrna.org/microrna/home.do/), miRWalk v 3.0 (http://mirwalk.umm.uni-heidelberg.de/), and PITA (http://genie.weizmann.ac.il /pubs/ mir07/mir07_dyn_data.html). The binding cits between miRNA and targets were analyzed using TargetScan database (https://www.targetscan.org/vert_72/). Interactional proteins of targets were predicated using String database v 11.5 (https://cn.string-db.org/). Gene ontology (GO) and kyoto encyclopedia of genes and genomes (KEGG) enrichment analysis of targeted mRNA and corresponding interactional genes were implemented by DAVID with a corrected p-value cutoff of 0.05 to evaluate statistically significant enrichment. The results were visualized using R 3.6.6 software (https://www.R-project.org).
Cell culture and treatment
The RPMI 8226 and U266 cell lines were purchased from the American Type Culture Collection. All the cells were cultured in RPMI-1640 medium (Hyclone) supplemented with 10% fetal bovine serum (Invitrogen) at 37°C and 5% CO2. 5 × 10⁵ cells were suspended in 1.5 mL of RPMI-1640 and placed into each well of a 6-well plate. The cells were then transfected with miR-100-5p inhibitor (miR-inhibitor, sequence: 5′-CACAAGUUCGGAUCUACGGGUU-3′) in combination with/without MTMR3 siRNA (siMTMR3, sequence: 5′-CAGUGGUUGUCUAGUUUAAGG3′ (sense), 5′-UUAAACUAGACAACCACUGAA-3′ (antisense)), or their corresponding negative control (NC) using Lipofectamine® 2000 (Invitrogen). After 24 h of transfection, the cells were harvested, and qPCR was performed to ensure silencing was achieved.
Quantitative polymerase chain reaction assay
QPCR was performed to evaluate the expression of miR-100-5p in MM patients and MM cells and its targets in MM cells. Total RNA was extracted from bone marrow plasma cells or MM cells using Trizol (Invitrogen, #15596026) and reverse-transcribed into complementary DNA (cDNA) using RevertAid Reverse Transcriptase (Thermo scientific, # EP0442). QPCR was performed using the THUNDERBIRD® qPCR Mix agent (TOYOBO, # QPS-201) with the corresponding primer sequences under the experimental conditions of initial denaturation for 1 min at 95°C, 40 cycles of denaturation at 95°C for 15 s, annealing at 58°C for 20 s, and extension at 72°C for 20 s, 65°C for 5 s, and final extension at 72°C for 5 min. The primer sequences are as follows: miR-100-5p, forward, 5′- ACACTCCAGCTGGGAACCCGTAGATCCGAA-3′, reverse, 5′- TGGTGTCGTGGAGTCG-3′; CLDN11, forward, 5′- GACCACCTCCACCAATGACT-3′, reverse, 5′-AGGATGAGGATGTCCACCAG-3′; ICMT, forward, 5′- TCCCAAAAGTCTGTCCTTGG-3′, reverse, 5′- CGCCTTCCTCAGACATTCTC-3′; MTMR3, forward, 5′- GGGCTCAGTGTTCTCCTCAG-3′, reverse, 5′- ACTGTCCACGTTTGGTCCTC-3′; RASGRP3, forward, 5′- GCTCTCCGTTACCCTGAGTG-3′, reverse, 5′- TTCTAGGCTCCAGCACCAGT-3′; SMARCA5, forward, 5′- CGACACCGTAGAACAGAGCA-3′, reverse, 5′- TCCTAGGCCCATTTCATCTG-3′; U6 (internal reference of miRNA), forward, 5′- CTCGCTTCGGCAGCACA-3′, 5′- AACGCTTCACGAATTTGCGT-3′; GAPDH (internal reference of mRNA), forward, 5′-TCAAGAAGGTGGTGAAGCAGG-3′, reverse, 5′- TCAAAGGTGGAGGAGTGGGT-3′. Data analysis was performed using the 2-ΔΔCt method.
Cell counting kit-8 assay
Cell counting kit-8 (CCK-8) assay was conducted to detect the living number of RPMI 8226 and U266 MM cells. 3 × 10⁵ harvested RPMI 8226 and U266 cells were seeded in 96-well plates (100 μL of medium per well), and maintained at 37°C with 5% CO2 for 24, 48, and 72 h. Thereafter, the cells were cultured for 4 h with 10 μL of CCK-8 solution (Solarbio, Beijing, China) and the optical density was measured at 450 nm using an AMR-100 apparatus (Allsheng).
Flow cytometry
The apoptosis rate of MM cells was examined using flow cytometry. The Annexin V-fluorescein isothiocyanate (FITC)/propidium iodide (PI) apoptosis assay kit (BD Biosciences, #556547) was utilized. 1 × 10⁶ cells were centrifuged at 400× g, 4 °C for 5 min, followed by being resuspended in 200′μL of phosphate-buffered saline (PBS). Thereafter, the cells were cultured with 200 µL of binding buffer, stained for 30 min with 10 μL of Annexin V-FITC and 10 μl of PI in the dark. Then, 300 µL of binding buffer was added and the cells were subjected to flow cytometry using a Novocyte apparatus (ACEA Biosciences, Inc., U.S.A.).
Western blot
Total protein was extracted from RPMI 8226 and U266 cells after 24 h of transfection using radioimmunoprecipitation assay lysis buffer (Solarbio) and quantified using a bicinchoninic acid kit (Solarbio). Protein (20 μg) was separated by odiumdodecyl sulfate-polyacrylamide gel electrophoresis and transferred onto polyvinylidene fluoride membranes (Millipore, Burlington, MA, U.S.A.), followed by blocking with 5% skim mike for 2 h. Thereafter, the blocked membranes were incubated for 1 h with rabbit primary antibodies against MTMR3 (ABclonal, Wuhan, China), caspase 3 (Cell Signaling Technology, Boston, U.S.A.), cleaved caspase 3 (Cell Signaling Technology), Bcl-2 (ABclonal), Bax (ABclonal), N-cadherin (ABclonal), Vimentin (ABclonal), E-cadherin (ABclonal), CLDN11 (ABclonal), ICMT (ABclonal), RASGRP3 (ABclonal), SMARCA5, and GAPDH (ABclonal). After the membranes were washed three times with PBS/Tween (PBST) 20 for 5 min each, they were incubated with goat anti-rabbit IgG (Abcam, Cambridge, MA, U.S.A.) secondary antibody for 1 h, then washed again with PBST for 5 min each. Thereafter, the membranes were incubated in an enhanced chemiluminescence reagent. A Tanon-5200 automatic analyzer (Tanon, Shanghai, China) was used to visualize protein bands and band gray values were obtained using Tanon software. GAPDH served as an endogenous control.
Statistical analysis
GraphPad Prism 7 software (San Diego, CA, U.S.A.) was applied for data analysis. Mean values with standard deviation, median values with range, and count (percentage) were calculated to characterize the variables. MiRNA levels in MM patients and control individuals were compared using the Mann–Whitney U-test for non-parametric analysis. Receiver operating characteristic (ROC) curve was performed for miRNA to examine its clinical utility. As for in vitro study, all experiments were performed in triplicates (n = 3) and the data are presented as the mean ± standard deviation (SD). Comparisons between two groups were performed using the one-sample t-test and more than two groups were performed using the one-way analysis of variance (ANOVA) followed by Tukey’s post-hoc test. Statistical significance was defined as p-value < 0.05.
Results
MiR-100-5p is identified as a biomarker of MM
A total of 10 RNA-seq libraries were contrasted using bone marrow plasma cell samples of 5 MM patients and 5 control individuals. The raw reads and bases, valid reads and bases, Q20, Q30, and GC percentage were collected from each library, the corresponding details were shown in , showing that Q20 > 98%, Q30 > 94%, and GC content ranged from 45% to 49%. These indicated the high quality of the RNA-seq data and guaranteed the reliability of follow-up analysis. MiRNA-seq data analysis showed that there were 44 significantly differentially expressed miRNAs between MM patients and control individuals, of which 12 miRNAs were downregulated and 32 miRNAs were upregulated in MM patients, especially miR-100-5p (A–C). The detailed information of all the expressed miRNAs were shown in Supplementary 1. Thus, we speculated that miR-100-5p may be involved in the pathogenesis of MM. Furthermore, validation experiment revealed that miR-100-5p were significantly highly expressed in bone marrow of MM patients compared to those of control individuals (p < 0.001) (D), which was consistent with the RNA-seq analysis. Moreover, the clinical utility of miR-100-5p was evaluated using ROC curve analysis. The results showed that the area under the curve of miR-100-5p reached 0.983 (95% confidence interval, 0.9484–1.018; p < 0.0001) (E), thereby indicating that miR-100-5p may represent valuable biomarker of MM.
Figure 1. MiRNA-seq data analysis and miR-100-5p expression verification. (A) A volcano plot was applied to visualize expression profiling between MM and control groups. The vertical black dotted lines correspond to a 2.0-fold (log2 scaled) increase and decrease, respectively. The horizontal black dotted refers to a p-value of 0.05 (-log10 scaled). Each red point represents a differentially expressed miRNA with statistical significance. (B) Number of upregulated and downregulated differentially expressed miRNAs in MM patients compared to control individual. (C) Hierarchical clustering indicates differences in miRNA expression profiling between the MM and control groups. (D) Validation experiment of miR-100-5p expression in MM patients. (E) Receiver operating characteristic curves of miR-100-5p. (F) MiR-100-5p targets predicated by miRanda, miRWalk, and PITA databases.
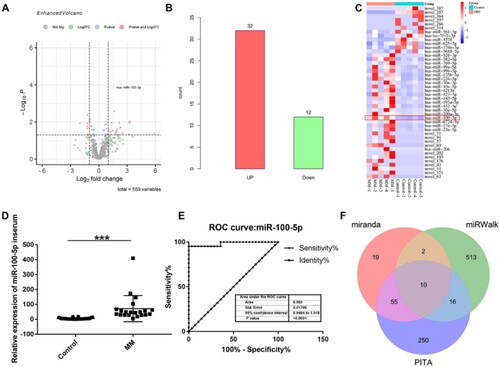
Table 2. Sample details from RNA-seq.
Targets predication of miR-100-5p in MM
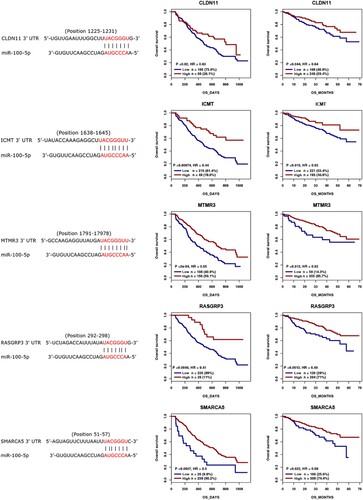
Then, we predicated the targets of miR-100-5p using miRanda, miRWalk, and PITA databases, showing that 10 targets can be found in all of these three databases including ICMT, RAP1B, RCBTB1, RASGRP3, MTMR3, CLDN11, PPP3CA, SMARCA5, RNF144B, and AGO2 (F and Supplementary 2). The prognostic role of these targets in MM was analyzed using previous cohorts (GSE9782 and GSE4581) [Citation15], demonstrating that CLDN11, ICMT, MTMR3, RASGRP3, and SMARCA5 low expression are associated with poor prognosis of MM patients (), whereas RAP1B, RCBTB1, PPP3CA, and AGO2 high expression are associated with poor prognosis of MM patients, and no statistic difference was observed between RNF144B expression and prognosis of MM patients (Figure S1). Moreover, TargetScan database suggested the presence of a binding site between miR-100-5p and the targets (). These results indicate that miR-100-5p might be involved in the pathogenesis of MM by targeting CLDN11, ICMT, MTMR3, RASGRP3, and SMARCA5.
Figure 2. Binding cites predication between miR-100-5p and CLDN11, ICMT, MTMR3, RASGRP3, and SMARCA5 using TargetScan database, and the prognostic role of CLDN11, ICMT, MTMR3, RASGRP3, and SMARCA5 in MM was analyzed using previous cohorts.
Functional enrichment analysis
To further investigate the cellular pathways associated with these five targets, we first predicated the main interactional proteins of them, the results were shown in A. GO and KEGG enrichment were then performed to analyse the function and pathway enrichment of these main interactional proteins. All the enriched GO terms including molecular function (MF), biological process (BP), and cellular component (CC) categories, and KEGG pathways were displayed in Supplementary 3 and Supplementary 4, respectively. The top 10 GO terms of MF, BP, and CC were shown in B, demonstrating that the interactional proteins were mainly enriched in protein binding term, plasma membrane term, and cytosol term. The top 20 KEGG enrichment pathways were shown in C, and the top 10 KEGG enrichment pathways including enriched genes were shown in , containing inositol phosphate metabolism and phosphatidylinositol signaling system pathway.
Figure 3. Function analysis of main interactional proteins of CLDN11, ICMT, MTMR3, RASGRP3, and SMARCA5. (A) Mian interactional proteins of CLDN11, ICMT, MTMR3, RASGRP3, and SMARCA5. (B) The top 10 GO terms of MF, BP and CC categories. (C) The top 20 KEGG enrichment pathways. MF, molecular function, BP, biological process, CC, cellular component.
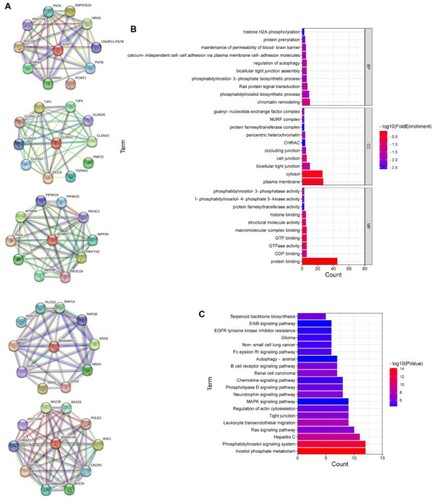
Table 3. Top 10 KEGG pathways.
MTMR3 inhibition impedes the effect of miR-100-5p suppression in living number, apoptosis, and metastasis of MM cells
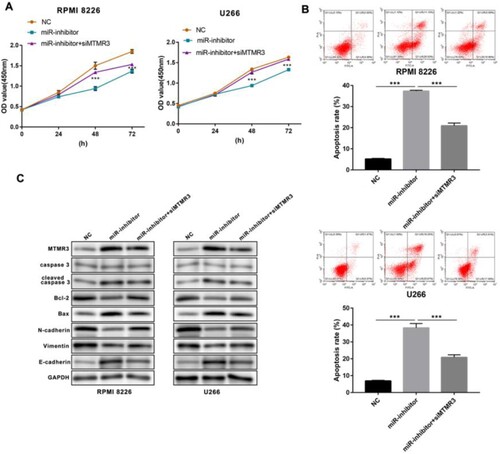
In addition, we inhibited the expression of miR-100-5p in both RPMI 8226 and U266 MM cells (A). CCK-8 assay showed that miR-100-5p suppression declined the living number of MM cells (B), and flow cytometry assay indicated that miR-100-5p inhibition enhanced apoptosis (C). Western blot assay showed that the downregulation of miR-100-5p promoted the expression of Bax and E-cadherin proteins, and the cleave of caspase 3, while reducing the expression of Bcl-2, N-cadherin, and Vimentin proteins (D). Furthermore, qPCR and western blot were performed to evaluate the expression of predicated five targets based on miR-100-5p inhibition, showing the expressive promotion of all five targets, especially MTMR3 (). Thus, we selected MTMR3 for the subsequent study. The results showed that MTMR3 inhibition weakened the regulatory effect of miR-100-5p inhibition on living number (A), apoptosis and metastasis (B,C) in MM cells.
Figure 4. Function of miR-100-5p in MM cells. (A) qPCR was performed to detect the expression of miR-100-5p in MM cells after 24 h of transfection. (B) CCK-8 was performed to detect the living number of MM cells after 24, 48, and 72 h of transfection. (C) Flow cytometry was performed to detect apoptosis of MM cells after 24 h of transfection. (D) Western blot was performed to detect the expression of apoptosis- and metastasis-associated proteins in MM cells after 24 h of transfection. All Experiments were performed three times. ***p < 0.001.
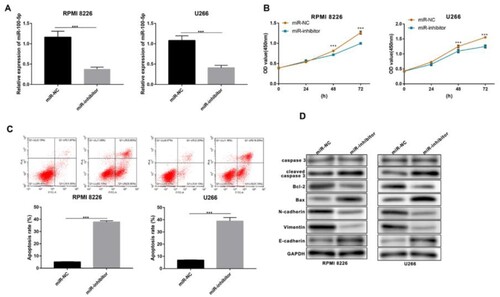
Figure 5. The targets of miR-100-5p expression in MM cells after transfection. (A) qPCR and western blot were performed to detect the expression of CLDN11, ICMT, MTMR3, RASGRP3, and SMARCA5 in MM cells after 24 h of transfection. All Experiments were performed three times. ***p < 0.001 vs. miR-NC group.
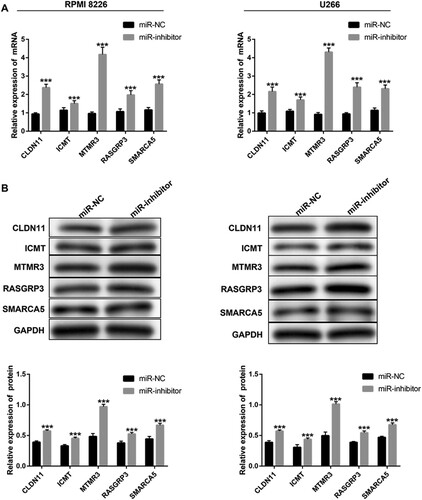
Figure 6. Function of MTMR3 in miR-100-5p inhibited MM cells. (A) CCK-8 was performed to detect the living number of MM cells after 24, 48, and 72 h of transfection. (B) Flow cytometry was performed to detect apoptosis of MM cells after 24 h of transfection. (C) Western blot was performed to detect the expression of apoptosis- and metastasis-associated proteins in MM cells after 24 h of transfection. All Experiments were performed three times. ***p < 0.001.
Discussion
Numerous studies have reported the effect of miR-100-5p in malignant tumor. For instance, Jakob et al. have found that the high expression of miR-100-5p is implicated with poor prognosis of oral squamous cell carcinoma [Citation16]; Chen et al. have shown the overexpression of miR-100-5p in renal cell carcinoma and identified it as a diagnostic biomarker [Citation17]; Liu et al. have demonstrated an elevation of miR-100-5p in ovarian cancer, and it is associated with the progression of ovarian cancer by targeting ependymin-related protein 1 [Citation18]. However, the function of miR-100-5p in MM was barely elucidated. In this work, differential expression analysis using high-throughput sequencing showed that compared to Control group, 32 miRNAs were overexpressed in MM group, especially miR-100-5p. miR-100-5p upregulation in MM patients were then verified in 21 samples using qPCR. ROC curve analysis indicated miR-100-5p as a diagnostic biomarker of MM.
Although as highly conserved single-stranded small endogenous non-coding RNAs, miRNAs are very important genetic regulators, as evidenced by the fact that a single miRNA can direct entire cellular signaling pathways by targeting a broad spectrum of genes [Citation19]. In this study, to explore the potential biological regulatory effect of miR-100-5p in MM, we predicated the targets of miR-100-5p using miRanda, miRWalk, and PITA databases, showing that 10 target genes can be found in all of these three databases (intersection), and among them, CLDN11, ICMT, MTMR3, RASGRP3, and SMARCA5 low expression are associated with poor prognosis of MM patients. As previously reported, CLDN11 is a member of Claudin family, silenced in malignant melanoma, gastric cancer, bladder cancer, and oral leukoplakias, thereby leading to tumors progression [Citation20]. ICMT is an enzyme involved in the progress of post-translational modification, and its genetic ablation inhibited tumor formation of breast cancer cell lines with Ras mutation in a xenograft model [Citation21]. However, inactivation of ICMT enhanced the number of KRAS-driven intraepithelial neoplasias and promoted pancreatic ductal adenocarcinoma progression [Citation22]. MTMR3 was found to be overexpressed in breast cancer patients, and MTMR3 inhibition suppressed proliferation and autophagy of breast cancer cells [Citation23]. In contrast, Yan et al. suggested that MTMR3 was downregulated in glioma tumorigenesis, thereby promoting glioma cell proliferation and migration [Citation24]. As an activator of Ras, RASGRP3 overexpression was observed in both papillary thyroid cancer and breast cancer, and it may be a potential therapeutic target for these two cancers [Citation25]. As for SMARCA5, several studies have demonstrated its high expression in gastric cancer, acute leukemia, and non-small cell lung cancer, and SMARCA5 suppression targeted by miR-100 inhibited the progression of non-small cell lung cancer and glioblastoma [Citation26–29]. Collectively, all five targets show regulatory effects on multiple tumors. The distinguished function of one target on different tumors may be contributed to tumor heterogeneity and different molecular regulatory mechanisms.
Furthermore, protein network interaction analysis was performed to find out the major interacting proteins of these five targets and KEGG pathway analysis was performed to predicate the main cellular pathways these genes enriched. The results showed that the corresponding genes were obviously enriched in multiple pathways, especially inositol phosphate metabolism and phosphatidylinositol signaling system. Inositol phosphates are signaling molecules observed in all eukaryotes [Citation30], and its metabolism involves several biological processes including but not limited to necroptosis [Citation31], intracellular calcium signaling [Citation32], and transcription [Citation33]. Wei et al. have found that inositol phosphate metabolism is one of the most impaction metabolic pathways in early breast cancer [Citation34], and Zhu et al. have suggested inositol phosphate metabolism as one of the most influential pathways contributing to colorectal cancer [Citation35]. However, the influence of inositol phosphate metabolism in MM needs to be elucidated. Whereas, phosphatidylinositol signaling system, such as phosphatidylinositol 3-kinase signaling pathway, were extensively reported to be associated with the pathogenesis of MM [Citation36,Citation37].
Moreover, we inhibited the expression of miR-100-5p in both RPMI 8226 and U266 MM cell lines, resulting in living number decline and apoptosis promotion of cells. In addition, miR-100-5p suppression impeded the metastasis of MM cells as demonstrated by the downregulation of N-cadherin and Vimentin and upregulation of E-cadherin. However, MTMR3 inhibition weakened the function of miR-100-5p inhibition in MM cells. Interestingly, we found that MTMR3 was enriched in both inositol phosphate metabolism and phosphatidylinositol signaling system pathway. Accumulating studies have revealed the biological functions of MTMR3, such as proliferation, apoptosis, and metastasis regulation. As reported by Yan, as a direct target of miR-10a, MTMR3 was notably downregulated in glioma and knockdown of endogenous MTMR3 improved proliferation and impeded apoptosis of glioma cells [Citation24]. Wang et al. have demonstrated that, in breast cancer cells, miR-1910-3p reduced MTMR3 expression, thereby promoting cell migration by upregulating N-cadherin and Vimentin and downregulating E-cadherin [Citation38].
There are some limitations of our present study. First, we used iron-deficiency anemia patients as control group due to the difficulty in obtaining bone marrow specimens from healthy individual and the expression of miR-100-5p in iron-deficiency anemia patients is unclear. Second, the clinical significance of miR-100-5p was not explored due to the short follow-up period. In addition, the biological function of miR-100-5p in MM was only investigated in vitro. The follow-up study will be designed to investigate the clinical significance of miR-100-5p in MM and verify the underlying mechanisms we currently investigated in vivo.
In conclusion, the findings of this study demonstrate that miR-100-5p is a promising biomarker for MM, and that it may involve in the pathogenesis of MM through regulating inositol phosphate metabolism and phosphatidylinositol signaling system pathway by targeting MTMR3.
Supplemental Material
Download Zip (136.1 KB)Disclosure statement
No potential conflict of interest was reported by the author(s).
Additional information
Funding
References
- Kazandjian D. Multiple myeloma epidemiology and survival: a unique malignancy. Semin Oncol. 2016;43(6):676–681.
- van de Donk N, Pawlyn C, Yong KL. Multiple myeloma. Lancet. 2021;397(10272):410–427.
- Minnie SA, Hill GR. Immunotherapy of multiple myeloma. J Clin Invest. 2020;130(4):1565–1575.
- Yang Y, Li Y, Gu H, et al. Emerging agents and regimens for multiple myeloma. J Hematol Oncol. 2020;13(1):150.
- Hammond SM. An overview of microRNAs. Adv Drug Deliv Rev. 2015;29(87):3–14.
- Vishnoi A, Rani S. MiRNA biogenesis and regulation of diseases: An overview. Methods Mol Biol. 2017;1509:1–10.
- Ardizzone A, Calabrese G, Campolo M, et al. Role of miRNA-19a in cancer diagnosis and poor prognosis. Int J Mol Sci. 2021;22(9):4697.
- Sabit H, Cevik E, Tombuloglu H, et al. Triple negative breast cancer in the era of miRNA. Crit Rev Oncol Hematol. 2021;157:103196.
- Xu K, Zhang C, Du T, et al. Progress of exosomes in the diagnosis and treatment of lung cancer. Biomed Pharmacother. 2021;134:111111.
- Chen D, Yang X, Liu M, et al. Roles of miRNA dysregulation in the pathogenesis of multiple myeloma. Cancer Gene Ther. 2021;28(12):1256–1268.
- Caracciolo D, Montesano M, Altomare E, et al. The potential role of miRNAs in multiple myeloma therapy. Expert Rev Hematol. 2018;11(10):793–803.
- Papadimitriou MA, Papanota AM, Adamopoulos PG, et al. miRNA-seq and clinical evaluation in multiple myeloma: miR-181a overexpression predicts short-term disease progression and poor post-treatment outcome. Br J Cancer. 2022;126(1):79–90.
- Rajkumar SV, Dimopoulos MA, Palumbo A, et al. International Myeloma Working Group updated criteria for the diagnosis of multiple myeloma. Lancet Oncol. 2014;15(12):e538–e548.
- Chomczynski P, Sacchi N. Single-step method of RNA isolation by acid guanidinium thiocyanate-phenol-chloroform extraction. Anal Biochem. 1987;162(1):156–159.
- Mulligan G, Mitsiades C, Bryant B, et al. Gene expression profiling and correlation with outcome in clinical trials of the proteasome inhibitor bortezomib. Blood. 2007;109(8):3177–3188.
- Jakob M, Mattes LM, Kuffer S, et al. MicroRNA expression patterns in oral squamous cell carcinoma: hsa-mir-99b-3p and hsa-mir-100-5p as novel prognostic markers for oral cancer. Head Neck. 2019;41(10):3499–3515.
- Chen P, Lin C, Quan J, et al. Oncogenic miR-100-5p is associated with cellular viability, migration and apoptosis in renal cell carcinoma. Mol Med Rep. 2017;16(4):5023–5030.
- Liu X, Liu C, Zhang A, et al. Long non-coding RNA SDCBP2-AS1 delays the progression of ovarian cancer via microRNA-100-5p-targeted EPDR1. World J Surg Oncol. 2021;19(1):199.
- Diener C, Keller A, Meese E. Emerging concepts of miRNA therapeutics: from cells to clinic. Trends Genet. 2022;38(6):613–626.
- Li HP, Peng CC, Wu CC, et al. Inactivation of the tight junction gene CLDN11 by aberrant hypermethylation modulates tubulins polymerization and promotes cell migration in nasopharyngeal carcinoma. J Exp Clin Cancer Res. 2018;37(1):102.
- Lau HY, Tang J, Casey PJ, et al. Isoprenylcysteine carboxylmethyltransferase is critical for malignant transformation and tumor maintenance by all RAS isoforms. Oncogene. 2017;36(27):3934–3942.
- Court H, Amoyel M, Hackman M, et al. Isoprenylcysteine carboxylmethyltransferase deficiency exacerbates KRAS-driven pancreatic neoplasia via notch suppression. J Clin Invest. 2013;123(11):4681–4694.
- Wang Z, Zhang M, Shan R, et al. MTMR3 is upregulated in patients with breast cancer and regulates proliferation, cell cycle progression and autophagy in breast cancer cells. Oncol Rep. 2019;42(5):1915–1923.
- Yan Y, Yan H, Wang Q, et al. MicroRNA 10a induces glioma tumorigenesis by targeting myotubularin-related protein 3 and regulating the Wnt/beta-catenin signaling pathway. FEBS J. 2019;286(13):2577–2592.
- Qiu W, Xia X, Qiu Z, et al. RasGRP3 controls cell proliferation and migration in papillary thyroid cancer by regulating the Akt-MDM2 pathway. Gene. 2017;633:35–41.
- Stopka T, Zakova D, Fuchs O, et al. Chromatin remodeling gene SMARCA5 is dysregulated in primitive hematopoietic cells of acute leukemia. Leukemia. 2000;14(7):1247–1252.
- Gigek CO, Lisboa LC, Leal MF, et al. SMARCA5 methylation and expression in gastric cancer. Cancer Invest. 2011;29(2):162–166.
- Alrfaei BM, Clark P, Vemuganti R, et al. MicroRNA miR-100 decreases glioblastoma growth by targeting SMARCA5 and ErbB3 in tumor-initiating cells. Technol Cancer Res Treat. 2020;19:1533033820960748.
- He Y, Sun MM, Zhang GG, et al. Targeting PI3K/Akt signal transduction for cancer therapy. Signal Transduct Target Ther. 2021;6(1):425.
- Hatch AJ, York JD. Snapshot: inositol phosphates. Cell. 2010;143(6):1030–1030. e1.
- Dovey CM, Diep J, Clarke BP, et al. MLKL requires the inositol phosphate code to execute necroptosis. Mol Cell. 2018;70(5):936–948. e7.
- Manna A, Zhao H, Wada J, et al. Cooperative assembly of a four-molecule signaling complex formed upon T cell antigen receptor activation. Proc Natl Acad Sci U S A. 2018;115(51):E11914–E11923.
- Watson PJ, Millard CJ, Riley AM, et al. Insights into the activation mechanism of class I HDAC complexes by inositol phosphates. Nat Commun. 2016;7:11262.
- Wei Y, Jasbi P, Shi X, et al. Early breast cancer detection using untargeted and targeted metabolomics. J Proteome Res. 2021;20(6):3124–3133.
- Zhu G, Wang Y, Wang W, et al. Untargeted GC-MS-based metabolomics for early detection of colorectal cancer. Front Oncol. 2021;11:729512.
- Han K, Xu X, Chen G, et al. Identification of a promising PI3K inhibitor for the treatment of multiple myeloma through the structural optimization. J Hematol Oncol. 2014;7:9.
- Younes A, Berdeja JG, Patel MR, et al. Safety, tolerability, and preliminary activity of CUDC-907, a first-in-class, oral, dual inhibitor of HDAC and PI3K, in patients with relapsed or refractory lymphoma or multiple myeloma: an open-label, dose-escalation, phase 1 trial. Lancet Oncol. 2016;17(5):622–631.
- Wang B, Mao JH, Wang BY, et al. Exosomal miR-1910-3p promotes proliferation, metastasis, and autophagy of breast cancer cells by targeting MTMR3 and activating the NF-kappaB signaling pathway. Cancer Lett. 2020;489:87–99.