
ABSTRACT
Objective:
To explore the prognostic value of the Mayo Additive Staging System (MASS) in real-world patients with newly diagnosed multiple myeloma(MM).
Methods:
The clinical data of 307 patients with newly diagnosed MM from August 2015 to June 2022 were retrospectively analyzed. Survival analysis was conducted for each subgroup according to the MASS. The MASS was compared to the original staging systems to evaluate its prognostic value. Patients in the high-risk group were further stratified.
Results:
Patients were divided into MASS stages I (93 cases), II (91 cases), and III (123 cases), with differences in overall survival (OS) and progression-free survival (PFS) among all groups (p < 0.0001). Patients were grouped according to treatment regimen, age, transplant status, renal function, and bone destruction; with differences in OS and PFS among patients at each MASS stage in all subgroups (P ≤ 0.05). The MASS was also used for further risk stratification of patients with Mayo Myeloma Stratification and Risk-adjusted Treatment Stratification System 3.0 (mSMART3.0) and Revised International Staging System (R-ISS). Furthermore, in the MASS high-risk group, patients with scores of 2 and 3 vs 4 had OS of 23.7 and 10.1 months (P = 0.004), and PFS of 17.6 and 8.2 months (P = 0.004), respectively. Patients in the high-risk complex karyotype group not covered by SMART staging criteria had shorter OS and PFS than those in the mSMART3.0 high-risk and MASS stage III groups.
Conclusion:
The prognostic value of the MASS in patients with MM has been verified, and has better evaluation efficiency than the SMART and R-ISS systems.
Introduction
With continuous progress in new immunotargeted drug therapies, the prognosis of multiple myeloma (MM) has improved greatly; however, there is still no cure due to its heterogeneity[Citation1]. Currently, the Revised International Staging System (R-ISS) and the Mayo Myeloma Stratification and Risk Adjusted Therapy Stratification System 3.0 (mSMART3.0) are widely used in clinical practice[Citation2, Citation3]. However, these two prognostic models have limitations. Therefore, the Mayo Additive Staging System(MASS), which is believed to reflect the compound effect of high-risk disease characteristics better, has recently been proposed internationally[Citation4]. Through a retrospective analysis of the same group of newly diagnosed MM patients, this study discusses the prognostic evaluation value of this model in the real world for newly diagnosed MM patients and further optimizes the application process.
Materials and methods
Patients
A total of 382 patients with newly diagnosed MM from Wuxi People's Hospital and the First Affiliated Hospital of Soochow University between August 2015 and June 2022 were included in this study. After excluding patients with an incomplete FISH test, no β2-microglobulin (β2-MG) data, or no treatment, 307 newly diagnosed MM patients were retrospectively analyzed. All patients in this group received peripheral blood, bone marrow cytology, and FISH tests. The diagnostic criteria and clinical staging were strictly based on the International Myeloma Working Group (IMWG) and the International Staging System (ISS)[Citation5]. The patients in this group were treated with bortezomib (PI) + immunomodulatory drugs (IMiDs), PI + conventional chemotherapy, or IMiDs + conventional chemotherapy. The PI + conventional chemotherapy group included the largest number of patients, all of whom were treated with a PAD regimen (bortezomib + adriamycin + dexamethasone). Therefore, subgroup analysis was performed in this group of patients in order to exclude bias according to the treatment regimen. Age, sex, serum albumin (ALB), β2-MG, ISS stage, lactate dehydrogenase (LDH) level, serum creatinine level, chromosomal karyotype and FISH results were evaluated. Overall survival (OS) and progression-free survival (PFS) were calculated. In addition, 34 of the 382 patients included in the study had complex karyotypes other than high-risk IgH transmutation, 1q amplification, and del (17p), and did not belong to the high-risk group defined by the mSMART3.0, R-ISS, or MASS. Survival analysis was also performed. Written informed consent was obtained from all patients.
Staging standard
ISS Stage I: β2-MG <3.5 mg/L, ALB ≥35 g/L; stage II: non-I, non-III; Stage III: β2-MG ≥5.5 mg/L.
R-ISS Stage I: ISS I, critical cytogenetic markers, and normal LDH; stage II: patients who did not conform to stage I and stage III; Stage III: ISS III patients with high cytogenetic risk or elevated LDH.
mSMART3.0 High-risk group: merged t(4;14), t(14;16), t(14;20), 1q21 amplification, 17p deletion/mutation, R-ISS stage III, increased S stage plasma cell index, and high-risk gene expression profile. Standard-risk group: merged t(11,14), t(6,14) or without other cytogenetic abnormalities. ‘Double and triple’ is defined as having any two or three of the high-risk genetic abnormalities.
MASS Patients with high-risk IgH translocation, 1q gain/amplification, chromosome 17 abnormality, ISS III, and elevated LDH all scored 1 point, among which high-risk IgH translocations included t(4;14), t(14;16), and t(14;20). Patients were divided into stages I (0 points), II (1 point) and III (2 + points).
Follow-up visit
Follow-up mainly included consulting outpatient and inpatient medical records and telephone follow-up. Follow-up will be performed until November 30, 2022.
Statistical analysis
SPSS26.0 software was used for statistical analysis. The Kaplan-Meier method was used to produce survival curves, the log-rank test was used to test survival differences, and the chi-square test was used for comparison of general data between groups. P ≤ 0.05 was considered statistically significant. Spearman's correlation was used to evaluate the correlation between different prognostic models, and the consistency index (C-index) and Akaike information criterion (AIC) were used to evaluate the prognostic efficacy of the different models. A C-index value of 1.0 indicated optimal prognostic efficacy, while a value of 0.5 indicated no prognostic efficacy. The AIC was used to describe the accuracy of the prognostic model, and a low AIC value indicated high accuracy.
Results
Baseline patient characteristics
The baseline clinical data of the 307 patients with newly diagnosed MM are shown in , and the clinical characteristics of patients with different MASS stages are shown in .
Table 1. Clinical characteristics of 307 newly diagnosed MM patients.
Table 2. Clinical characteristics of 307 newly diagnosed MM patients in different MASS staging.
Survival analysis based on R-ISS and mSMART3.0
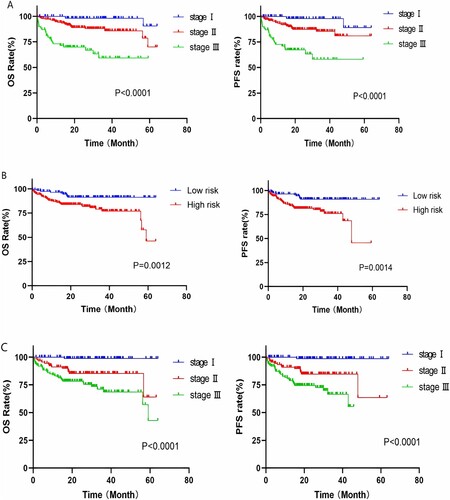
According to the R-ISS, 307 patients with newly diagnosed MM were classified as having stage I (64 cases), stage II (174 cases), or stage III (69 cases) disease. The median OS of patients in the three groups was 62.5, 56.2 and 39.7 months, respectively, and survival analysis among the groups indicated significant differences in OS and PFS (p < 0.0001) (shown in A). Similarly, risk stratification was performed according to mSMART3.0, and patients were divided into standard-risk (117 cases) and high-risk (190 cases) groups. The median OS of the two groups was 59.4 and 50.4 months, respectively, and the inter-group OS and PFS showed significant differences (p = 0.001) (shown in B).
Figure 1. A: Survival curve of MM patients with stage I, II and III based on R-ISS; B: Survival curve of MM patients in mSMART3.0 low and high risk groups; C: Survival curve of MM patients in MASS stage I, II and III.
Survival analysis based on MASS
In this study, 307 newly diagnosed patients with MM were divided into stages I (93 cases), II (91 cases), and III (123 cases) using the MASS prognostic model. Survival analysis of the three groups showed that the median OS was 63.4, 54.0 and 46.7 months, respectively, and there were statistically significant differences in OS and PFS among all groups (p < 0.0001) (shown in C).
Subgroup analysis
Subgroup analysis by therapeutic regimen
In this study, survival analysis was performed for patients receiving different treatment regimens based on MASS staging. Among patients in the PI + IMiDs group, there were statistically significant differences in OS between MASS stages I (15 cases), II (32 cases), and III (29 cases) (OS: 20.2 vs 18.4 vs 17.6 months, p = 0.05; PFS: 18.9 vs 18.2 vs 17 months, p = 0.04). Similarly, there were significant differences in inter-group OS and PFS between patients in the PI + conventional chemotherapy group and those in the IMiDs + conventional chemotherapy group (PI + conventional chemotherapy group: OS: MASS stage I: 34.6 months, stage II: 32.0 months, stage III: 26.0 months, p < 0.0001; PFS: 32.0 vs 28.3 vs 16.9 months, p < 0.0001; IMiDs + conventional chemotherapy group: OS: MASS stage I: 35.6 months, stage II: 17.0 months, stage III: 4.0 months, p = 0.0049, PFS: 33.2 vs 17.2 vs 3.2 months, p = 0.004) (shown in ).
Figure 2. A: Survival curve of patients in PI + IMiDs group with different MASS risk stratification; B: Survival curve of patients in PI + conventional chemotherapy group with different MASS risk stratification; C: Survival curve of patients in IMiDs + conventional chemotherapy group with different MASS risk stratification.
Subgroup analysis of patients in PI + traditional chemotherapy group
Subgroup analysis by age
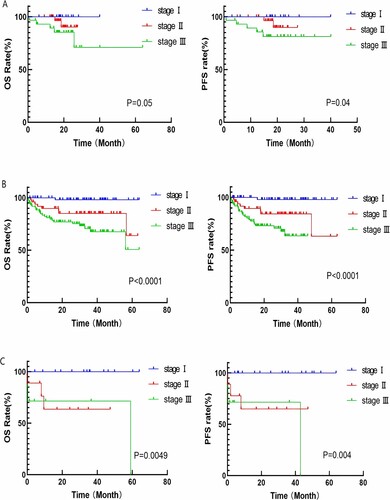
In the PAD group, patients were divided into elderly (≥65 years old) and young group (< 65 years old) groups. Survival analysis was performed by further risk stratification of the two groups according to the MASS. The results showed statistically significant differences in OS and PFS among the 52 patients in the senior age group and 145 patients in the younger age group. (senior age group: OS: MASS stage I: 26.9 months, stage II: 24.0 months, stageIII: 18.7 months, p = 0.039; PFS: 20.7 vs 24 vs 18.7 months, p = 0.04; younger age group: OS: MASS stage I: 36.9 months, stage II: 35.9 months, stage III: 29.6 months, p < 0.0001; PFS: 33.8 vs 30.0 vs 16.2 months, p < 0.0001) (shown in A,B).
Figure 3. A: Survival curve of patients in senior age group with different MASS risk stratification; B: Survival curve of patients in younger age group with different MASS risk stratification; C: Survival curve of patients in transplant group with different MASS risk stratification; D: Survival curve of patients in non-transplant group with different MASS risk stratification.
Subgroup analysis by transplant status
Survival analysis was performed according to MASS for patients in the transplant and non-transplant groups. The results showed statistically significant differences in OS and PFS among all groups, in both the transplant and non-transplant groups. (transplant group: OS: MASS stage I: 39.2 months, stage II: 36.8 months, stage III: 36.1 months, p = 0.05; PFS: MASS stage I: 36.1 months, stage II: 32.4 months, stage III: 27.1 months, p = 0.05; non-transplant group: OS: 30.3 vs 28.0 vs 15.4 months, p = 0.001; PFS: 23.1 vs 18.8 vs 14 months, p = 0.001) (shown in C,D).
Subgroup analysis by renal function
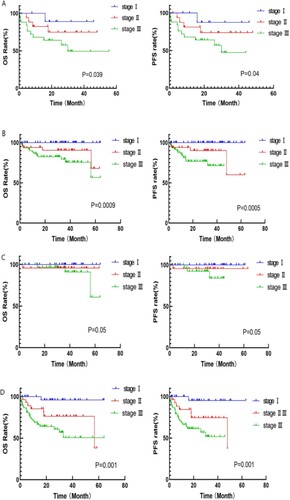
There were 54 patients in the PAD group who exhibited renel impairment. The results of the survival analysis of patients in the normal and impaired renal function groups, indicated that there were statistically significant differences in the inter-group OS and PFS of patients both in the normal and the impaired renal function groups. (normal renal function group: OS: MASS stage I: 35.2 months, stage II: 35 months, stageIII: 18.2 months, OS: p = 0.004; PFS: 35.1 vs 35 vs 14.8 months, P = 0.0023; impaired renal function group: OS: 34.2 vs 33 vs 30.9 months, p = 0.05; PFS: 32 vs 24 vs 19.2 months, p = 0.05)(shown in ).
Figure 4. A: Survival curve of patients in normal renal function group with different MASS risk stratification; B: Survival curve of patients in injured renal function group with different MASS risk stratification.
MASS-stratified prognosis of patients suitable for transplantation, but who do not undergo, transplantation
This study identified that some patients who were suitable for transplantation did not undergo hematopoietic stem cell transplantation for various reasons. Such cases are common in daily life; therefore,a survival analysis was conducted on these patients. According to the MASS, these patients could be divided into stage I (22 cases), stage II (11 cases), and stage III (29 cases), and OS and PFS among all groups showed a statistically significant difference (OS: 31.4 vs 30 vs 13.1 months, p = 0.0074; PFS: 24.7 vs 18 vs 11.1 months, p = 0.0051) (shown in A).
Figure 5. A: Survival curves of patients who are suitable for transplantation but do not undergo transplantation based on MASS risk stratification; B: Survival curve of patients with bone destruction based on MASS.
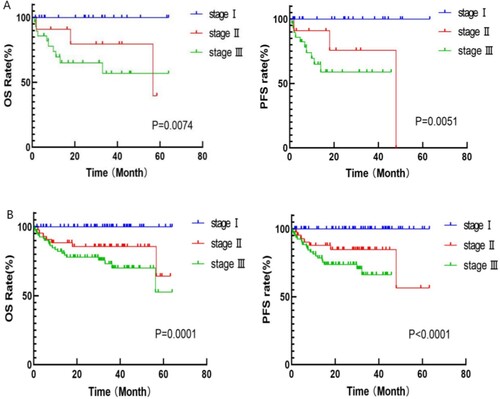
MASS-stratified prognosis of patients with bone destruction
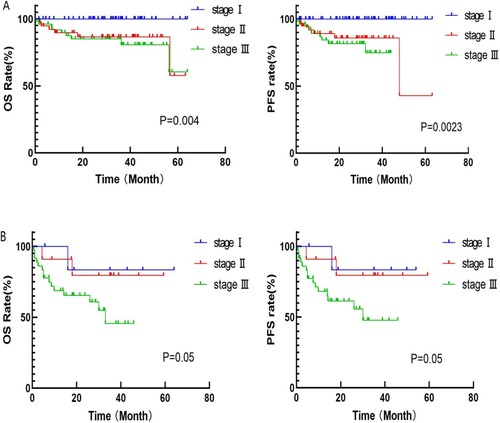
Among patients treated with PAD, 180 showed bone destruction complications. Further risk stratification of these patients revealed 56, 43, and 81 patients in MASS stage I, II and III, respectively, and OS and PFS among all groups showed statistically significant differences (OS: 35,1 vs 32.9 vs 28.5 months, p = 0.0001; PFS: 32.5 vs 28.1 vs 18.4 months, p < 0.0001) (shown in B).
Prognosis of patients with complex chromosome karyotype abnormality
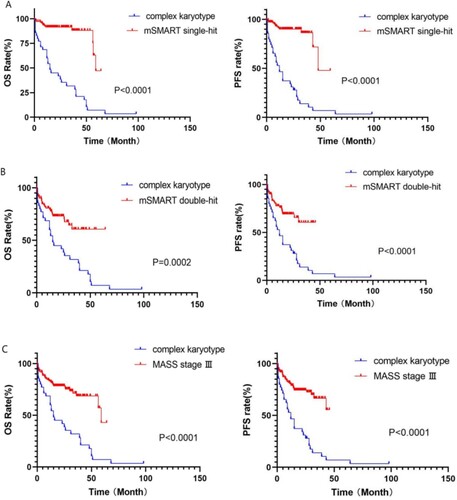
In this study, patients in the complex karyotype group were compared with those in the mSMART3.0 high-risk single-hit, multiple-hit, and MASS stage III groups. The median survival time of the complex karyotype group was 22.4 months, which was significantly lower than that of the other three groups (single-hit: 55.5 months, multiple-hit: 44.1 months, MASS stage III: 46.7 months), and OS and PFS between the complex karyotype group and the other three groups showed a statistically significant difference in prognosis (p < 0.001) (shown in ).
Figure 6. A: Survival curve of MM patients between MM patients with complex karyotype and mSMART single-hit; B: Survival curve of MM patients between MM patients with complex karyotype and mSMART double-hit; C: Survival curve of MM patients between MM patients with complex karyotype and MASSIII.
Further optimization of the MASS
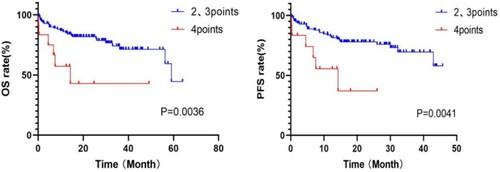
According to the MASS, patients with MASS III scored 2+ (more than two risk factors). Further risk stratification was performed for this group of patients, and the boundary was set at 3 points. Patients with scores of 2 and 3 were divided into a group of 111, and those with scores of 4 and above were divided into a group of 12. OS and PFS showed a statistically significant difference between the two groups (2, 3 points vs 4 + points: OS: 23.7 vs 10.1 months, p = 0.004; PFS: 17.6 vs 8.2 months, p = 0.004) (shown in ).
Figure 7. Survive curves of patients with MASS score 2、3 and 4 points.
Comparison between the MASS and mSMART3.0
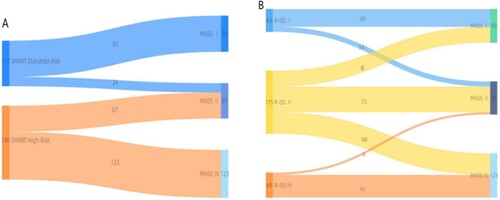
The MASS prognostic model was used to re-stage patients in the mSMART3.0 standard and high-risk groups. Among the 117 patients in the standard-risk group, 93 and 24 were classified as having MASS stages I and II,respectively. The median OS of patients in the two groups was 63.4 and 44.5 months, respectively, and the prognosis of the two groups was significantly different (p < 0.0001) (shown in A). Among the 190 mSMART3.0 high-risk patients, 67 could be classfied as MASS II and 123 patients in MASS III. The median OS of patients in the two groups was 56.8 and 46.7 months, respectively, and the prognosis of the two groups was different (OS: p = 0.0086, PFS: p = 0.0055) (shown in B). The phased migration from the mSMART3.0 to MASS is shown in A. The correlation analysis of the MASS and mSMART3.0 showed a significant correlation, r = 0.831, p < 0.0001.
Figure 8. A: Survival curve of patients in mSMART3.0 standard-risk group with different MASS risk stratification; B: Survival curve of patients in mSMART3.0 high-risk group with different MASS risk stratification; C: Survival curve of patients in R-ISS stsge II group with different MASS risk stratification.
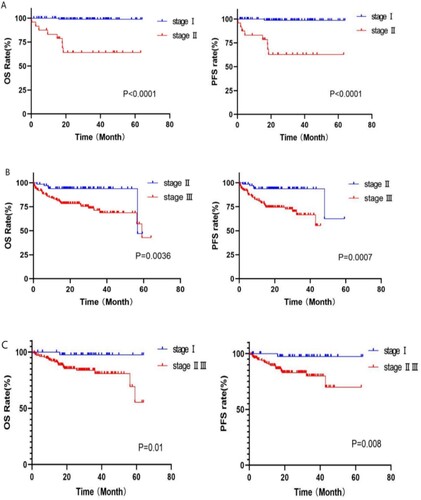
Figure 9. Stage migration between mSMART3.0 and MASS and R-ISS and MASS. The distribution and migration of patients between disease stages using R-ISS, mSMART3.0 and MASS risk stratification systems.
The c-index and AIC were used to further evaluate the prognostic efficacy of the MASS and mSMART3.0. The C-index scores of both groups were as follows: MASS (C-index = 0.706; 95% CI, 0.650-0.762), mSMART3.0 (C-index = 0.601; 95% CI, 0.540-0.663). The AIC indices were 460.49 for the MASS and 481.57 for the mSMART3.0.
Comparison between the MASS and R-ISS
In R-ISS staging, most patients were divided into stage II, therefore R-ISS stage II patients underwent further risk stratification according to the MASS in this study, and survival analysis showed significant differences among groups (MASS I vs MASS II, III: OS: 32.2 vs 22.4 months, p = 0.01; PFS: 30.6 vs 19 months, p = 0.008) (shown in C). The phased migration from the R-ISS to the MASS is shown in B. Correlation analysis revealed a moderate correlation between the two prognostic models (r = 0.666, p < 0.0001).
Discussion
MM is a common malignant tumor of the blood system that cannot be treated. Although the prognosis of MM has greatly improved with the application of proteasome inhibitors, nuclear export protein inhibitors, CD38 mAb, and other drugs, as well as the progress of hematopoietic stem cell transplantation, the prognosis of MM varies greatly among patients owing to its heterogeneity[Citation6, Citation7]. Therefore, accurate prognostic evaluation is very important for the choice of treatment in patients with MM. With the deepening research on the pathogenesis of MM, genetic abnormalities are considered the main factors in risk stratification[Citation8–10]. The R-ISS and mSMART stratification systems are widely used for the prognostic evaluation of patients with MM. Based on the previous staging system evaluating tumor load, the R-ISS stage also included the biological characteristics of the disease, including cytogenetic characteristics and LDH; however, it only included three cytogenetic markers, and most patients were uniformly included in stage II, ignoring the heterogeneity of patients, which was still relatively limited[Citation2]. More cytogenetic markers were included in the mSMART stratification system, and the influence of cytogenetics and cell differentiation on prognosis was comprehensively considered. After continuous updating, it was updated to version 3.0, which has been widely used; however, the proportion of the tumor load is relatively low[Citation3].
In response to the above problems, scholars are committed to exploring a more accurate prognostic model for patients with MM and propose the MASS, which can better reflect the compound effect of high-risk disease characteristics. The MASS relies on a variety of cytogenetic abnormalities, LDH values, ISS staging and other risk scores, which, to some extent, overcomes the limitations of the traditional staging system and is more convenient and flexible[Citation4].
This study conducted a retrospective analysis of a group of patients with newly diagnosed MM, and found statistically significant differences in survival among the groups according to R-ISS or mSMART3.0 staging, indicating that the original staging systems had a corresponding prognostic value for this group of patients. Subsequently, the latest MASS staging system was used to stratify the risk in this group of patients and perform prognostic survival analysis. Statistical differences were also found among the three groups of patients (stages I, II, and III), which verified the prognostic value of MASS staging in real-world patients. In addition, to eliminate bias caused by treatment plans, this study conducted a subgroup analysis of patients in the PAD treatment group according to the MASS staging system, and verified that risk stratification could be further performed in different age, transplant, and non-transplant groups, which is consistent with the study by Abdallah et al. [Citation4].
Moreover, in the real world, many patients are suitable for transplantation but have not undergone transplantation owing to various objective factors. These patients require attention, and an appropriate prognostic system needs to be identified. Therefore, this study conducted further risk stratification for these patients according to the MASS, and found that there were significant differences in prognosis among patients at each stage, indicating that the MASS also had prognostic significance for these patients. Previous studies have shown that bone destruction is an adverse prognostic factor for MM[Citation11–13]. Most patients included in this study had bone destruction. MASS staging was used to analyze the survival of patients in the bone destruction subgroup, and there were differences among the stages. Similarly, differences in survival were observed between the normal and impaired renal groups.
In addition, complex karyotypes are widely considered high-risk prognostic factors for MM[Citation14–16]. Although some IgH translocations are considered in the mSMART and R-ISS staging, many complex karyotypes that are not IgH translocations have not been considered. Therefore, further prognostic analysis of these patients was conducted in this study, and it was found that the prognosis of the complex karyotype group was worse than that of high-risk patients in other staging systems. Although the sample size of these patients was small, this result suggests that a complex karyotype might be included as a new high-risk factor in the risk stratification criteria.
The evaluation criterion for the MASS high-risk group was 2 + points (patients with at least two risk factors). Analysis of the scoring criteria of MASS staging showed that patients with scores of 2 and 3 may contain only cytogenetic factors or tumor high load factors, while patients with scores ≥4 must contain both cytogenetic factors and tumor high load factors. Therefore, in this study, further risk stratification was performed for the MASS high-risk group of patients, who were divided into two groups, scores of 2 and 3 into one group, and scores of 4 and above into the other. Survival analysis revealed significant differences between these two groups. Therefore, it can be inferred that in patients in the MASS high-risk group, the boundary can be set at a score of 3 to further stratify and improve the accuracy of prognosis assessment.
The mSMART stratification mainly divides patients with MM into two groups based on cytogenetic abnormalities, which are not very clearly defined. Although the R-ISS includes a situation of high tumor load, it does not fully consider the situation of both cytogenetic abnormalities and high tumor load from the perspective of defining a high-risk group of patients. Overlap of multiple adverse prognostic factors has not been adequately considered in relatively high-risk patients. The MASS overcomes the above problems, taking into full account the overlap of various high-risk factors through the integral model. In this study, patients in the mSMART3.0 standard and high-risk groups were further stratified according to the MASS, and survival analysis among the groups showed significant differences. By comparing both the C-index and AIC values of the two prognostic models, it was found that the MASS had a higher C-index value and a lower AIC index; thus the MASS had better predictive performance than SMART3.0. Similarly, in R-ISS stage II patients, there were also differences among the groups after MASS staging, indicating that the MASS could be used to stratify the prognosis of patients with newly diagnosed MM more accurately based on the original prognosis model, which was a further optimization of the original staging system.
In conclusion, the MASS can effectively stratify the risk of patients with newly diagnosed MM in the real world more successfully than previous systems. In addition, its ‘integral accumulation system’ can identify patients with heterogeneous prognosis from the previous staging system, and facilitate the timely addition of new prognostic factors in the future, which is more flexible and convenient than the previous staging systems. It has good application value for the prognostic assessment of patients with MM, is worth further popularization and application, and requires further optimization. The validation and exploration of this prognostic model in the era of mAb therapy and its combined application with MRD monitoring remains to be studied.
Statement of ethics
All patients gave signed, informed consent to participate in the study.
Acknowledgement
We thank the patients, physicians, and site staff participating in this study.
Disclosure statement
No potential conflict of interest was reported by the author(s).
Data availability statement
All data generated or analyzed during this study are included in this article. Further enquiries can be directed to the corresponding author.
Additional information
Funding
References
- Chinese Hematology Association. Guidelines for the diagnosis and management of multiple myeloma in China (2022 revision). Zhonghua Nei Ke Za Zhi. 2022;61(5):480–487. doi:10.3760/cma.j.cn112138-20220309-00165.
- Radocha J, Maisnar V, Pour L, et al. Multiple myeloma R-ISS prognostic stratification system in real life population. Blood. 2016;128:3333. doi:10.1182/blood.v128.22.3333.3333.
- Garifullin A, Voloshin S, Shuvaev V, et al. Significance of modified risk stratification msmart 3.0 and autologous stem cell transplantation for patients with newly diagnosed multiple myeloma. Blood. 2019;134:5593–5593. doi:10.1182/blood-2019-130092.
- Abdallah NH, Binder M, Rajkumar SV, et al. A simple additive staging system for newly diagnosed multiple myeloma. Blood Cancer J. 2022;12(1):21. doi:10.1038/s41408-022-00611-x.
- Rajkumar SVP, Dimopoulos MAP, Palumbo AP, et al. International myeloma working group updated criteria for the diagnosis of multiple myeloma. Lancet Oncol. 2014;15(12):e538–e548. doi:10.1016/S1470-2045(14)70442-5.
- Ma KW, Sun C, Li JY, et al. Research progress on prognostic factors of multiple myeloma. Zhongguo Shi Yan Xue Ye Xue Za Zhi. 2021;29(4):1346–1350. doi:10.19746/j.cnki.issn.1009-2137.2021.04.053.
- Wang S, Xu L, Feng J, et al. Prevalence and incidence of multiple myeloma in urban area in China: a national population-based analysis. Front Oncol. 2020;9:1513. doi:10.3389/fonc.2019.01513.
- Hanamura I. Multiple myeloma with high-risk cytogenetics and its treatment approach. Int J Hematol. 2022;115(6):762–777. doi:10.1007/s12185-022-03353-5.
- Hamdaoui H, Benlarroubia O, Ait Boujmia OK, et al. Cytogenetic and FISH analysis of 93 multiple myeloma Moroccan patients. Mol Genet Genomic Med. 2020;8(9):e1363. doi:10.1002/mgg3.1363.
- Cardona-Benavides IJ, de Ramón C, Gutiérrez NC. Genetic abnormalities in multiple myeloma: prognostic and therapeutic implications. Cells. 2021;10(2):336. doi:10.3390/cells10020336.
- Dao A, McDonald MM, Savage PB, et al. Preventing osteolytic lesions and osteomyelitis in multiple myeloma. J Bone Oncol. 2022;37:100460. doi:10.1016/j.jbo.2022.100460.
- Jin Y, Shang Y, Liu H, et al. A retrospective analysis: a novel index predicts survival and risk-stratification for bone destruction in 419 newly diagnosed multiple myelomas. OncoTargets Ther. 2019;12:10587–10596. doi:10.2147/OTT.S229122.
- Hiasa M, Harada T, Tanaka E, et al. Pathogenesis and treatment of multiple myeloma bone disease. Jpn Dent Sci Rev. 2021;57:164–173. doi:10.1016/j.jdsr.2021.08.006.
- Hao S, Lu X, Gong Z, et al. The survival impact of CKS1B gains or amplification is dependent on the background karyotype and TP53 deletion status in patients with myeloma. Mod Pathol. 2021;34(2):327–335. doi:10.1038/s41379-020-00669-7.
- Ankathil R, Foong E, Siti-Mariam I, et al. Hyperdiploid multiple myeloma with novel complex structural chromosome abnormalities associated with poor prognosis: a rare case report. Int J Hematol Oncol Stem Cell Res. 2021;15(3):199–205. doi:10.18502/ijhoscr.v15i3.6852.
- Sawyer JR. The prognostic significance of cytogenetics and molecular profiling in multiple myeloma. Cancer Genet. 2011;204(1):3–12. doi:10.1016/j.cancergencyto.2010.11.002.