
ABSTRACT
Purpose:
Although the prognosis of multiple myeloma (MM) has remarkably improved with the emerge of novel agents, it remains incurable and relapses inevitably. The molecular mechanisms of MM have not been well-studied. Herein, this study aimed to identify key genes in MM.
Materials and Methods:
The GSE39754 dataset was used to screen differentially expressed genes (DEGs) and construct a co-expression network. Hub nodes were identified in the protein and protein interaction (PPI) network. Datasets GSE13591 and GSE2658 were used to validate hub genes. Moreover, function and gene set enrichment analyses were performed to elucidate the molecular pathogenesis of MM.
Results:
In this study, 11 genes were found to be hub genes in the co-expression network, among which four genes (CD68, FCER1G, PLAUR and LCP2) were also identified as hub nodes. In the test dataset GSE13591, CD68 and FCER1G were significantly downregulated in MM. Besides, the areas under the curve (AUCs) of CD68 and FCER1G were greater than 0.8 in both the training dataset and the test dataset. Our results also confirmed that FCER1G highly expressed patients had remarkably longer survival times in MM. Function and pathway enrichment analyses suggested that hub genes were associated with epithelial mesenchymal transition, TNF-α signaling via NF-κB and inflammatory response. GSEA in our study indicated that FCER1G participated in NK cell mediated cytotoxicity and the NOD-like receptor signaling pathway.
Conclusion:
Our study identified FCER1G as a key gene in MM, providing a novel biomarker and potential molecular mechanisms of MM for further studies.
Introduction
Multiple myeloma (MM) is one of the most common hematologic malignancies, characterized by increased abnormal clonal plasma cells in the bone marrow [Citation1]. It is estimated that the number of new cases attributed to MM was almost 1.5 times that of deaths in 2020 [Citation2]. In recent years, with the application of autologous hematopoietic stem cell transplantation (auto-HSCT) in young patients and the development of novel drugs, the outcomes in MM patients have markedly improved [Citation3–5]. Nevertheless, MM remains incurable and fatal, with the majority of patients failed to escape of disease recurrence and aggravation [Citation6, Citation7]. Therefore, it is urgently needed to elucidate the specific mechanisms contributing to disease progression and identify novel biomarkers of prognostic prediction and therapeutic improvements in MM patients.
The high heterogeneity of tumor cells is a hallmark of genome and transcriptome in multiple myeloma, in this context, DNA microarrays and RNA sequencing are able to measure the expression level of thousands of genes and even entire transcriptome. Accumulating evidence associates abnormal mRNA expression with the occurrence, progression and prognosis of multiple myeloma. With the rapid developments of high-throughput technologies and bioinformatics, a large number of gene expression spectrums have been widely employed to identify certain disease-related biomarkers [Citation8]. A growing body of research has been carried out to identify potential mechanisms of MM on the basis of microarray data profiles [Citation9–12]. Weighted gene co-expression network analysis (WGCNA) serves as an effective data mining approach to focusing on the interconnection between genes, which could explore the huge and complex relationships among genes and identify genes with high connectivity, thereby providing promising targets related to clinical traits of interest [Citation13]. In the present study, we aimed to explore network-centric genes related to clinical phenotypes of MM by constructing WGCNA on the basis of data from Gene Expression Omnibus (GEO) database. The expected results may provide a novel insight into our understanding of carcinogenesis in MM and potential biomarkers for its prognosis and treatment.
Methods and materials
Data collection
By searching GEO database (https://www.ncbi.nlm.nih.gov/geo/), we obtained expression data with corresponding information of MM patients. The GSE39754 dataset performed on Affymetrix Human Exon 1.0 ST Array was selected as the training set used for the construction of the co-expression network in our study, which included 170 newly diagnosed MM patients and 6 healthy donors [Citation14]. GSE13591 was taken as one of independent test datasets, including 133 MM patients and 5 normal donors [Citation15]. The GSE2658 dataset contained the microarray data of CD138-selected plasma cells from bone marrow of 559 newly diagnosed MM patients [Citation16], which was selected as another test dataset.
Data preprocessing
Preprocessing and normalizing the downloaded raw data were accomplished through the ‘affy’ package in R [Citation17]. The quality of microarray data was evaluated by sample clustering on the basis of Pearson’s correlation matrices and average linkage between different samples.
Differentially expressed genes (DEGs) identification
The ‘limma’ package in R [Citation18] was utilized to screen DEGs between samples from healthy donors and MM patients in GSE39754. The |log2-fold change (FC)| > 1 combined with false discovery rate (FDR) < 0.05 was taken as the threshold value. Kyoto Encyclopedia of Genes and Genomes (KEGG) pathway enrichment and gene ontology (GO) analyses were performed by ‘clusterProfiler’ package in the R environment. p.adjust <0.05 and q value <0.2 was set as the cut-off value.
WGCNA construction
WGCNA was conducted using ‘WGCNA (version 1.6.9)’ package in R, which could show the connection between gene modules and clinical phenotypes by clustering genes with similar expression patterns [Citation19]. Samples were clustered and the outliers were removed from our study. First, we utilized the soft threshold selection analysis to determine an appropriate soft thresholding power, ensuring that genes were interacted by scale-free distribution [Citation20]. Then, the adjacency was transformed into the topological overlap matrix (TOM). Subsequently, different modules could be identified through the dynamics cut tree algorithms by detecting groups of highly correlated genes, followed by the use of 1-TOM dissimilarity with a minimum size of 30 cut-off [Citation21, Citation22]. After that, a cutline for module dendrogram was chosen to merge similar modules (dissimilarity degree of MES < 0.25).
Significant modules and hub genes identification
Module eigengene (ME) was deemed as the dominant component of one gene module, module significance (MS) represents the average value of gene expression levels (gene significance, GS) in each gene module, which were two important parameters in identification of clinically significant modules. Module membership indicates the Pearson’s correlation between ME and gene expression profile in a given module. In our study, hub genes were identified as genes with high absolute value of module membership (|cor.geneModuleMembership| > 0.8) [Citation23]. Since most proteins function by interacting with other proteins, constructing a protein–protein interaction (PPI) network may help us to better identify genes or proteins of great significance. We uploaded genes into the STRING database (https://string-db.org/) [Citation24] and visualized by Cytoscape software, the PPI network was constructed with the confidence of > 0.4. Hub nodes were deemed as genes possessing connectivity degree of ≥ 20. Those genes in both the PPI network and the co-expression network were considered to be ‘real’ hub genes for validation.
Hub genes validation
The expression levels of hub genes were validated by the test dataset of GSE13591. GSE2658 was selected as another independent test dataset to perform survival analyses, in which 559 MM samples were dichotomized into two subgroups according to the medium value of gene expression levels. Furthermore, the ‘survival’ package in R was applied to implement log-rank tests and generate Kaplan-Meier survival curve [Citation25]. To measure the specificity and accuracy of hub genes, receiver operator characteristic (ROC) analyses were performed in the training dataset of GSE39754 and the test dataset of GSE13591 [Citation26].
Function and pathway enrichment analysis
To explore the functional roles of the above hub genes, function and pathway enrichment analysis has been carried out by Metascape (https://metascape.org) [Citation27] with the following ontology sources: Hallmark Gene Sets, Reactome Gene Sets, KEGG Pathway, Canonical Pathways, GO Biological Processes and CORUM. Terms with a minimum count of 3, p-value < 0.01 as well as an enrichment factor (the ratio between observed counts and the counts expected by chance) > 1.5 were categorized into clusters on the basis of membership similarities.
Gene set enrichment analysis (GSEA)
In GSE13591, 133 MM patients were grouped into two subgroups (high and low) according to the median value of the expression levels of genes. The collection of annotated gene sets of c2.cp.kegg.v7.5.1.symbols.gmt in Molecular Signatures Database (MSigDB, https://www.gsea-msigdb.org/gsea/msigdb/index.jsp) was selected as a reference gene set. FDR < 0.25 and NOM p-value < 0.05 was chosen as the cut-off criteria [Citation28].
Results
DEGs identification
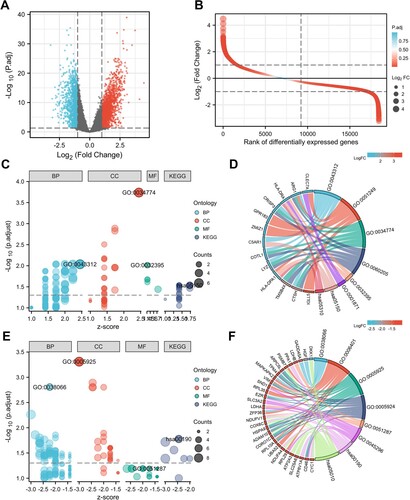
In the GSE39754 dataset, we obtained the normalized expression data of 18,432 genes from 170 MM and 6 healthy control samples. Our results identified 2947 DEGs, among which 1628 DEGs were significantly upregulated and 1319 DEGs were significantly downregulated ((A,B)). According to GO and KEGG analyses, upregulated DEGs were significantly enriched in neutrophil degranulation (GO:0043312, including CTSH, C5AR1, COTL1, ARG1, CRISP3 and LYZ), Staphylococcus aureus infection (hsa05150, including HLA-DPA1, HLA-DRA and C5AR1), secretory granule lumen (GO:0034774, including ARG1, CRISP3, COTL1, LYZ, TMSB4X and CTSH) and MHC class II receptor activity (GO:0032395, including HLA-DPA1 and HLA-DRA) ((C,D)). The downregulated DEGs were significantly enriched in p38MAPK cascade (GO:0038066, including MAPKAPK2, ZFP36, HGF, EZR and GADD45A), focal adhesion (GO:0005925, including HSPA9, ARPC5L, RPL10A, VIM, CORO1C, TPM4, ADAM10, EZR and CD46), NAD binding (GO:0051287, including LDHB, NDUFV1 and LDHA) and oxidative phosphorylation (hsa00190, including COX6C, CYC1, NDUFV1, NDUFA4, PPA1 and ATP6V1A) ((E,F)). The top 20 GO terms in the enrichment analysis of DEGs were shown in the supplementary materials (Table S1).
Figure 1. DEGs identification and function analysis. (A) Volcano plot and (B) Differential ordering diagram visualizing DEGs in GSE39754. The red dots represent upregulated genes, the blue dots represent downregulated genes. GO and KEGG analysis of upregulated DEGs (C, D) and downregulated DEGs (E, F). In figure C and E, the size of the nodes is proportional to the number of genes, the different color of the nodes represents different ontologies, including biological process (BP), cellular component (CC), molecular function (MF) and Kyoto Encyclopedia of Genes and Genomes (KEGG). In figure D and F, the left half circle includes color modules of genes, the color represents logFC value, the right half circle includes color modules of terms, the size represents the number of genes. DEG, differentially expressed genes.
Weighted co-expression network construction and key module identification
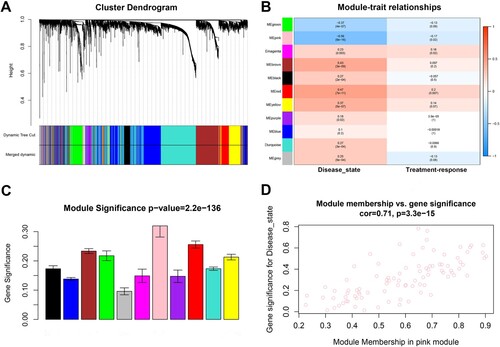
Our study utilized sample clustering to detect microarray outliers. With a height cut of 40,000, three samples (GSM978565, GSM978566 and GSM978567) were deemed as outliers and removed. Consequently, 162 MM samples with complete information were included in co-expression analysis. Those genes with similar expression patterns were divided into the same module by using the ‘WGCNA’ package in R ((A)). We selected β = 5 (scale free R2 = 0.92) as the soft-threshold to construct a scale-free network ((B–E)). At a height cut of 0.75, 11 modules were eventually achieved ((A)). Two methods were measured to assess the relevance of the key module to disease state. Based on the heatmap of correlation between MEs and clinical traits ((B)), we found that the pink module had a significantly negative correlation with disease state of clinical samples (P = 9e-16, R2 = −0.56). Moreover, the pink module also possessed the highest MS ((C)). For each gene, module membership and GS in pink module were calculated to draw the scatterplot (cor = 0.71, p = 3.3e-15, (D)). Therefore, the pink module in association with disease state was identified as the clinically significant module that contained 91 genes and extracted for subsequent analyses.
Figure 2. Gene cluster analysis. (A) Sample dendrogram and trait heatmap. The branches of the dendrogram correspond to clustered samples. (B, C) Construction of the scale-free network with a suitable soft-thresholding power (β). (D) Histogram of connectivity distribution when β = 5. (E) Checking the scale free topology when β = 5.
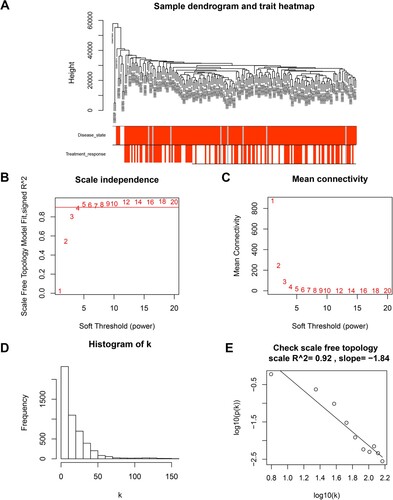
Figure 3. Identification of modules associated with clinical traits of MM. (A) Cluster dendrogram of genes based on dissimilarity measure (1-TOM). (B) Heatmap of the correlation between module eigengenes and clinical traits of MM. (C) Distribution of average gene significance and errors in the modules. (D) The relationship between the module membership and gene significance in the pink module. MM, multiple myeloma; TOM, topological overlap matrix.
Hub genes identification
Eleven genes with high connectivity in pink module were identified to be hub genes in our study (). A PPI network was constructed and visualized by Cytoscape ((A)). Under the confidence level of > 0.4 and connectivity degree of ≥ 20, there were 20 genes identified as hub nodes in the PPI network (Table S2). The four genes (CD68, FCER1G, PLAUR and LCP2) in both the co-expression network and the PPI network were identified as ‘real’ hub genes to facilitate further validation (, (B)).
Figure 4. Hub genes identification. (A) Protein-protein interaction (PPI) network visualized by cytoHubba. Nodes represent genes in the pink module. Node size represents connectivity of the gene measured by degree. (B) Venn diagram of the hub genes and hub nodes.
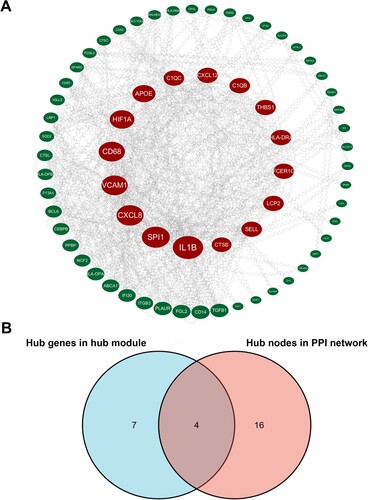
Table 1. Hub genes in the pink module related with disease state.
Hub genes validation
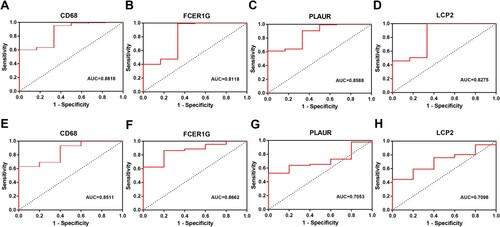
In the test dataset GSE13591, we observed that CD68 and FCER1G were also significantly downregulated in MM samples compared with normal group (CD68 P < 0.0001; FCER1G P = 0.0001, (A–D)). To evaluate the prognostic value of the four candidate hub genes, survival analyses were performed in GSE2658. Our results confirmed that patients who expressed lower level of FCER1G had significantly shorter survival times (P = 0.002, (F)), however, the other three hub genes were not significantly correlated with survival time in MM patients ((E, G and H)). Moreover, ROC analyses were performed to assess the capacity of hub genes to distinguish MM patients from healthy people in GSE39754 and GSE13591, respectively. As a result, the areas under the curve (AUCs) of four hub genes were all greater than 0.7, among which the AUCs of CD68 and FCER1G were greater than 0.8 in both the training dataset and the test dataset ().
Figure 5. Validation of gene expression level and prognostic value. (A-D) The expression level of four hub genes (CD68, FCER1G, PLAUR and LCP2) validated in GSE13591. (E-H) Kaplan–Meier survival analysis of four hub genes (CD68, FCER1G, PLAUR and LCP2) in MM patients in GSE2658. MM, multiple myeloma.
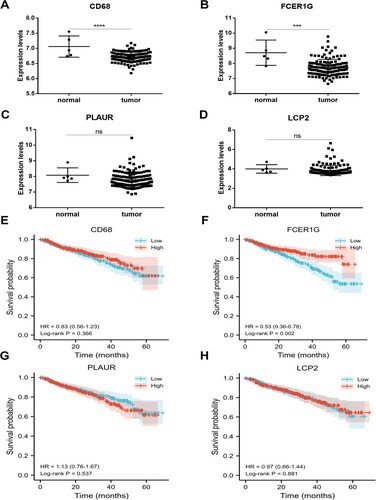
Figure 6. ROC curves of four hub genes (CD68, FCER1G, PLAUR and LCP2) analyzed in GSE39754 (A-D) and GSE13591 (E-H).
Function and pathway enrichment analysis
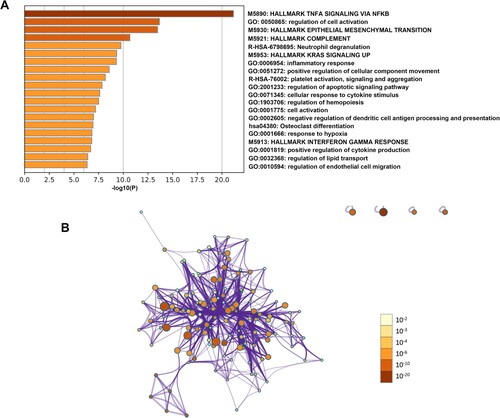
To elucidate the biological functions of hub genes in the pink module, functional enrichment analyses were performed by Metascape. Our results showed that these genes exhibited significantly enriched pathways and processes related to TNF-α signaling via NF-κB, regulation of cell activation, epithelial–mesenchymal transition, neutrophil degranulation and inflammatory response ().
Figure 7. Function and pathway enrichment analysis of hub genes in the pink module. (A) Bar graph of enriched terms of genes colored by P-values. (B) Network of enriched terms colored by P-value. The size of the nodes is proportional to the number of genes. The color depth of the nodes is proportional to the size of P-value. Terms with more genes tend to have more significant P-values.
Gene set enrichment analysis (GSEA)
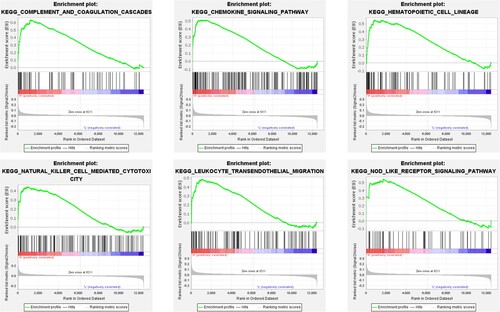
To learn more about the biological functions and pathways in association with hub genes in MM, GSEA was conducted to search KEGG pathways enriched in samples with highly expressed CD68 and FCER1G, respectively. As a result, 26 gene sets were enriched in FCER1G highly expressed samples, however, none gene sets were found to be enriched in CD68 highly expressed samples under the threshold value of FDR < 0.25 and NOM p-value < 0.05. Six representative pathways involved in FCER1G highly expressed samples were presented, including chemokine signaling pathway, complement and coagulation cascades, hematopoietic cell lineage, leukocyte transendothelial migration, natural killer (NK) cell-mediated cytotoxicity and the NOD-like receptor signaling pathway ().
Figure 8. Gene set enrichment analysis. Six significant and representative functional gene sets enriched in MM samples with highly expressed FCER1G were presented. MM, multiple myeloma.
Discussion
MM is the second most common haematological malignancy in high-income countries that produce monoclonal immunoglobulin [Citation3]. In almost all patients, MM always begins as smoldering multiple myeloma (SMM) or monoclonal gammopathy of undetermined significance (MGUS) [Citation29]. As is known to all, immunomodulatory agents and proteasome inhibitors are still the cornerstones of treatment nowadays. Additionally, CD38-targeting antibody is becoming an important component of relapse or even first-line therapies. In recent years, there were numerous novel drugs being found in treatment of relapsed MM, including carfilzomib, selinexor and belantamab mafodotin [Citation1]. Although the current treatments are highly effective in controlling the disease, a large number of patients still suffer from disease refractory and relapse. Accordingly, it is of great significance to identify novel targets involved in the progression and prognosis of MM. The WGCNA algorithm, which is possible to find highly related gene modules and link them to clinical phenotypes, has been widely applied to screen core genes in various types of cancer, such as cholangiocarcinoma, ovarian cancer, hepatocellular carcinoma, gastric cancer and lymphoma [Citation30–35], as well as in more and more non-neoplastic diseases [Citation36–40]. However, it is rarely utilized in MM so far [Citation41–43].
In the present study, a co-expression network was constructed based on the microarray of MM (GSE39754). The key module pink was found to be highly correlated with disease state in MM, in which 11 genes were identified as hub genes. Then, combined with the construction of PPI network, four genes (CD68, FCER1G, PLAUR and LCP2) were ultimately considered as candidate hub genes for further analyses. Among the four hub genes, we found the expression levels of CD68 and FCER1G were also significantly lower in MM patients validated in the test dataset. In addition, as determined by AUCs of ROC curves, CD68 and FCER1G exhibited excellent diagnostic efficacy for MM patients and healthy people in the training set as well as the test dataset. Subsequently, further validation of the hub genes was carried out through survival analyses. As a result, significantly better survival outcomes were observed in FCER1G highly expressed patients, indicating that FCER1G might serve as a potential biomarker for prognosis in MM.
FCER1G, also known as Fc receptor-gamma (FcRγ), is located on chromosome 1q23.3 and encodes the γ subunit of the fragment crystallizable (Fc) region (Fc R) of immunoglobulin E (IgE). It is recognized that the combination of the Fc of immunoglobulins and the Fc R on immune cells is a key step in the activation of cellular effector functions via the antigen–antibody binding reaction [Citation44, Citation45]. Previous studies have shown that FCER1G was involved in the development of kinds of diseases, such as glioma, diabetic kidney disease, endometrial cancer and osteosarcoma [Citation46–49]. Recently, a class of αβ T-cell receptor–positive and FCER1G-expressing T cells with high cytotoxic potential was identified as a class of tumor-specific T cells, and FCER1G was a defining marker for the lineage, indicating that FCER1G may play a crucial role in T cell-mediated antitumor immune response [Citation50]. Moreover, FCER1G was reported to be a hub gene participating in the cytokine storm syndrome in COVID-19 patients [Citation51]. It has been reported that high expression level of FCER1G was related to T cell suppression and macrophage infiltration, besides, FCER1G and CD68 low expressed patients had the longest overall survival in clear cell renal cell carcinoma, which were two hub genes also identified in our study [Citation52]. In the viral infection process, FCER1G was demonstrated to be a regulator of NK cell-dependent CD8+ T-cell functions [Citation53]. Similarly, GSEA in our study revealed that high expression of FCER1G was related to NK cell -mediated cytotoxicity. However, the knowledge regarding the function and role of FCER1G in MM is limited. Fu et al. reported that FCER1G expression decreased with the progression of MM and its high level may become a good prognostic factor in MM patients [Citation54], which were consistent with our results. The difference is that Fu’s research was aimed at exploring the role of FCER1G in MM through GEO datasets, however, our study was aimed at identifying key genes in MM and ultimately identified FCER1G as a key gene by WGCNA. That is to say, the research purposes of the two were essentially different. Another study also identified FCER1G as a significant gene in MM, however, the method used was different from our study [Citation55].
To get further insight into the underlying mechanisms of FCER1G in MM, function and pathway enrichment analyses were performed. Our results showed that FCER1G was involved in NK cell-mediated cytotoxicity, epithelial–mesenchymal transition and leukocyte transendothelial migration, indicating that FCER1G may play a key role in the tumorigenesis and progression. As mentioned above, previous studies have revealed that FCER1G-expressing NK cells could respond to the over activation of CD8+ T cells and was related to T cell suppression [Citation52, Citation53]. Therefore, it is presumable that FCER1G may be relevant to the activity of NK cells for regulation of CD8+ T cell response in the development and progression of MM, and it provided insight into the underlying mechanisms of FCER1G expression interaction with tumor immunity in MM. Furthermore, our study found that FCER1G participated in the NOD-like receptor signaling pathway. However, the specific regulatory mechanism needs to be further studied.
In summary, this is the first study to identify FCER1G as a key gene in MM by performing WGCNA. We demonstrated that FCER1G was negatively associated with the progression of MM and might be a favorable biomarker in MM patients. Further experimental evidence is necessary to validate our findings obtained in this study.
Disclosure statement
No potential conflict of interest was reported by the author(s).
Additional information
Funding
References
- Cowan AJ, Green DJ, Kwok M, et al. Diagnosis and management of multiple myeloma: A Review. Jama. 2022;327(5):464–477.
- Sung H, Ferlay J, Siegel RL, et al. Global cancer statistics 2020: GLOBOCAN estimates of incidence and mortality worldwide for 36 cancers in 185 countries. CA Cancer J Clin. 2021;71(3):209–249.
- van de Donk NWCJ, Pawlyn C, Yong KL. Multiple myeloma. Lancet. 2021;397(10272):410–427.
- Kumar SK, Dimopoulos MA, Kastritis E, et al. Natural history of relapsed myeloma, refractory to immunomodulatory drugs and proteasome inhibitors: a multicenter IMWG study. Leukemia. 2017;31(11):2443–2448.
- Zhou L, Yu Q, Wei G, et al. Measuring the global, regional, and national burden of multiple myeloma from 1990 to 2019. BMC Cancer. 2021;21(1):606.
- Martinez-Lopez J, Blade J, Mateos M-V, et al. Long-term prognostic significance of response in multiple myeloma after stem cell transplantation. Blood. 2011;118(3):529–534.
- Marinac CR, Ghobrial IM, Birmann BM, et al. Dissecting racial disparities in multiple myeloma. Blood Cancer J. 2020;10(2):19.
- Choi JK, Yu U, Yoo OJ, et al. Differential coexpression analysis using microarray data and its application to human cancer. Bioinformatics. 2005;21(24):4348–4355.
- Ban C, Yang F, Wei M, et al. Integrative analysis of gene expression through one-class logistic regression machine learning identifies stemness features in multiple myeloma. Front Genet. 2021;12:666561.
- Wang R, Bu W, Yang Y. Identification of metabolism-related genes influencing prognosis of multiple myeloma patients. J Healthc Eng. 2021;2021:6574491.
- Wu D, Miao J, Hu J, et al. Psmb7 Is a Key gene involved in the development of multiple myeloma and resistance to bortezomib. Front Oncol. 2021;11:684232.
- Xu M, Meng Y, Li Q, et al. Identification of biomarkers for early diagnosis of multiple myeloma by weighted gene co-expression network analysis and their clinical relevance. Hematology. 2022;27(1):322–331.
- Langfelder P, Horvath S. WGCNA: an R package for weighted correlation network analysis. BMC Bioinformatics. 2008;9(1):559.
- Chauhan D, Tian Z, Nicholson B, et al. A small molecule inhibitor of ubiquitin-specific protease-7 induces apoptosis in multiple myeloma cells and overcomes bortezomib resistance. Cancer Cell. 2012;22(3):345–358.
- Agnelli L, Mosca L, Fabris S, et al. A SNP microarray and FISH-based procedure to detect allelic imbalances in multiple myeloma: An integrated genomics approach reveals a wide gene dosage effect. Genes Chromosomes Cancer. 2009;48(7):603–614.
- Hanamura I, Huang Y, Zhan F, et al. Prognostic value of Cyclin D2 mRNA expression in newly diagnosed multiple myeloma treated with high-dose chemotherapy and tandem autologous stem cell transplantations. Leukemia. 2006;20(7):1288–1290.
- Gautier L, Cope L, Bolstad BM, et al. Affy—analysis of Affymetrix GeneChip data at the probe level. Bioinformatics. 2004;20(3):307–315.
- Ritchie ME, Phipson B, Wu D, et al. Limma powers differential expression analyses for RNA-sequencing and microarray studies. Nucleic Acids Res. 2015;43(7):e47.
- Zhang B, Horvath S. A general framework for weighted gene co-expression network analysis. Stat Appl Genet Mol Biol. 2005;4:Article17.
- Botía JA, Vandrovcova J, Forabosco P, et al. An additional k-means clustering step improves the biological features of WGCNA gene co-expression networks. BMC Syst Biol. 2017;11(1):47.
- Yip AM, Horvath S. Gene network interconnectedness and the generalized topological overlap measure. BMC Bioinformatics. 2007;8:22.
- Ravasz E, Somera AL, Mongru DA, et al. Hierarchical organization of modularity in metabolic networks. Science. 2002;297(5586):1551–1555.
- Presson AP, Sobel EM, Papp JC, et al. Integrated weighted gene Co-expression network analysis with an application to chronic fatigue syndrome. BMC Syst Biol. 2008;2:95.
- Szklarczyk D, Franceschini A, Wyder S, et al. STRING v10: protein–protein interaction networks, integrated over the tree of life. Nucleic Acids Res. 2015;43(Database issue):D447–D452.
- Kishore J, Goel M, Khanna P. Understanding survival analysis: Kaplan-Meier estimate. Int J Ayurveda Res. 2010;1(4):274–278.
- Heagerty PJ, Zheng Y. Survival model predictive accuracy and ROC curves. Biometrics. 2005;61(1):92–105.
- Zhou Y, Zhou B, Pache L, et al. Metascape provides a biologist-oriented resource for the analysis of systems-level datasets. Nat Commun. 2019;10(1):1523.
- Subramanian A, Tamayo P, Mootha VK, et al. Gene set enrichment analysis: A knowledge-based approach for interpreting genome-wide expression profiles. Proc Natl Acad Sci U S A. 2005;102(43):15545–15550.
- Weiss BM, Abadie J, Verma P, et al. A monoclonal gammopathy precedes multiple myeloma in most patients. Blood. 2009;113(22):5418–5422.
- Long J, Huang S, Bai Y, et al. Transcriptional landscape of cholangiocarcinoma revealed by weighted gene coexpression network analysis. Brief Bioinform. 2021;22(4):bbaa224.
- Su R, Jin C, Zhou L, et al. Construction of a ceRNA network of hub genes affecting immune infiltration in ovarian cancer identified by WGCNA. BMC Cancer. 2021;21(1):970.
- You J-A, Gong Y, Wu Y, et al. Wgcna, LASSO and SVM algorithm revealed RAC1 correlated M0 macrophage and the risk score to predict the survival of hepatocellular carcinoma patients. Front Genet. 2022;12:730920.
- Rezaei Z, Ranjbaran J, Safarpour H, et al. Identification of early diagnostic biomarkers via WGCNA in gastric cancer. Biomed Pharmacother. 2022;145:112477.
- Liu H, Liu M, You H, et al. Oncogenic network and Hub genes for natural killer/T-cell lymphoma utilizing WGCNA. Front Oncol. 2020;10:223.
- Guo D, Wang H, Sun L, et al. Identification of key gene modules and hub genes of human mantle cell lymphoma by coexpression network analysis. PeerJ. 2020;8:e8843.
- Haase F, Gloss BS, Tam PPL, et al. Wgcna identifies translational and proteasome-ubiquitin dysfunction in rett syndrome. Int J Mol Sci. 2021;22(18):9954.
- Yao M, Zhang C, Gao C, et al. Exploration of the shared gene signatures and molecular mechanisms between systemic lupus erythematosus and pulmonary arterial hypertension: evidence from transcriptome data. Front Immunol. 2021;12:658341.
- Wang Y, Chen G, Shao W. Identification of ferroptosis-related genes in Alzheimer’s disease based on bioinformatic analysis. Front Neurosci. 2022;16:823741.
- Wang J, Yin Y, Lu Q, et al. Identification of important modules and Hub gene in chronic kidney disease based on WGCNA. J Immunol Res. 2022;2022:4615292.
- Chen X, He X-Y, Dan Q, et al. FAM201A, a long noncoding RNA potentially associated with atrial fibrillation identified by ceRNA network analyses and WGCNA. BMC Med Genomics. 2022;15(1):80.
- Zhang L, Sun S, Wang Y, et al. Gossypol induces apoptosis of multiple myeloma cells through the JUN-JNK pathway. Am J Cancer Res. 2020;10(3):870–883.
- Hu F, Chen X-Q, Li X-P, et al. Drug resistance biomarker ABCC4 of selinexor and immune feature in multiple myeloma. Int Immunopharmacol. 2022;108:108722.
- Liu L, Qu J, Dai Y, et al. An interactive nomogram based on clinical and molecular signatures to predict prognosis in multiple myeloma patients. Aging. 2021;13(14):18442–18463.
- Küster H, Thompson H, Kinet JP. Characterization and expression of the gene for the human Fc receptor gamma subunit. Definition of a new gene family. J Biol Chem. 1990;265(11):6448–6452.
- Brandsma AM, Hogarth PM, Nimmerjahn F, et al. Clarifying the confusion between cytokine and Fc receptor “common gamma chain”. Immunity. 2016;45(2):225–226.
- Xu H, Zhu Q, Tang L, et al. Prognostic and predictive value of FCER1G in glioma outcomes and response to immunotherapy. Cancer Cell Int. 2021;21(1):103.
- Liu S, Wang C, Yang H, et al. Weighted gene co-expression network analysis identifies FCER1G as a key gene associated with diabetic kidney disease. Ann Transl Med. 2020;8(21):1427.
- Chen Q, Wang S, Lang J-H. Development and validation of nomogram with tumor microenvironment-related genes and clinical factors for predicting overall survival of endometrial cancer. J Cancer. 2021;12(12):3530–3538.
- Li J, Shi H, Yuan Z, et al. The role of SPI1-TYROBP-FCER1G network in oncogenesis and prognosis of osteosarcoma, and its association with immune infiltration. BMC Cancer. 2022;22(1):108.
- A Self-reactive Innate-like T-cell Program Was Identified in Cancer Immunity. Cancer Discov. 2022. OF1. Online Ahead of Print.
- Zou M, Su X, Wang L, et al. The molecular mechanism of multiple organ dysfunction and targeted intervention of COVID-19 based on time-order transcriptomic analysis. Front Immunol. 2021;12:729776.
- Dong K, Chen W, Pan X, et al. FCER1G positively relates to macrophage infiltration in clear cell renal cell carcinoma and contributes to unfavorable prognosis by regulating tumor immunity. BMC Cancer. 2022;22(1):140.
- Selin L, Duhan V, Hamdan TA, et al. NK cell–intrinsic FcϵRIγ limits CD8+ T-cell expansion and thereby turns an acute into a chronic viral infection. PLoS Pathog. 2019;15(6):e1007797.
- Fu L, Cheng Z, Dong F, et al. Enhanced expression of FCER1G predicts positive prognosis in multiple myeloma. J Cancer. 2020;11(5):1182–1194.
- Yang Q, Li K, Li X, et al. Identification of key genes and pathways in myeloma side population cells by bioinformatics analysis. Int J Med Sci. 2020;17(14):2063–2076.