
 ?Mathematical formulae have been encoded as MathML and are displayed in this HTML version using MathJax in order to improve their display. Uncheck the box to turn MathJax off. This feature requires Javascript. Click on a formula to zoom.
ABSTRACT
Objective:
Necroptosis has been reported to play an important role in different cancers, including leukemia. However, biomarkers of necroptosis-related genes (NRGs) that help predict the prognosis of AML are still lacking. Our research aims to build a novel signature of NRGs that could enhance our understanding of the molecular heterogeneity in leukemia.
Method:
Gene expression profiles as well as clinical features were downloaded from TCGA and GEO databases. Data analysis were executed using R software version 4.2.1 and GraphPad Prism version 9.0.0.
Result:
Univariate cox regression and lasso regression were applied to identify survival-specific genes. Four genes including FADD, PLA2G4A, PYCARD and ZBP1 were considered as independent risk factors that affect the prognosis of patients. Risk scores were calculated according to the coefficient of four genes. Then clinical characteristics and risk scores were enrolled to construct a nomogram. CellMiner was also used to screen potential drugs and analyze the correlations between genes and drug sensitivity.
Conclusion:
In general, we established a signature of four genes related to necroptosis that could be helpful for future risk stratification in patients with AML.
Introduction
Acute myeloid leukemia (AML) is an aggressive malignant disease with uncontrolled clonal expansion of myeloid blasts. The prognosis of AML is highly heterogeneous due to the molecular differences between patients [Citation1]. Although some novel drugs and regimens have improved therapeutic efficacy [Citation2], there are still many patients ultimately dying from primary or secondary resistance. Thus, establishing a prognostic model that includes molecular and genetic factors may help refine risk assessment and guide therapeutic decisions for AML patients.
Necroptosis is a newly identified type of programmed cell death that can be activated in the absence of apoptosis and triggered by the activation of death receptors [Citation3]. Emerging studies indicate that receptor-interacting protein kinases 1 and 3 (RIPK1 and RIPK3) and downstream substrate pseudokinase mixed-lineage kinase domain-like (MLKL) play a crucial role in regulating necroptosis pathway [Citation4]. The effects of necroptosis on cancer can be complex and paradoxical. On the one hand, many pivotal molecules in necroptotic signaling are downregulated in different types of cancer, such as breast cancer, colorectal cancer [Citation5,Citation6]. In this way, cancer cells may evade necroptosis and maintain proliferation. This suggests that necroptosis might help eliminate antiapoptotic tumor cells [Citation7]. On the other hand, an increasing number of studies have also shown that necroptosis can promote tumor progression and metastasis by inducing an inflammatory response and creating a tumor-promoting microenvironment with elevated ROS production [Citation8]. These changes in the tumor microenvironment can lead to genomic instability, ultimately accelerating malignant transformation [Citation9,Citation10].
The role of necroptosis in acute myeloid leukemia remains undefined. RIPK3 deletion transformed FLT3-ITD-driven myeloproliferation into AML in mice by increasing the accumulation of leukemia-initiating cells [Citation11]. A-L Nugues et al. proved RIPK3 expression is significantly decreased in CD34+ blast cells from AML patients than CD34+ hematopoietic cells from healthy donors [Citation12]. These studies demonstrated the antitumor role of the necroptosis pathway in AML. However, Xin et al found RIPK1/RIPK3 signaling was continuously activated in leukemia cells, suggesting that inhibiting RIP1/RIP3-mediated necroptotic signaling could be an alternative treatment strategy for AML patients [Citation13].
In this study, we constructed a 4 NRGs prognosis model using the TCGA cohort and validated it on the GEO datasets. This model could efficiently predict the prognosis of AML patients based on necroptosis-related genes.
Materials and methods
Data collection
Gene expression profiles and corresponding clinical data for 151 AML patients were downloaded from the TCGA database (https://portal.gdc.cancer.gov). Patients with a survival time of 0 days were excluded. The GSE71014 and GSE12417 datasets were obtained from the GEO database (https://www.ncbi.nlm.nih.gov/gds/). TCGA data were used as training set and GEO data as validation set. 159 necroptosis-related genes were collected from the Kyoto Encyclopedia of Genes and Genomes (KEGG) (https://www.kegg.jp/).
Construction and validation of the prognostic model
Univariate Cox regression analysis was performed to identify 38 candidate NRGs that were associated with OS in the TCGA LAML cohort. Genes with p-value <0.05 were further analyzed using Lasso regression (least absolute shrinkage and selector operation regression). Based on the regression coefficient (β), we calculate the risk score using the following equation: risk score = expression of gene 1* coefficient + expression of gene 2 * coefficient + expression of gene n * coefficient. Then, we classified AML patients into high-risk and low-risk groups based on the median risk scores. Kaplan–Meier survival analysis was used to compare the prognosis of these two groups. To evaluate the accuracy of this model, we calculated the area under the curve (AUC) at different time points. The calibration curve was used to assess the predictive discrimination of this risk model.
To test the predictive accuracy of risk model, we applied GSE71014 and GSE12417 as validation sets. Risk scores and AUC of each dataset were calculated in the same way as described above.
Predictive nomogram construction
Clinical parameters, including age, gender, percentage of blastcells, risk category, FAB category, leukocyte counts, hemoglobin, platelet counts and FLT3 mutation, NPM1 mutation, along with the risk score were gathered and analyzed by univariate and multivariate Cox proportional hazards regression. Due to the distinct clinical features of M3 subtype compared to other AML subtypes, patients with FAB classification were classified into M3 subtype and non-M3 subtype groups. Independent factors were selected to further construct a nomogram for predicting prognosis.
Enrichment analysis
We initially eliminated genes with low expression levels using a cut-off criterion for whose value was ‘0’ in over 50% of the samples. Subsequently, we identified differentially expressed genes (DEGs) with false discovery rate (FDR) < 0.05 and | log fold change (FC) | > 1 between the high-risk and low-risk groups. Furthermore, we conducted Gene Ontology (GO) analysis and Kyoto Encyclopedia of Genes and Genomes (KEGG) pathways analyses with DEGs.
Quantitative reverse transcription real-time PCR
We collected bone marrow specimens from AML patients (including de novo and relapsed patients) as well as healthy donors. More details can be seen in Supplementary Table 1 and Table 2. Protocol of sample handling was performed in compliance with the Helsinki Declaration. Total RNA was extracted with TRIzol reagent and reversely transcribed into cDNA with reverse transcription reagent(Takara Primescript RT Master Mix). Then, real-time PCR was performed with SYBR Premix Ex Taq (Takara). The relative expression levels of four genes were normalized to GAPDH and then calculated by 2−ΔΔCt. The primers of four genes were shown in Supplementary Table 3.
Drug sensitivity analysis
Drug sensitivity data were downloaded from CellMiner website (https://discover.nci.nih.gov/cellminer/home.do). Target gene expression and cell sensitivity data of FDA-approved drugs were analyzed by Pearson correlation analysis.
Statistical analysis
Data analyses were performed using the R software version 4.2.1.
Cox regression and LASSO analysis were performed with the ‘survival’ and ‘glmnet’ packages. The number of folds used in cross-validation was 10 in lasso regression. The area under the ROC curve (AUC) was calculated using the packages ‘timeROC’ and ‘survivalROC’ for OS prediction.‘rms’package was utilized for nomogram and calibration diagrams. DEGs were identified using the ‘limma’ package. Function enrichment analysis containing GO and KEGG was performed by ‘clusterprofiler’ R package.
Data visualizing and statistical analysis of real-time PCR results were performed using GraphPad Prism software. T-test and Wilcoxon test were applied for data processing.
Statistically significant were considered when p-value was less than 0.05.
Results
Construction and validation of prognostic model in AML
In total, we gathered 159 necroptosis-related genes and included 129 AML samples into the training set. We first performed a univariate Cox regression analysis for preliminary screening and identified 38 NRGs () with survival significance (p < 0.05).
Table 1. Overall survival-related NRGs in the AML patients (P < 0.05).
The lasso regression analysis was further performed to find out the crucial survival-related NRGs (). Four genes were finally chosen to establish an optimized prognostic signature. The risk score of this model was calculated as follows:
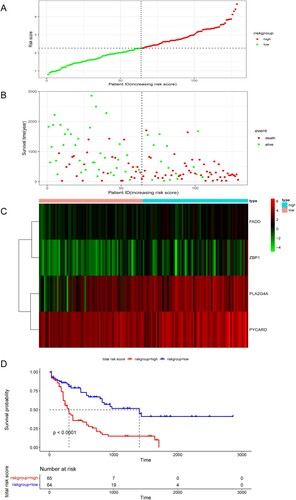
In total, 129 patients with AML were evenly categorized into low-risk and high-risk groups according to the risk score. Our analysis revealed a positive correlation between risk score and mortality rate, as demonstrated in (A,B). Additionally, the risk heatmap indicated differential gene expression between the two groups, as depicted in (C). The Kaplan-Meier survival curve further confirmed that patients in the high-risk group had significantly poorer overall survival rates compared to those in the low-risk group ((D)).
Figure 1. LASSO Cox regression performed to identify four necroptosis-related genes associated with OS.
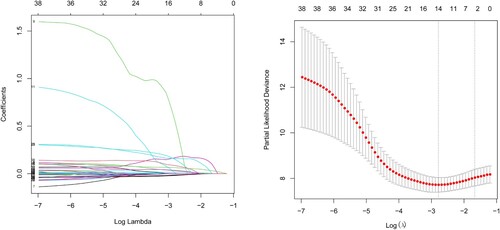
Figure 2. (A,B) Risk scores and survival status of AML patients. (C) Heatmap depicting the different expressions of the four NRGs in different AML cohorts. (D) Kaplan–Meier survival curve for the four gene signature.
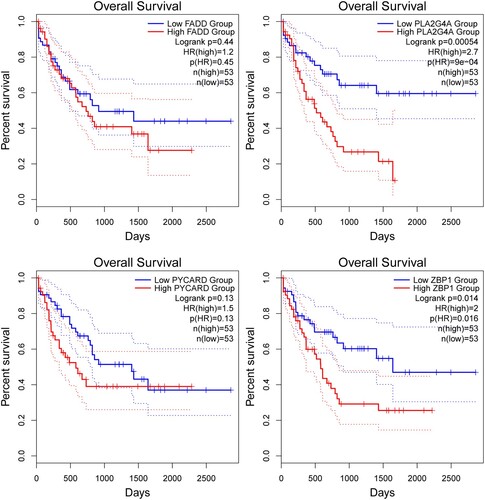
The expression profile of the four genes and their correlation with survival were examined in the TCGA LAML dataset using the GEPIA2 platform (gepia2.cancer-pku.cn) ().
Figure 3. The survival curve of each gene from GEPIA2 platform.
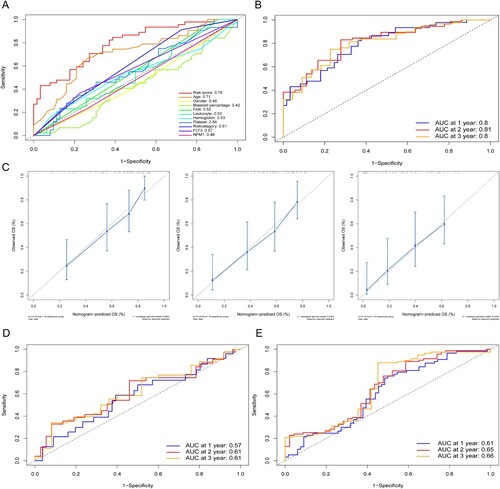
ROC curve of the OS was plotted to reveal the predictive performance of the risk score. Notably, the area under the curve (AUC) value of the risk score was significantly higher than that of other clinical parameters, including age, gender, blastcell percentage, FAB classification, leukocyte counts, hemoglobin, platelet counts, risk category, FLT3 mutation and NPM1 mutation ((A)). The AUC value of the risk score for the 1-, 2-, 3-year OS were 0.8,0.81 and 0.8 respectively ((B)). Additionally, the calibration line for risk score showed desirable prediction accuracy at 1, 2 and 3 years ((C)). To further substantiate the accuracy of our prognostic model, the GSE71014 and GSE12417 datasets were enrolled as validation sets. We calculate the risk score and AUC of each dataset ((D,E)).
Figure 4. (A) ROC analysis of OS for risk score and clinical parameters. (B) Time-dependent ROC curves of training set for 1-, 2-, and 3-year overall survival. (C) Calibration curve for the four gene signature at 1, 2, 3 years. Time-dependent ROC curves of GSE71014 (D) and GSE12417 (E) for 1-, 2-, and 3-year overall survival.
In the training cohort, we gathered clinical data on patients and conducted univariate and multivariate regression analysis. The results of the univariate regression revealed that survival time was associated with risk category, risk score, age and FAB classification ((A)). Subsequent multivariate analysis showed that age and risk score were independent risk factors ((B)).
Figure 5. Forest plots of the univariate (A) and multivariate (B) Cox regression analysis in AML.
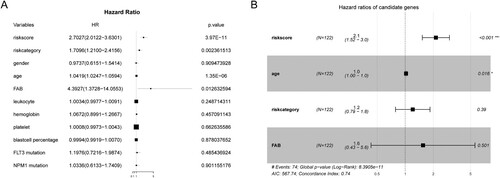
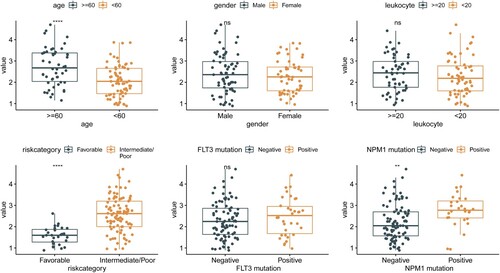
The Wilcoxon test was performed to explore the associations between the risk score and several clinical characteristics. Age, risk category, and NPM1 mutation were found to be related to the risk score ().
Figure 6. The correlation between risk score and clinical characteristics (age, gender, leukocyte, risk category, FLT3 mutation and NPMc mutation).
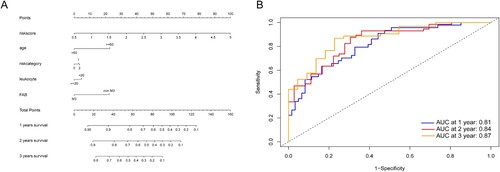
Based on the regression results above and our clinical experience, we constructed a nomogram to help make a more accurate prognostic analysis ((A)). Next, the time-dependent ROC of the nomogram was calculated, and the AUC values of 1-, 2- and 3-year OS were 0.81, 0.84, and 0.87, respectively ((B)).
Figure 7. (A) Nomogram predicting 1-, 2- and 3-year OS for the AML patients. Leukocyte: <20, counts less than 20 × 109/L; ≥20, counts equal to or more than 20 × 109/L, risk category: 0, Favorable; 1, Intermediate; 2, Poor. (B) Time-dependent ROC curves of the nomogram points for 1-, 2- and 3-year overall survival.
DEGs, GO and KEGG
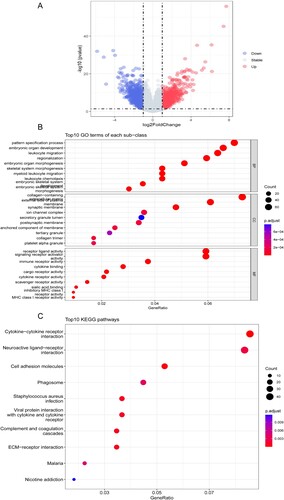
To further analyze the difference between the high-risk and low-risk subgroups, ‘limma’ packages were applied to screen the differentially expressed genes (DEGs) with false-discovery rate (FDR) < 0.05 and | log fold change (FC) | > 1. A total of 1880 DEGs were identified, with 829 upregulated and 1051 downregulated ((A)). The GO and the KEGG pathway enrichment analysis of 1880 DEGs were summarized in . In the GO enrichment analysis, the top enriched terms in biological processes, cell component and molecular function were pattern specification process, collagen-containing extracellular matrix and receptor-ligand activity respectively ((B)). In the KEGG enrichment analysis, the top enriched term was cytokine-cytokine receptor interaction ((C)).
Figure 8. Functional assays of DEGs between low and high risk groups. (A) The volcano plot of the differentially expressed genes. (B) The top 10 GO terms of BP, CC and MF. (C) The top 10 KEGG pathways.
Measuring gene expressions in AML patients by real-time PCR
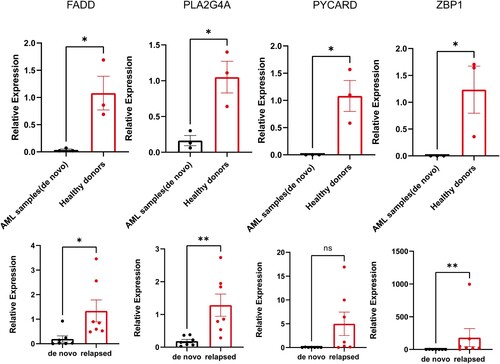
Real-Time PCR was performed to verify the mRNA expression levels of 4 genes in different cohorts. FADD, PLA2G4A, PYCARD and ZBP1 were downregulated in de novo AML patients compared to healthy donors ((A)). However, gene expression increased in the relapsed cohort ((B)). The results gave us a hint that these genes might be associated with disease recurrence. Larger sample sizes and more experiments are needed to verify the presumption.
Figure 9. The mRNA expression levels of 4 genes (FADD, PLA2G4A, PYCARD and ZBP1) in different donors. (A) de novo patients vs healthy donors and (B) de novo patients vs relapsed patients. Error bars are indicative of ±SEM, and threshold for significance was P < 0.05. *P < 0.05; **P < 0.01; ***P < 0.001; ****P < 0.0001.
Drug sensitivity analysis
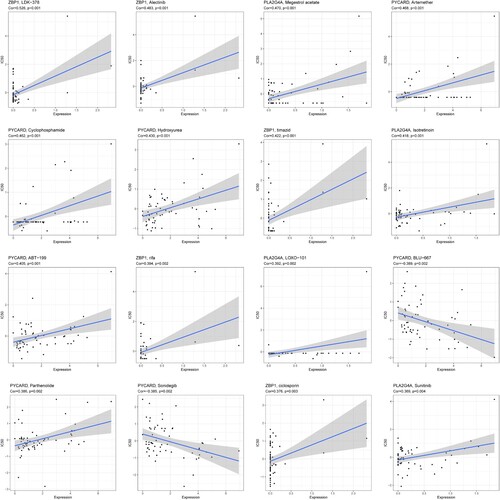
Potential correlations between the expression of four genes and drug sensitivity in different cancer cell lines were analyzed from CellMiner database. Results with P < 0.05 and |Cor|>0.3 were considered statistically significant. The top16 most relevant correlations were shown in . Positive correlations were found between 5 drugs (LDK-378, Alectinib, timazid, rifa and ciclosporin) and ZBP1. Similar results were identified for the relationship between PLA2G4A expression and Megestrol acetate, Isotretinoin, LOXO-101, Sunitinib. PYCARD expression was also positively associated withdrug sensitivity to Artemether, Cyclophosphamide, Hydroxyurea, ABT-199, and Parthenolide. In addition, there were negative correlations between two drugs (BLU-667, Sonidegib) and PYCARD.
Figure 10. Top16 most relevant correlations between the expression of 4 genes and drug sensitivity in different cancer cell lines from CellMiner database.
Discussion
Necroptosis is a caspase-independent form of programmed cell death mediated primarily by receptor-interacting protein kinase 1 and 3 (RIP1 and RIP3), as well as mixed lineage kinase domain-like protein (MLKL) [Citation14]. Emerging evidence suggests that necroptosis is involved in regulating different tumors. However, the exact role of necroptosis in neoplasms, including hematologic malignancies like AML, remains unknown. Ulrike Hockendorf demonstrated that RIPK3 signaling was crucial in the mechanism of leukemia suppression and exogenous activation of necroptosis could induce LIC cells and prompt differentiation in AML [Citation15]. On the contrary, Xin et al. showed that RIPK3 was highly expressed in the M4 and M5 subtypes of AML and illustrated that inhibition of the necroptotic pathway could be beneficial for certain patients with AML [Citation13]. Consequently, necroptosis is likely to be a double-edged sword in AML and requires further study.
In this study, 38 NRGs were found to be significantly associated with OS in patients with AML using univariate Cox regression. Further analysis by Lasso regression led to the selection of 4 NRGs to build a prognostic model. These genes have been reported to have an essential role in the development of various cancers.
The FADD gene is located on chromosome 11q13.3 and encodes a classical apoptotic signaling adapter-FADD protein. Amplification of FADD has been reported in many malignant tumors, such as breast cancer, lung cancer, skin cancer, and esophageal cancer [Citation16]. In some cancers, patients with FADD overexpression are prone to develop metastases, indicating a worse prognosis and poor overall survival [Citation17].
Phospholipase A2 (PLA2s) are key enzymes that catalyze the hydrolysis of membrane phospholipids at the position sn-2 to release second messenger lipids. There are three main classes of PLA2, including secretory (sPLA2), Ca2 + independent (iPLA2), and cytosolic PLA2 (cPLA2) [Citation18]. PLA2G4A belongs to cPLA2 which plays a fundamental role in inflammation and neoplasm. For example, researchers identified the growth dependency of AML cells on PLA2G4A by knocking out candidate genes with CRISPR/CAS9 [Citation19].
PYCARD encodes an adaptor protein that is composed of two protein–protein interaction domains: an N-terminal PYRIN-PAAD-DAPIN domain (PYD) and a C-terminal caspase-recruitment domain (CARD). The PYCARD protein was originally identified in HL-60 by forming large aggregates called speck cells after inducing apoptosis with retinoid acid and other drugs [Citation20]. Deswaerte et al. discovered that PYCARD was significantly upregulated in gastric cancer compared to normal gastric tissue [Citation21].
ZBP1 was previously identified as an IFN-inducible, tumor-associated protein [Citation22]. Baik JY et al. demonstrated that ZBP1 is a key mediator of tumor necroptosis, and that deletion of ZBP1 inhibits tumor metastasis in the MVT-1 breast cancer model [Citation23].
Our research presents a novel predictive model for acute myeloid leukemia (AML) that may enhance risk stratification beyond the current hierarchical prognostic models based on limited number of genes as outlined by the NCCN guidelines. Our model offers the potential to address the limitations and deficiencies of existing approaches to predict patient survival in AML.
While other studies have also developed NRGs models for AML [Citation24,Citation25], we took a different approach to identify prognostic-related genes. Specifically, we avoided obtaining white blood cell cohort from other databases due to potential bias and tendencies that may arise from differences between data sources, given that TCGA does not provide normal blood cells data. Several limitations must be acknowledged in our study. Firstly, although the WHO AML classification is widely used currently, the data from TCGA are based on the FAB classification. Secondly, the sample sizes of the training and validation sets were far from sufficient, indicating that larger datasets are needed to validate the performance and reliability of our predictive model. Thirdly, additional biological experiments and clinical trials are necessary to verify the accuracy and effectiveness of our nomogram.
In our study, we developed a new prognostic signature utilizing bioinformatics analysis to predict the prognosis of AML patients based on necroptosis-related genes. Although our model has shown promising results, further research is required to fully elucidate the underlying mechanisms of necroptosis in AML.
Ethical statement
The study was approved by the ethics committee of the participating institutions. Written informed consent was obtained from the patients.
Supplemental Material
Download PDF (67.9 KB)Authors' contribution
All authors contributed to the study conception and design. Weiyue Fang, Hongdou Lin and Junyi Chen collected and analyzed the data and wrote the manuscript. The first draft of the manuscript was written by Weiyue Fang. Wenjian Guo provided advice and reviewed the manuscript. All authors read and approved the final manuscript and agreed to the submission.
Disclosure statement
No potential conflict of interest was reported by the author(s).
Data availability statement
The datasets generated and/or analyzed during the current study are available in the online database TCGA (https://portal.gdc.cancer.gov/), GEO (http://www.ncbi.nlm.nih.gov/geo/) and CellMiner website (https://discover.nci.nih.gov/cellminer/home.do).
Additional information
Funding
References
- Valk PJ, Verhaak RG, Beijen MA, et al. Prognostically useful gene-expression profiles in acute myeloid leukemia. N Engl J Med. 2004;350(16):1617–1628. doi:10.1056/NEJMoa040465
- Konopleva M, Letai A. BCL-2 inhibition in AML: an unexpected bonus? Blood. 2018;132(10):1007–1012. doi:10.1182/blood-2018-03-828269
- Galluzzi L, Kepp O, Chan FK, et al. Necroptosis: mechanisms and relevance to disease. Annu Rev Pathol. 2017;12:103–130. doi:10.1146/annurev-pathol-052016-100247
- Grootjans S, Vanden Berghe T, Vandenabeele P. Initiation and execution mechanisms of necroptosis: an overview. Cell Death Differ. 2017;24(7):1184–1195. doi:10.1038/cdd.2017.65
- Koo GB, Morgan MJ, Lee DG, et al. Methylation-dependent loss of RIP3 expression in cancer represses programmed necrosis in response to chemotherapeutics. Cell Res. 2015;25(6):707–725. doi:10.1038/cr.2015.56
- Feng X, Song Q, Yu A, et al. Receptor-interacting protein kinase 3 is a predictor of survival and plays a tumor suppressive role in colorectal cancer. Neoplasma. 2015;62(4):592–601. doi:10.4149/neo_2015_071
- Gong Y, Fan Z, Luo G, et al. The role of necroptosis in cancer biology and therapy. Mol Cancer. 2019;18(1):100. doi:10.1186/s12943-019-1029-8
- Hsu SK, Chang T, Lin IL, et al. The role of necroptosis in ROS-mediated cancer therapies and its promising applications. Cancers (Basel). 2020;12(8):2185. doi:10.3390/cancers12082185
- Strilic B, Yang L, Albarran-Juarez J, et al. Tumour-cell-induced endothelial cell necroptosis via death receptor 6 promotes metastasis. Nature. 2016;536(7615):215–258. doi:10.1038/nature19076
- Seifert L, Werba G, Tiwari S, et al. The necrosome promotes pancreatic oncogenesis via CXCL1 and Mincle-induced immune suppression. Nature. 2016;532(7598):245–249. doi:10.1038/nature17403
- Hockendorf U, Yabal M, Herold T, et al. RIPK3 restricts myeloid leukemogenesis by promoting cell death and differentiation of leukemia initiating cells. Cancer Cell. 2016;30(1):75–91. doi:10.1016/j.ccell.2016.06.002
- Nugues AL, El Bouazzati H, Hetuin D, et al. RIP3 is downregulated in human myeloid leukemia cells and modulates apoptosis and caspase-mediated p65/RelA cleavage. Cell Death Dis. 2014;5:e1384. doi:10.1038/cddis.2014.347
- Xin J, You D, Breslin P, et al. Sensitizing acute myeloid leukemia cells to induced differentiation by inhibiting the RIP1/RIP3 pathway. Leukemia. 2017;31(5):1154–1165. doi:10.1038/leu.2016.287
- Degterev A, Hitomi J, Germscheid M, et al. Identification of RIP1 kinase as a specific cellular target of necrostatins. Nat Chem Biol. 2008;4(5):313–321. doi:10.1038/nchembio.83
- Hockendorf U, Yabal M, Jost PJ. RIPK3-dependent cell death and inflammasome activation in FLT3-ITD expressing LICs. Oncotarget. 2016;7(36):57483–4. doi:10.18632/oncotarget.11195
- Mouasni S, Tourneur L. FADD at the crossroads between cancer and inflammation. Trends Immunol. 2018;39(12):1036–1053. doi:10.1016/j.it.2018.10.005
- Chien HT, Cheng S D, Chuang WY, et al. Clinical implications of FADD gene amplification and protein overexpression in Taiwanese oral cavity squamous cell carcinomas. PLoS One. 2016;11(10):e0164870. doi:10.1371/journal.pone.0164870
- Nakanishi M, Rosenberg DW. Roles of cPLA2alpha and arachidonic acid in cancer. Biochim Biophys Acta. 2006;1761(11):1335–1343. doi:10.1016/j.bbalip.2006.09.005
- Hassan JJ, Lieske A, Dorpmund N, et al. A multiplex CRISPR-screen identifies PLA2G4A as prognostic marker and druggable target for HOXA9 and MEIS1 dependent AML. Int J Mol Sci. 2021;22(17):9411. doi:10.3390/ijms22179411
- Masumoto J, Taniguchi S, Ayukawa K, et al. ASC, a novel 22-kDa protein, aggregates during apoptosis of human promyelocytic leukemia HL-60 cells. J Biol Chem. 1999;274(48):33835–8. doi:10.1074/jbc.274.48.33835
- Deswaerte V, Nguyen P, West A, et al. Inflammasome adaptor ASC suppresses apoptosis of gastric cancer cells by an IL18-mediated inflammation-independent mechanism. Cancer Res. 2018;78(5):1293–1307. doi:10.1158/0008-5472.CAN-17-1887
- Kuriakose T, Kanneganti TD. ZBP1: innate sensor regulating cell death and inflammation. Trends Immunol. 2018;39(2):123–134. doi:10.1016/j.it.2017.11.002
- Baik JY, Liu Z, Jiao D, et al. ZBP1 not RIPK1 mediates tumor necroptosis in breast cancer [J]. Nat Commun. 2021;12(1):2666, doi:10.1038/s41467-021-23004-3
- Sun Y, Wang R, Xie S, et al. A novel identified necroptosis-related risk signature for prognosis prediction and immune infiltration indication in acute myeloid leukemia patients. Genes (Basel). 2022;13(10):1837. doi:10.3390/genes13101837
- Ma J, Jin Y, Gong B, et al. Pan-cancer analysis of necroptosis-related gene signature for the identification of prognosis and immune significance. Discov Oncol. 2022;13(1):17. doi:10.1007/s12672-022-00477-2