
ABSTRACT
Background:
BCL2-interacting protein 3 (BNIP3) expression varies among cancers, and its role in myeloma cells remains unknown. We investigated the role of BNIP3 overexpression in myeloma cells, and particularly its effects on apoptosis and mitochondria.
Methods:
A BNIP3-overexpressing plasmid was transfected into the MM.1S and RPMI8226 myeloma cell lines. Transfected cell apoptosis rate and mitochondrial function were determined via flow cytometry and western blotting. We verified the signaling pathway underlying myeloma cell sensitivity to bortezomib (BTZ).
Results:
Cell lines carrying the BNIP3-overexpressing plasmid exhibited higher rates of apoptosis and expression of Bax and Cleaved caspase 3 protein than the vector group, and less Bcl-2 protein expression than the control cells. Relative to the vector group, BNIP3-overexpressing strains contained more reactive oxygen species (ROS) and exhibited mitochondrial membrane potential (MMP) and dynamin-related protein 1 (Drp1) upregulation and mitofusin-1 (Mfn1) downregulation. BTZ supplementation increased BNIP3 expression. Relative to the BNIP3-OE group, the BNIP3-OE BTZ-treated group exhibited upregulated Bax and Cleaved caspase 3 protein expression, downregulated Bcl-2 protein expression, higher apoptosis rates, ROS levels, MMP, and Drp1 expression, and lower Mfn1 expression. BTZ treatment induced p38 MAPK (mitogen-activated protein kinase) signaling pathway activation in BNIP3-OE cells. Upon adding N-acetylcysteine (NAC) and the p38 MAPK inhibitor SB203580, the affected index levels returned to the baseline.
Conclusions:
BNIP3 overexpression induced apoptosis in myeloma cells and increased myeloma cell sensitivity to BTZ. These effects may be mediated by the ROS/p38 MAPK signaling pathway.
1. Introduction
Multiple myeloma (MM) is an incurable malignant neoplasm; it more common in older people, with two-thirds of the patients being over 65 at diagnosis [Citation1]. Although advances in the treatment of MM in the last decade have steadily improved outcomes, resistance to therapy is observed in some patients. The identification of meaningful biomarkers may lead to the development of appropriate personalized treatments for patients.
BCL2-interacting protein 3 (BNIP3), a member of the B-cell lymphoma 2 (BCL-2) family, localizes in the mitochondria and endoplasmic reticulum, where it regulates cell death, mitophagy, autophagy, and apoptosis [Citation2, Citation3]. Although BNIP3 is variably expressed in different types of tumors, it remains unknown whether BNIP3 participates in apoptosis of myeloma cells. Bortezomib (BTZ) was the first proteasome inhibitor approved for treating MM, based on its role in improving survival and response rates in patients with MM; however, these patients still face major clinical issues such as relapse and BTZ resistance [Citation4]. To address this, we focused on the role of BNIP3 in apoptosis in myeloma cells and BTZ-treated myeloma cells.
2. Methods
2.1. Cell culture and treatment
MM cell lines MM.1S and RPMI8226 were obtained from Cell Bank of the Chinese Academy of Sciences (Shanghai, China). Cells were incubated in Roswell Park Memorial Institute (RPMI) medium 1640 (Invitrogen, Carlsbad, CA, USA) supplemented with 10% fetal bovine serum (Gibco, Grand Island, NY, USA), containing with 1% penicillin – streptomycin (Gibco, Grand Island, NY, USA) in an incubator at 37 °C under 5% CO2. MM.1S and RPMI8226 cells were collected and plated into six-well plates (2 × 10⁶ cells/well). BNIP3-overexpressing (BNIP3-OE) cytomegalovirus (CMV) plasmid (pEnCMV-BNIP3-F, 5′-TACCGAGCTCGGATCCGCCACCATGTCGCAGAACGGAGCGCC-3′; pEnCMV-BNIP3-R, 5′-CGTATGGGTACTCGAGAAAGGTGCTGGTGGAGGTTG-3′) and an empty vector plasmid were synthesized by Xiamen Anti-hela Biological Technology Trade Co., Ltd (Xiamen, China).
MM.1S and RPMI8226 cells were transfected with 5 µg BNIP3-OE CMV plasmid and 5 µg empty vector plasmid. Cell transfection was performed using ExFect transfection reagent (T101-01; Vazyme, Nanjing, China) according to the manufacturer’s instructions. BTZ was then added to the cells, followed by culture for 40 h and for another 8 h. Following treatment, MM.1S and RPMI8226 cells were incubated for another 24 h after adding N-acetylcysteine (NAC, a mitochondria-specific antioxidant; 10 mM; Sigma Aldrich, St. Louis, MO, USA) or SB203580 (p38 MAPK-specific inhibitor; 10 μM; Dalian Meilun Biotechnology Company, Dalian, China).
2.2. RNA isolation and quantitative PCR
BNIP3 mRNA expression was assessed using reverse transcription quantitative PCR. Total RNA was isolated using an RNA Isolater kit (R401-01; Vazyme), then reverse-transcribed into cDNA using HiScript II Q RT SuperMix (R223-01, Vazyme). Amplification was performed using ChamQ SYBR qPCR Master Mix (Q311-01/02/03, Vazyme). DNA was amplified for 35 cycles: 3 min activation step, followed by 10 s at 95 °C, 6 s at 55 °C, and 14 s at 72 °C. The PCR primer sequences were 5′-CAGACACCACAAGATACC-3′ and 3′-ATCTTCCTCAGACTGTGA-5′ for BNIP3 and 5′-CGACGACCCATTCGAACGTCT-3′ and 3′-CTCTCCGGAATCGAA CCCTGA-5′ for β-actin. PCR cycle crossing-points were determined using the fit-points method. Data analysis was using the ΔΔCt method of Livak and Schmittgen[Citation5]. Each quantitative PCR analysis was repeated in three times and the averages were used. Gene expression was detected using an ABI 7500 real-time PCR system (Applied Biosystems, Foster City, CA, USA).
2.3. BTZ half-maximal inhibitory concentration (IC50) determination
Transfected cells (logarithmic growth phase) were harvested and seeded in four replicates into 96-well plates at a density of 3000 cells per well. Cells were treated with 0, 2.5, 5, 7.5, 10, 15, 20, 25, 30, 35, or 40 nM BTZ and incubated for 24 h at 37 °C. Cells were supplemented with MTT (20 μL) solution and cultivated at 37 °C under 5% CO2 for an additional 4 h. Absorbance at 490 nm was measured using a microplate reader (BioTek, Winooski, VT, USA). IC50 was calculated using GraphPad Prism 8.0.2 (GraphPad, Inc., San Diego, CA, USA).
2.4. Cell apoptosis assay
MM.1S and RPMI8226 cells were collected and seeded into six-well plates (2 × 10⁶ cells/well) then transfected with the BNIP3-OE or empty vector plasmid for 48 h. Drug intervention experiments were performed after transfection with the BNIP3-OE or empty vector plasmid for 40 h. MM.1S and RPMI8226 cells were treated with BTZ at IC50, and cell apoptosis rates were detected after 8 h incubation. Cells were incubated for another 24 h after adding 10 mM NAC or 10 μM SB203580. The cultured cells were harvested and collected via centrifugation, washed thrice with PBS, and resuspended in 100 μL staining buffer. Subsequently, 5 μL Annexin V-FITC and 5 µL propidium iodide were added to the cells, which were then maintained on ice for 15 min in the dark. Apoptosis rate was detected using a NovoCyte flow cytometer.
2.5. Analysis of mitochondrial membrane potential
Cells were transfected with the BNIP3-OE or empty vector plasmid for 48 h. BTZ intervention experiments were performed and transfected with plasmid for 40 h, and then treated with BTZ at IC50 for 8 h. Mitochondrial membrane potential (MMP) was assessed using JC-1 fluorochrome (40706ES60; Yeasen, Shanghai, China). Cells were washed thrice with PBS, then stained with JC-1 for 20 min, centrifuged and washed with JC-1 buffer solution. Subsequently, levels of green monomeric JC-1 and red aggregated JC-1 were detected using a NovoCyte flow cytometer at excitation and emission wavelengths of 530 and 590 nm, respectively.
2.6. Reactive oxygen species (ROS) measurement
Cells were treated as described above. Cells were incubated for another 24 h after adding 10 mM NAC or 10 μM SB203580. Cells were stained with 10 μM fluorescent probe by adding 2′,7′-dichlorodihydrofluorescein diacetate (DCFH-DA) (Molecular Probes, Eugene, OR, USA) and incubating at 37 °C in the dark for 20 min. Cells were washed and resuspended with phosphate-buffered saline (PBS). Intracellular ROS levels were assessed using a NovoCyte flow cytometer (ACEA Biosciences, Inc., San Diego, CA, USA).
2.7. Western blot analysis
Cells were treated as described above. Cells were harvested, washed with PBS, and lysed in radioimmunoprecipitation assay buffer containing phenylmethylsulfonyl fluoride (1 mM) on ice for 30 min. Total proteins were isolated using 10% sodium dodecyl sulfate-polyacrylamide gel electrophoresis (SDS-PAGE) then transferred onto polyvinylidene fluoride membranes (ISEQ00010; Merck Millipore Co., Darmstadt, Germany). The membranes were blocked in TBST with 5% skim milk powder for 2 h and incubated overnight at 4 °C separately with primary antibodies against BNIP3 (rabbit monoclonal; 1:2000; ab109362; Abcam, Cambridge, UK), Bcl-2 Associated X-protein (Bax) (rabbit polyclonal; 1: 5000; 50599-2-Ig; Proteintech, San Diego, CA, USA), Bcl-2 (rabbit polyclonal; 1:3000; 12789-1-AP; Proteintech), cleaved caspase-3 (rabbit polyclonal; 1:1500; 9661; Cell Signaling Technology, Danvers, MA, USA), mitofusin-1 (Mfn1) (rabbit polyclonal; 1:3000; 13798-1-AP; Proteintech), Mfn2 (rabbit polyclonal; 1:2000; 12186-1-AP; Proteintech), dynamin-related protein 1 (Drp1) (rabbit polyclonal; 1:3000; 12957-1-AP; Proteintech), and β-actin (rabbit polyclonal; 1: 4000; 20536-1-AP; Proteintech) in Tris buffer containing 5% skim milk powder. After washing with Tris-buffered saline containing 0.1% Tween 20 (TBST), membranes were incubated with a secondary antibody (goat anti-rabbit polyclonal antibody, 1:10,000; SA00001-2; Proteintech) conjugated to horseradish peroxidase at 37 °C for 1 h. Protein bands were developed using electrochemiluminescence (Beyotime, Shanghai, China). Bands were visualized using a FluorChem R detection system (ProteinSimple, San Jose, CA, USA) and quantified using Image Lab 3.0 (Bio-Rad Laboratories, Hercules, CA, USA). Western blot images were analyzed using ImageJ 2.0.0.
2.8. Statistical analysis
Statistical analyses were performed using SPSS 22.0 (SPSS, Inc., Chicago, IL, USA) and GraphPad Prism 8.0.2. Differences between groups were analyzed using t tests or paired t tests. Differences with P < 0.05 were considered statistically significant.
3. Results
3.1. Effect of BNIP3 overexpression on myeloma cell apoptosis
We used an overexpression plasmid to express BNIP3 protein in MM cell lines. Overexpression was confirmed using both qPCR (A) and western blot analyses (B, C), revealing increased BNIP3 mRNA and protein levels, respectively.
Figure 1. Effect of BNIP3 overexpression (OE) on apoptosis in MM.1S and RPMI8226 cells, (A) Quantitative PCR analysis of BNIP3 mRNA expression in MM.1S and RPMI8226 cells transfected with BNIP3-overexpressing plasmid. (B, C) Western blot analysis of BNIP3 protein expression in MM.1S and RPMI8226 cells transfected with BNIP3-overexpressing plasmid. (D) MTT analysis of BNIP3-OE MM.1S and RPMI8226 cells proliferation. (E, F) Flow cytometric analysis of BNIP3-OE MM.1S and RPMI8226 cells apoptosis rates. (G, H) Western blot analysis of apoptosis-related protein expression in BNIP3-OE MM.1S and RPMI8226 cells.*p < 0.05; **p < 0.01; ***p < 0.001.
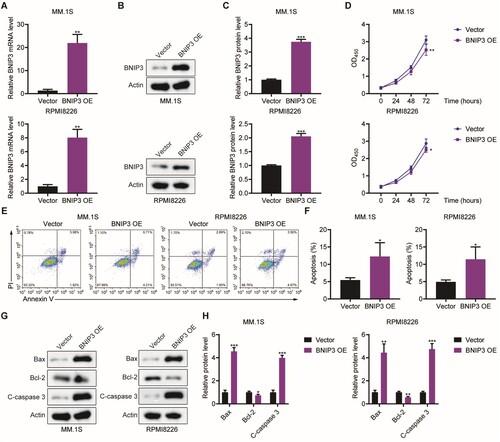
BNIP3 overexpression significantly inhibited MM.1S and RPMI8226 cells proliferation at 72 h (D). Flow cytometric analysis revealed a significantly higher apoptosis rate in the BNIP3-OE group than in the vector group (E, F). Similarly, the BNIP3-OE strains exhibited significantly elevated Bax and Cleaved caspase-3 expression and significantly reduced Bcl-2 expression (G, H) relative to the vector group. These results demonstrate that BNIP3 overexpression induces MM cell apoptosis.
3.2. Effect of BNIP3 overexpression on mitochondrional function
To examine changes in mitochondrial functional integrity following BNIP3 overexpression, we performed JC-1 staining to detected mitochondrial membrane potential (MMP) levels. Relative to the vector group, BNIP3 overexpression increased the quantity of JC-1 monomers (green fluorescence) and reduced that of JC-1 aggregates (red fluorescence), indicating mitochondrial damage in BNIP3-OE cells (A, B).
Figure 2. Effect of BNIP3 overexpression (OE) on mitochondrial function in MM.1S and RPMI8226 cells, (A, B) Flow cytometric analysis of BNIP3-OE MM.1S and RPMI8226 cells mitochondrial membrane potential (MMP) levels. (C, D) Flow cytometric analysis of BNIP3-OE MM.1S and RPMI8226 cells reactive oxygen species (ROS) levels. (E, F) Western blot analysis of BNIP3-OE MM.1S and RPMI8226 cells mitochondria-related protein expression. *p < 0.05; **p < 0.01; ***p < 0.001; ****p < 0.0001; ns, no significance.
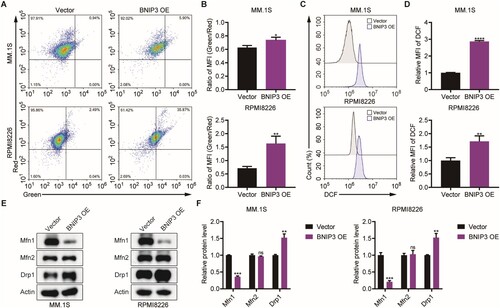
As mitochondrial dysfunction is due to oxidative stress, we investigated whether BNIP3 overexpression promotes ROS generation. Myeloma cells were stained with DCFH-DA. Representative images and mean fluorescence intensity values indicated that BNIP3 overexpression induced a significant increase in ROS levels relative to the vector group (C, D). Relative to the vector group, Drp1 expression was significantly higher in the BNIP3-OE group, while Mfn1 expression was significantly lower. Notably, Mfn2 levels were not impacted by BNIP3 overexpression (E, F). These results indicate that BNIP3 overexpression induces apoptosis and causes mitochondrial damage in myeloma cells.
3.3. BNIP3 overexpression interacts with BTZ during myeloma cell apoptosis
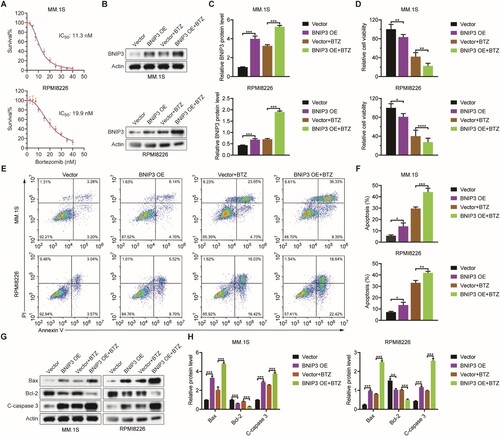
We measured MM.1S and RPMI8226 cells proliferation following BTZ treatment and determined the BTZ IC50 (A). After BTZ treatment, BNIP3 protein expression was significantly higher in the BTZ-treated BNIP3-OE group than in the BNIP3-OE (B, C). Relative to the vector group, BNIP3-OE cells exhibited lower viability, and significantly lower viability following BTZ treatment (D). BTZ-treated BNIP3-OE cells exhibited a significantly higher apoptosis rate than with BTZ-treated vector group (E, F). After BTZ treatment, Relative to the vector, Bax expression and Cleaved caspase 3 expression were higher in the BNIP3-OE group, whereas Bcl-2 expression was lower (G, H). These results indicate that BNIP3 overexpression enhances the effects of BTZ on apoptosis in myeloma cells.
Figure 3. Effect of BNIP3 overexpression (OE) on apoptosis in bortezomib (BTZ)-treated MM.1S and RPMI8226 cells, (A) BTZ half-maximal inhibitory concentration (IC50) in BNIP3-OE MM.1S and RPMI8226 cells. (B, C) Western blot analysis of BNIP3 protein expression in BTZ-treated MM.1S and RPMI8226 cells. (D) MTT analysis of BTZ-treated BNIP3-OE MM.1S and RPMI8226 cell viability. (E, F) Flow cytometric analysis of the apoptosis rate of BTZ-treated BNIP3-OE MM.1S and RPMI8226 cells. (G, H) Western blot analysis of apoptosis-related protein expression in BTZ-treated BNIP3-OE MM.1S and RPMI8226 cells. *p < 0.05; **p < 0.01; ***p < 0.001; ****p < 0.0001.
3.4. BNIP3 overexpression enhances mitochondrional sensitivity to BTZ
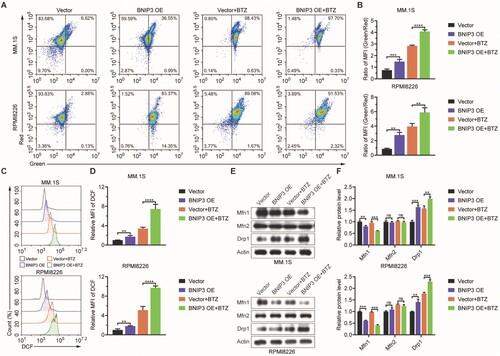
Next, we examined mitochondrial membrane potential (MMP) using an assay kit with JC-1, according to the manufacturer’s instructions. After BTZ-treatment, BNIP3-OE cells exhibited significantly fewer JC-1 aggregates (indicated by red fluorescence) and significantly more JC-1 monomers (green fluorescence) than the vector group (A). The MFI ratio (green: red fluorescence) was significantly higher with BTZ-treated BNIP3-OE group than in the BTZ-treated vector group (B). After BTZ treatment-, the BNIP3-OE group exhibited significantly higher ROS levels (C, D), significantly lower mfn1 levels, and elevated drp1 (E, F). These results indicate that BTZ treatment severely damaged the mitochondria in the BNIP3-OE group.
Figure 4. Effect of BNIP3 overexpression (OE) on mitochondrial function in bortezomib (BTZ)-treated MM.1S and RPMI8226 cells, (A, B) Flow cytometric analysis of mitochondrial membrane potential (MMP) levels in BTZ-treated BNIP3-OE MM.1S and RPMI8226 cells. (C, D) Flow cytometric analysis of reactive oxygen species (ROS) levels in BTZ-treated BNIP3-OE MM.1S and RPMI8226 cells. (E, F) Western blot analysis of mitochondrial-related protein in BTZ-treated BNIP3-OE MM.1S and RPMI8226 cells. **p < 0.01; ***p < 0.001; ****p < 0.0001; ns, no significance.
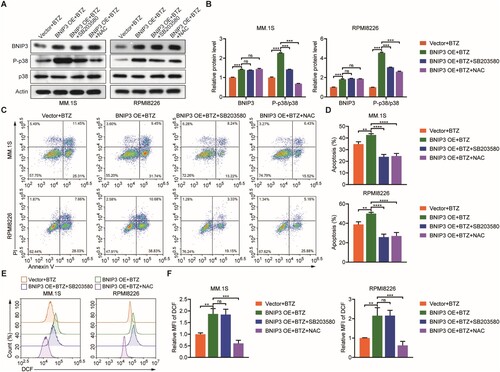
3.5. BNIP3 overexpression enhances BTZ sensitivity via the p38 MAPK pathway during myeloma cell apoptosis
To determine whether the p38 MAPK signaling pathway participates in BTZ-treated BNIP3-OE MM cell apoptosis, NAC and SB203580 were used. Adding NAC and SB203580 reversed the P-p38/p38MAPK protein levels in BTZ-treated BNIP3-OE MM cells (A, B), and the MM cell apoptosis rate returned to its baseline (C, D). NAC reduced ROS levels in BTZ-treated BNIP3-OE MM cells, whereas SB203580 did not affect ROS levels (E, F). These findings confirm that BNIP3 overexpression may enhance sensitivity to BTZ by promoting ROS accumulation and simultaneously activating the p38 MAPK signaling pathway during myeloma cell apoptosis.
Figure 5. Effect of BNIP3 overexpression (OE) on p38 MAPK-mediated apoptosis in bortezomib (BTZ)-treated MM.1S and RPMI8226 cells, (A, B) Western blot analysis of P-p38 MAPK protein expression in BNIP3-OE MM.1S and RPMI8226 cells treated with BTZ then SB203580 and N-acetylcysteine (NAC). (C, D) Flow cytometric analysis of apoptosis rate in BNIP3-OE MM.1S and RPMI8226 cells treated with BTZ then SB203580 and NAC. (E, F) Flow cytometric analysis of ROS levels in BNIP3-OE MM.1S and RPMI8226 cells treated with BTZ then SB203580 and NAC. **p < 0.01; ***p < 0.001; ****p < 0.0001; ns, no significance.
4. Discussion
BNIP3 is differentially expressed in various types of malignancies including in glioma and breast and prostate cancers; it is extensively expressed in various tumor cell types and participates in multiple mitochondrial and cellular functions including mitophagy and apoptosis [Citation6, Citation7]. Here, BNIP3 overexpression induced apoptosis in myeloma cells, based on analysis of the apoptosis rate and levels of apoptosis-related proteins.
The involvement of BNIP3 in cancer remains controversial. BNIP3 has been proposed as a tumor marker [Citation8, Citation9]. It is considered a potential target for preventing the rapid growth and metastasis of residual hepatocellular carcinoma after insufficient ablation by radiation therapy [Citation10]. BNIP3 remarkably reduces fat mass and obesity-associated breast cancer growth metastasis, retarding its growth [Citation11]. Loss of BNIP3-dependent mitophagy leads to an HIF1A-dependent increase in tumor growth, progression, and metastasis [Citation12].
Tumor cell growth is dynamically modulated by changes in the mitochondrial mass and fusion [Citation12, Citation13]. Here, in BNIP3-OE cell lines, ROS levels and mitochondrial membrane potential were elevated and multiple proteins were differentially regulated. Drp1, thought to promote mitochondrial fission, was upregulated in BNIP3-OE strains, whereas Mfn1, which slows mitochondrial fusion activity, was downregulated. Mfn1 prevents apoptosis in cardiomyocytes and human prostate cancer cells [Citation14, Citation15]. It is indispensable for the anti-hepatocellular carcinoma effect of programmed cell death, and treatment with a mitochondrial calcium efflux inhibitor prevented Mfn1-induced apoptosis [Citation16]. DRP1-based mitochondrial fragmentation reduces mitochondrial ROS levels and promotes chemoresistance in acute leukemia cells [Citation17].
Mitochondria are important for maintaining cell homeostasis. Mitochondrial fragmentation coincides with increased production of ROS, which are potent drivers of cancer [Citation18]. ROS are produced in the mitochondria, endoplasmic reticulum, and peroxisomes via enzymatic and non-enzymatic mechanisms. Tumor cells exhibit increased ROS levels relative to those in healthy cells; these effects are thought to be driven by changes in cellular metabolism and signaling. ROS-mediated oxidative stress damages macromolecules, negatively affecting their functions. ROS concentrations in cancer cells depend on ROS inducers and scavengers to promote cell proliferation and metastasis [Citation19]. Excessive ROS levels induce genetic instability and promote cancer cell death.
Here, following BNIP3-OE, ROS levels were increased to those observed in myeloma cells during ROS-induced apoptosis [Citation20]. The unfolded protein response in the endoplasmic reticulum, which is induced by ROS accumulation, may be enhanced by BTZ [Citation21]. Here, BTZ increased myeloma cell apoptosis in the BNIP3-OE group relative to the vector group. These results indicate that BNIP3 overexpression increases myeloma cell sensitivity to BTZ. BNIP3 participates in chemosensitivity and chemoresistance in various solid tumors, including hepatocellular carcinoma, triple-negative breast cancer, ovarian cancer, and prostate cancer [Citation18, Citation22, Citation23]. Targeting BNIP3 is a potential approach for restoring cisplatin sensitivity [Citation22]. Based on these results, BNIP3 expression may precede resistance to chemotherapy or enhance disease progression.
MAPK signaling is critical for ROS-induced apoptosis [Citation24, Citation25]. In eukaryotic cells, it affects gene expression and processes including proliferation, differentiation, apoptosis, and stress responses. Many diseases can be treated by targeting extracellular signal-regulated kinase, c-Jun N-terminal kinase, and p38 pathways [Citation26]. In breast cancer cells, arctigenin induces apoptosis via the ROS/p38 MAPK pathway, which promotes Bcl-2 expression via histone H3K9 trimethylation [Citation27].
Enhanced ROS levels may enhance phospho-p38 levels. Inhibiting or knocking out p38 MAPK may cause tumor cells to become more drug-resistant and promote tumor cell apoptosis. Therefore, increased ROS may activate the p38 MAPK signaling pathway. Our findings suggest that the p38 MAPK signaling pathway participates in BNIP3 overexpression and myeloma cell apoptosis [Citation28].
In our study, we find that P-p38 MAPK protein expression was upregulated in BTZ-treated BNIP3-OE MM cells, and the elevated cell apoptosis rate returned to its baseline after addition of an ROS cleaver (N-acetylcysteine) and a p38 MAPK inhibitor (SB203580). We concluded that BNIP3 overexpression may enhance myeloma cell sensitivity to BTZ via the ROS/p38 MAPK signaling pathway.
Our study has some limitations. First, we were unable to establish a BNIP3 knockdown or knockout model to verify the results. Second, we did not use clinical samples to verify the conclusions. Nonetheless, we anticipate that our study design was effective.
5. Conclusions
BNIP3 overexpression may promote apoptosis in myeloma cells by enhancing myeloma cell sensitivity to BTZ. This synergistic effect may be mediated by the ROS/p38 MAPK signaling pathway.
Author contributions
Conceptualization, P.X.; Investigation, X.C., Z.D., W.F., Y.C., J.S., Q.W., and L.M.; Writing, P.X. The manuscript has been reviewed by all of the authors.
Disclosure statement
No potential conflict of interest was reported by the author(s).
Additional information
Funding
References
- Toppila I, Kysenius K, Miettinen T, et al. Comorbidity characteristics of multiple myeloma patients diagnosed in Finland 2005–2016. Ann Hematol. 2022;101(11):2485–2495. PMID:PMC9546994. doi:10.1007/s00277-022-04959-9
- Pinto V, Bergantim R, Caires HR, et al. Multiple myeloma: available therapies and causes of drug resistance. Cancers (Basel). 2020;12(2):PMID:PMC7072128. doi:10.3390/cancers12020407
- Mogollon P, Diaz-Tejedor A, Algarin EM, et al. Biological background of resistance to current standards of care in multiple myeloma. Cells. 2019;8(11):PMID:PMC6912619. doi:10.3390/cells8111432
- Viziteu E, Klein B, Basbous J, et al. RECQ1 helicase is involved in replication stress survival and drug resistance in multiple myeloma. Leukemia. 2017;31(10):2104–2113. PMID:PMC5629372. doi:10.1038/leu.2017.54
- Livak KJ, Schmittgen TD. Analysis of relative gene expression data using real-time quantitative PCR and the 2−ΔΔCT method. Methods. 2001;25(4):402–408. doi:10.1006/meth.2001.1262
- Jin Q, Li R, Hu N, et al. DUSP1 alleviates cardiac ischemia/reperfusion injury by suppressing the Mff-required mitochondrial fission and Bnip3-related mitophagy via the JNK pathways. Redox Biol. 2018: 576–587. PMID:PMC5691221. doi:10.1016/j.redox.2017.11.004
- Yuan C, Pu L, He Z, et al. BNIP3/Bcl-2-mediated apoptosis induced by cyclic tensile stretch in human cartilage endplate-derived stem cells. Exp Ther Med. 2017;15(1):235–241. PMID:PMC5763692. doi:10.3892/etm.2017.5372
- Macher-Goeppinger S, Keith M, Hatiboglu G, et al. Expression and functional characterization of the BNIP3 protein in renal cell carcinomas. Transl Oncol. 2017;10(6):869–875. PMID:PMC5602480. doi:10.1016/j.tranon.2017.08.008
- Chourasia AH, Tracy K, Frankenberger C, et al. Mitophagy defects arising from BNip3 loss promote mammary tumor progression to metastasis. EMBO Rep. 2015;16(9):1145–1163. PMID:PMC4576983. doi:10.15252/embr.201540759
- Xu WL, Wang SH, Sun WB, et al. Insufficient radiofrequency ablation-induced autophagy contributes to the rapid progression of residual hepatocellular carcinoma through the HIF-1α/BNIP3 signaling pathway. BMB Rep. 2019;52(4):277–282. PMID:PMC6507849. doi:10.5483/BMBRep.2019.52.4.263
- Niu Y, Lin Z, Wan A, et al. RNA N6-methyladenosine demethylase FTO promotes breast tumor progression through inhibiting BNIP3. Mol Cancer. 2019;18(1):46. PMID:PMC6437932. doi:10.1186/s12943-019-1004-4
- Chourasia AH, Macleod KF. Tumor suppressor functions of BNIP3 and mitophagy. Autophagy. 2015;11(10):1937–1938. PMID:PMC4824596. doi:10.1080/15548627.2015.1085136
- Blanquer-Rossello MM, Santandreu FM, Oliver J, et al. Leptin modulates mitochondrial function, dynamics and biogenesis in MCF-7 cells. J Cell Biochem. 2015;116(9):2039–2048. doi:10.1002/jcb.25158
- Li J, Li Y, Jiao J, et al. Mitofusin 1 is negatively regulated by microRNA 140 in cardiomyocyte apoptosis. Mol Cell Biol (2014) 34(10):1788-1799. PMID:PMC4019028 doi:10.1128/MCB.00774-13
- Choudhary V, Kaddour-Djebbar I, Alaisami R, et al. Mitofusin 1 degradation is induced by a disruptor of mitochondrial calcium homeostasis, CGP37157: a role in apoptosis in prostate cancer cells. Int J Oncol. 2014;44(5):1767–1773. doi:10.3892/ijo.2014.2343
- Yu CL, Lee HL, Yang SF, et al. Protodioscin induces mitochondrial apoptosis of human hepatocellular carcinoma cells through eliciting ER stress-mediated IP3R targeting Mfn1/Bak expression.J Hepatocell Carcinoma. 2022: 327–341. PMID:PMC9049873. doi:10.2147/JHC.S355027
- Cai J, Wang J, Huang Y, et al. ERK/Drp1-dependent mitochondrial fission is involved in the MSC-induced drug resistance of T-cell acute lymphoblastic leukemia cells. Cell Death Dis. 2016;7(11):e2459. PMID:PMC5260898. doi:10.1038/cddis.2016.370
- Chung LY, Tang SJ, Wu YC, et al. Platinum-based combination chemotherapy triggers cancer cell death through induction of BNIP3 and ROS, but not autophagy. J Cell Mol Med. 2020;24(2):1993–2003. PMID:PMC6991685. doi:10.1111/jcmm.14898
- Renaudin X. International review of cell and molecular biology. Int Rev Cell Mol Biol. 2021: 139–161. doi:10.1016/bs.ircmb.2021.04.001
- Caillot M, Zylbersztejn F, Maitre E, et al. ROS overproduction sensitises myeloma cells to bortezomib-induced apoptosis and alleviates tumour microenvironment-mediated cell resistance. Cells. 2020;9(11):PMID:PMC7693395. doi:10.3390/cells9112357
- Yin L, Kufe T, Avigan D, et al. Targeting MUC1-C is synergistic with bortezomib in downregulating TIGAR and inducing ROS-mediated myeloma cell death. Blood. 2014;123(19):2997–3006. PMID:PMC4014842. doi:10.1182/blood-2013-11-539395
- Jia J, Yang X, Zhao Q, et al. BNIP3 contributes to cisplatin-induced apoptosis in ovarian cancer cells. FEBS Open Bio. 2020;10(8):1463–1473. PMID:PMC7396446. doi:10.1002/2211-5463.12881
- Nollet EA, Cardo-Vila M, Ganguly SS, et al. Androgen receptor-induced integrin α6β1 and Bnip3 promote survival and resistance to PI3K inhibitors in castration-resistant prostate cancer. Oncogene. 2020;39(31):5390–5404. PMID:PMC7395876. doi:10.1038/s41388-020-1370-9
- Martinez MA, Ubeda A, Trillo MA. Role of NADPH oxidase in MAPK signaling activation by a 50 Hz magnetic field in human neuroblastoma cells. Electromagn Biol Med. 2021;40(1):103–116. doi:10.1080/15368378.2020.1851250
- Cao X, Fu M, Bi R, et al. Cadmium induced BEAS-2B cells apoptosis and mitochondria damage via MAPK signaling pathway. Chemosphere. 2021: 128346. doi:10.1016/j.chemosphere.2020.128346
- Sun J, Nan G. The mitogen-activated protein kinase (MAPK) signaling pathway as a discovery target in stroke. J Mol Neurosci. 2016;59(1):90–98. doi:10.1007/s12031-016-0717-8
- Hsieh CJ, Kuo PL, Hsu YC, et al. Arctigenin, a dietary phytoestrogen, induces apoptosis of estrogen receptor-negative breast cancer cells through the ROS/p38 MAPK pathway and epigenetic regulation. Free Radical Biol Med. 2014: 159–170. doi:10.1016/j.freeradbiomed.2013.10.004
- Huang C, Zhou T, Ma L, et al. IFI6 downregulation reverses oxaliplatin resistance of colorectal cancer cells by activating the ROS-induced p38MAPK signaling pathway. Biol Pharm Bull. 2023;46(1):26–34. doi:10.1248/bpb.b22-00439.