
 ?Mathematical formulae have been encoded as MathML and are displayed in this HTML version using MathJax in order to improve their display. Uncheck the box to turn MathJax off. This feature requires Javascript. Click on a formula to zoom.
Abstract
Background
This study aimed to investigate the potential of a NAD+ metabolism-related lncRNA signature as a reliable prognostic biomarker for acute myeloid leukemia (AML).
Methods
Transcriptome profiles and clinical data of AML patients were obtained from The Cancer Genome Atlas (TCGA) database. NAD+ metabolism-related genes (NMRGs) were identified from the KEGG and Reactome databases. Coexpression analysis was used to screen NAD+ metabolism-related lncRNAs. The NAD+ metabolismrelated lncRNA signature was constructed using univariate analysis, LASSO regression, and multivariate analysis. High- and low-risk groups were compared for survival, tumor mutation burden, immune cell infiltration, and response to immunotherapy. Enrichment analysis explored the biological functions.
Results
LINC01679, AC079922.2, TRAF3IP2-AS1, and LINC02465 were identified to construct the risk model. The model exhibited good predictive power and outperformed age and gender as an independent prognostic marker. High-risk patients showed poorer survival, distinct TP53 mutations, and altered immune cell infiltration compared to low-risk patients. Additionally, low-risk patients exhibited greater sensitivity to immunotherapy. Enriched biological functions included leukocyte migration and positive regulation of cytokine production.
Conclusions
The NAD+ metabolism-related lncRNA signature shows promise in predicting clinical outcomes for AML patients.
1. Introduction
Acute myeloid leukemia (AML), the most common form of acute leukemia, is usually accompanied by a high mortality rate [Citation1]. Currently, ELN risk classification based on cytogenetic signatures and molecular aberrations is deemed to be the essential tool guiding the treatment of AML. However, substantial studies and clinical practices have found that standard therapy failed to achieve long-term complete remission, and multiple combinations of chemotherapy regimens have not shown significant effects, especially for relapsed or refractory AML [Citation2]. Patients mostly have a difficult prognosis, with an unstable and low survival rate, a less than 30% 5-year survival rate, and only an approximately 20% 2-year overall survival (OS) rate in older patients [Citation3, Citation4]. In addition, due to the complex etiology and pathogenesis of AML, drug resistance, off-target effects, and other influential factors, the prognosis of patients in the same stratification remains highly variable [Citation5, Citation6]. Accurate stratification to guide treatment is an imperative way to improve the prognosis of patients. This is exemplified by continuously updated ELN prognostic stratification for AML patients. It is well known that the onset, progression, and relapse of AML are all very complicated processes. Other factors in addition to the currently identified cytomolecular genetic abnormalities can also affect prognosis simultaneously. Therefore, ongoing explorations of prognostic markers to continuously improve prognostic stratification are essential to guide treatment and improve prognosis.
Several studies have highlighted the essential role of metabolic reprogramming in tumorigenesis and resistance [Citation7, Citation8]. NAD+, a vital coenzyme/substrate in various reduction–oxidation (redox) reactions, is a major regulator and core of cellular energy metabolism [Citation9]. Studies have shown that NAD+ reinforces anaerobic glycolysis via 3-phosphoglycerate dehydrogenase (GAPDH) and lactate dehydrogenase (LDH), thereby stimulating cancer cell growth. An increased ratio of NAD+/NADH and NADP+/NADPH was found in most cells [Citation10]. Increased activity of NAD + -dependent TCA cycle enzymes and increased fatty acid, glucose, and amino acid metabolism have been found in LSCs, especially at relapse [Citation11]. Aside from involvement in energy metabolism, NAD+ regulates multiple cellular activities, such as DNA repair, immune responses and homeostasis, posttranslational modifications, genome stability, cell growth, and apoptosis [Citation12–15]. Nevertheless, the connection between NAD+ metabolism and AML prognosis is relatively unclear. In recent decades, sequencing technology has been widely used, and the cost of this technology has decreased. A growing number of studies have yielded unique insights into the prognostic monitoring and treatment of AML. To date, it has been revealed that a vast number of long noncoding RNAs (lncRNAs) can regulate gene expression through multiple cellular processes, including transcription, translation, and protein modification. Notably, some lncRNAs have been shown to be primary regulators of gene expression and play critical roles in tumour progression. Alterations in lncRNA expression can manifest tumour suppressive and tumorigenesis functions. However, studies dedicated to the large-scale exploration of NAD+ metabolism-related lncRNAs and the prognosis of AML patients remain unreported. This report identified NAD+ metabolism-related lncRNAs significantly related to AML prognosis. We constructed a prognostic model and a nomogram to predict the survival probability of AML patients by analysing data from the TCGA database.
2. Materials and methods
2.1. Data collection and screening of NAD + metabolism-related lncRNAs
The RNA sequencing (RNAseq) profile and corresponding clinical information of AML samples were collected from the TCGA database in the GDC Data Portal (https://portal.gdc.cancer.gov/) and UCSC Xena (https://xenabrowser.net/datapages/) and then systematically compiled for subsequent analysis. GTF profiles, the annotations for lncRNAs, were obtained from the Ensembl website (http://asia.ensembl.org). NAD + metabolism-related genes (NMRGs) were extracted from the KEGG database (Pathway: hsa00760) and the Reactome database (R-HSA-196807) [Citation16]. Subsequently, we performed coexpression analysis to screen for NAD + metabolism-related lncRNAs (correlation coefficients > 0.5, p < 0.001) based on the ‘limma’ package of R.
2.2. Establishment and validation of the prognostic model
The NAD + metabolism-related lncRNAs significantly associated with AML prognosis were screened by univariate Cox analysis. To eliminate overfitting, variables with p < 0.001 were subsequently enrolled in the least absolute shrinkage and selection operator (LASSO) Cox regression. Then, the best and smallest penalty criteria (λ) were selected by 10-fold cross-validation. After that, the optimisation of LASSO results was performed by multivariate regression analysis, and the optimal NAD + metabolism-related lncRNA weighting coefficients were obtained to construct the risk score formula. The risk score was calculated based on the following formula:
In this equation, Coef represents the regression analysis coefficient calculated from the multivariate Cox analysis, and xi represents the expression level of each NAD + metabolism-related lncRNA. The above analysis was implemented via the R packages ‘survival’ and ‘glmnet.’ TCGA AML samples were randomly assigned to the test and training cohorts with the R package ‘caret.’ The samples were then allocated into the HR and LR cohorts based on the median value of the risk score in the test and training cohorts, respectively. Kaplan–Meier (K-M) analysis was performed in these two cohorts by the ‘survival’ R package, and the survival differences were compared by log-rank statistical methods. In addition, principal component analysis (PCA) was applied to evaluate the clustering of the samples. Moreover, we compared the predictive capability between risk score models and clinical characteristics by the C-index. The 1-,2-, and 3-year receiver operator characteristic (ROC) curves were plotted by the ‘survival,’ ‘survminer,’ and ‘time-ROC’ packages in R to assess the predictability of the model.
2.3. Construction of the nomogram
Clinical characteristics extracted from AML patients along with the risk score were used to perform univariate and multivariate Cox regression analyses. Variables with p < 0.05 considered independent prognostic factors for AML were employed to construct Nomo plots. Calibration curves for 1, 2, and 3 years were utilised to discriminate and forecast the value of the nomogram.
2.4. Functional and pathway enrichment analysis
The differentially expressed genes (DEGs) between the HR and LR subgroups from TCGA-LAML samples were filtered using the ‘limma’ package based on R software. The screening threshold values were set as FDR value < 0.05 and |log2-fold change (FC)| ≥ 1. Gene Ontology (GO) enrichment and Kyoto Encyclopedia of Genes and Genomes (KEGG) pathway analyses were performed to investigate the underlying biological functions and regulatory pathways involved in DEGs. The R package ‘clusterProfiler’ was employed to identify the biological attributes of common DEGs. The circle, bubble, and bar charts show the analysis results.
2.5. Analysis of mutation and TMB
TMB is represented by the number of variations per megabyte (Mut/Mb) in the sequenced DNA, which includes nonsense variants, missense variants, deletions, splice sites, and insertions. A high tumour mutation load (TMB) implies that the higher the number of mutations in a sample, the more chances of generating tumour-specific neoantigens that are more likely to be immunogenic and trigger an immune response in the body, and TMB is now known as a sensitive biomarker for immunotherapy [Citation17]. We visualised the difference in gene mutations between the HR and LR subgroups to reveal the relationship between them and compared the impact of risk score and TMB on survival.
2.6. Immune correlation assessment
It is believed that cells in the tumour microenvironment, especially immune cells, can have a crucial effect on the outcome [Citation18]. Given the above notion, the differential prognosis between different risk subgroups may result from the immune cell component. We compared the differences in immune-related function between the HR and LR subgroups by a single sample gene set enrichment analysis (ssGSEA) algorithm using the R package ‘GSVA.’ To further investigate the relationship between the risk score and tumour microenvironment (TME), we first compared the differences in immune scores and stromal scores between the HR and LR subgroups by the ESTIMATE algorithm. Then, the correlation of the risk score with immune cell distribution and immune checkpoint genes was analysed by R software and related packages.
2.7. Drug sensitivity analysis
Immune escape is a requirement for tumour survival and development. In recent years, immunotherapy has emerged as a research hotspot. Tumour immune dysfunction and exclusion (TIDE) represents the patient’s response to immunotherapy. The higher the TIDE score, the greater the likelihood of immune escape and the poorer the response of the organism to immunotherapy. Simultaneously, to compare the differences in sensitivity to therapeutic drugs between patients in the HR and LR subgroups, we calculated the semi-inhibitory concentration (IC50) values of commonly used drugs by the ‘pRRophetic’ R package.
2.8. Statistical analysis
In this study, all analyses were conducted in R software (version 4.1). We used a log-rank test to examine the significant difference in OS between subgroups and then the area under the ROC curve (AUC) to indicate prognostic accuracy. Unless stated otherwise, p ≤ 0.05 was considered statistically significant, and Student’s t test was utilised to perform statistical comparisons.
3. Results
3.1. Construction of the NAD + metabolism-related lncRNA signature
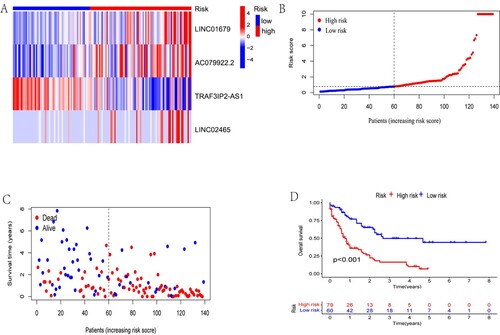
A schematic of our study design is portrayed in . Fifty-one NMRG sets were initially collected [Citation19], which are displayed in Table S1. Then, using coexpression analysis between the NMRG and lncRNA sets, we eventually identified 1510 lncRNAs as NAD + metabolism-related lncRNAs (Figure S1). Following univariate Cox regression, six NAD + metabolism-related lncRNAs strongly associated with OS (p < 0.001) were formally included in the LASSO regression and multivariate Cox analysis to construct a prognostic NAD + metabolism-related lncRNA signature. The results are presented in the form of forest maps, cross-validation, and regression plots in . Subsequently, four NAD + metabolism-related lncRNAs (LINC01679, AC079922.2, TRAF3IP2-AS1, and LINC02465) were finally screened to establish a prognostic model. In additon, the heatmap of the correlation between these four lncRNAs and NMRGs is shown in Figure S2. Finally, the process of RS calculation is presented as the following formula. Risk score = (1.25700842423413 × LINC01679 level) + (0.602190480606488×AC079922.2 level) – (1.04588769908068×TRAF3IP2-AS1 level) + (1.24155065223538×LINC02465 level). Simultaneously, the TCGA AML samples were randomly assigned into training and test cohorts with no difference in baseline characteristics and continued to be grouped into HR and LR groups according to median risk scores (Table S2). To investigate the effect of the risk score on survival, we performed the Kaplan–Meier analysis between the HR and LR groups, which showed a significant survival difference between the two groups. The HR group had a significantly worse OS in all cohorts (). The same results were found in the test and training cohorts (Figure S3).
Figure 1. Flow chart of the study design. NMRGs, NAD+ metabolism-related genes; ROC, Receptor operating characteristic; PCA, Principal component analysis; HR, high risk; LR, low risk; DEGs, differentially expressed genes.
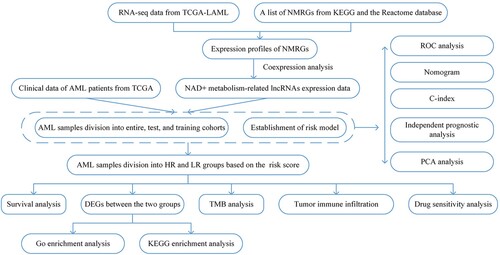
Figure 2. Univariate Cox regression and LASSO regression analysis. (A) Forest map showing the 6 NAD+ metabolism-related lncRNAs associated with prognosis obtained by univariate regression analysis. (B) Lasso regression plots and (C) cross-validation plots.
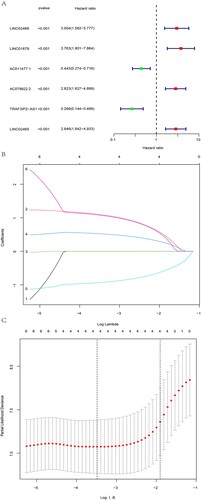
Figure 3. Investigating the effect of risk score on survival in entire cohorts. (A)The expression of LINC01679, AC079922.2, TRAF3IP2-AS1 and LINC02465 in the entire cohort was visualised by heatmap. (B and C) The results showed the difference in the distribution of patients with different risk scores and survival statuses. (D) Kaplan–Meier analysis between the HR and LR groups. The HR group had a significantly worse OS in all cohorts.
3.2. Assessment of the prognostic power of the risk model
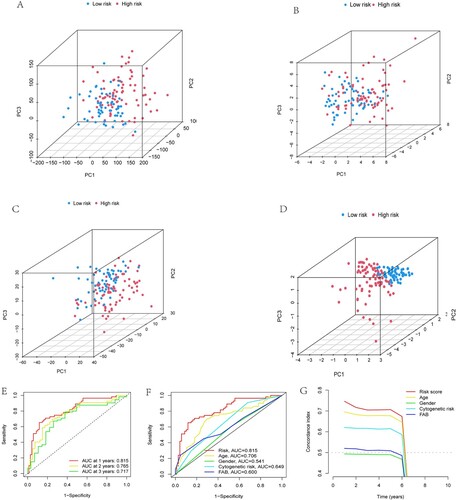
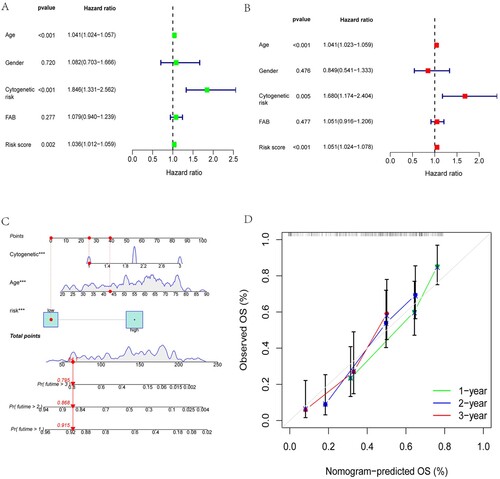
We then obtained the results of PCA and found that the NAD + metabolism-related lncRNA signature was more advantageous than other transcriptomic signatures in distinguishing patients with different risk scores (A- D). In addition, ROC curves were applied to assess the sensitivity and specificity of the NAD + metabolism-related lncRNA signature. The results showed that the AUC values for 1-, 2- and 3-year survival were 0.815, 0.765, and 0.717, respectively, implying that the signature had good predictive performance (E). Moreover, the risk score had a higher AUC value than age, gender, cytogenetic risk, and FAB (F). Furthermore, the results on the consistency index showed a similar effect in that the risk score had better predictive properties than age, gender, cytogenetic risk, and FAB (G).
Figure 4. Examination of the prognostic power of the risk model. Visualisation of results for (A) all genes, (B) NMRGs, (C) NAD+ metabolism-associated lncRNAs, and (D) risk scores by PCA used to separate patients in the HR and LR subgroups. (E) The results of ROC curves showed that the AUC values at 1, 2, and 3 years were not less than 0.7, implying that the signature had good predictive performance for the prognosis of patients. Furthermore, the results of both the ROC curves (F) and consistency index (G) showed that the risk score had better predictive power than age, gender, cytogenetic risk, and FAB.
3.3. Independent prognostic analysis and construction of a nomogram
The risk score was not regarded as sufficient to adequately predict OS in AML patients, although it was an independent risk factor for AML, as proven by univariate and multivariate regression analyses (A and B). Therefore, we combined the risk score with the clinical characteristics of patients, including age and cytogenetic risk, to construct a nomogram to predict the 1-year, 2-year, and 3-year OS of AML patients (C). Subsequently, we evaluated the predictive ability of the nomogram for the actual survival of AML patients using the calibration curve, and the results are shown in D. In the calibration plot, the prediction curves for the survival of AML patients at the 1-, 2-, and 3-year intervals were in the vicinity of the observed actual survival curve, indicating the better predictive ability of the nomogram.
Figure 5. Independent prognostic analysis and construction of a nomogram. Age, cytogenetic risk, and risk score were proven to be independent risk factors for AML by univariate(A) and multivariate(B) regression analyses. Construction and assessment of the nomogram. (C) Nomogram constructed by incorporating the risk score and the clinical characteristics of patients, including age, and cytogenetic risk, to predict the 1-year, 2-year, and 3-year OS of AML patients. (D) Calibration curves for 1-, 2-, and 3-year predictions were in the vicinity of the observed actual survival curve, indicating the better predictive ability of the nomogram.
3.4. GO and KEGG functional enrichment analysis
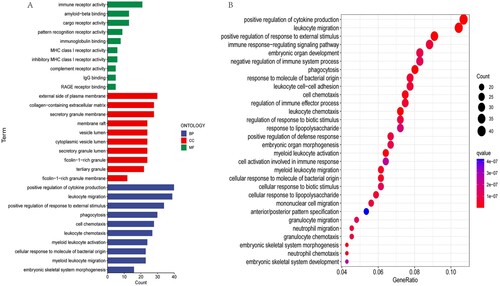
A total of 713 DEGs were screened from the two risk subgroups to further explore the possible pathways and biological functions involved. The R package ‘clusterProfiler’ was used for gene set enrichment analysis. The results of GO terms were divided into three subontologies: biological processes (BP), cellular component (CC), and molecular function (MF). We illustrated the top 10 GO terms for each subsection (A). The common DEGs were highly clustered in positive regulation of cytokine production and leukocyte migration for the biological process subsection. The cellular component study exhibited significant involvement of the common DEGs on the external side of the plasma and membrane. Molecular function subsection data indicated that the common DEGs were prominently associated with immune receptor activity. The results of KEGG enrichment analysis showed that the common DEGs were mainly enriched in pathways, such as positive regulation of cytokine production and leukocyte migration (B).
Figure 6. GO and KEGG pathway analysis. (A)Significantly enriched GO terms of the DEGs between the LR and HR subgroups in the total cohort. (B)Significantly enriched KEGG pathway terms of the DEGs between the LR and HR subgroups.
3.5. TMB difference evaluation
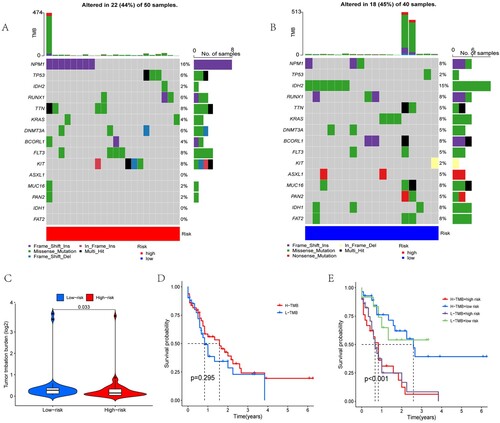
To explore the relationship between risk scores and gene mutations, we analysed the frequency of gene mutations in the two risk groups using the R package ‘maftools’. Table S3 shows the panel of mutations used for assessment. A and B show the top 15 mutated genes with the highest frequencies between the HR and LR subgroups. The mutation frequencies of TP53, NPM1 and FLT3 were higher in the HR group, while the mutation frequencies of ASXL1 and BCORL1 were higher in the LR group. To examine the differences between the HR and LR groups further, we compared the TMB values between the two groups using the ‘limma’ package. Statistical differences indicated that the LR group had higher TMB values than the HR group (p = 0.033, C). We divided the entire cohort of patients into high tumour mutation load (H-TMB) and low tumour mutation load (L-TMB) groups based on TMB. We then proceeded to analyse the effect of TMB and risk score on patient survival. Unfortunately, TMB values were not associated with patient survival (p = 0.295), but the risk score was significantly associated with patient survival (p < 0.001, D and E).
Figure 7. Analysis of gene mutations and survival. The top 15 mutation frequencies of genes with the highest frequencies between the (A) HR and (B) LR subgroups. (C) A violin plot was used to present the difference in tumour mutation burden between the low-risk and high-risk groups. The samples were then allocated into the H-TMB and L-TMB cohorts based on the median value of the TMB score in all cohorts. The effect of TMB (D) and TMB with risk score (E) on patient survival indicated that the TMB values were not associated with patient survival (p = 0.295), but the risk score was significantly associated with patient survival (p < 0.001).
3.6. Tumour immunity assessment
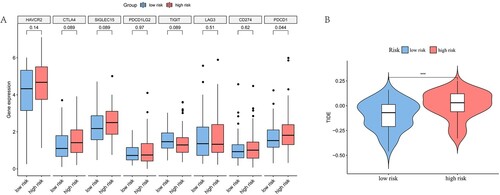
Subsequently, we investigated the differences between the HR and LR subgroups regarding immune-related functions. Statistical analysis showed a strong positive correlation between Check−point, T_cell_costimulation, APC_costimulation, CCR, parainflammation, and risk score (p < 0.001). On the other hand, there were no differences observed in APC_coinhibition, T_cell_coinhibition, Cytolytic_activity, and HLA between the two groups (A). Moreover, we performed a correlation analysis of the risk score with immune infiltration. The results showed a significant difference between the HR and LR subgroups. The ESTIMATE score was obtained by adding the immune score to the stromal score. The HR group had a higher ESTIMATE score (p < 0.05) and immune score (p < 0.001) than the LR group (B and C), while no significant differences were observed regarding the stromal score (Figure S4). This suggested a positive correlation between the risk score and the immune score. Based on the above findings, we immediately evaluated the immune cell infiltration of each sample using CIBERSORT algorithms (Figure S5). Moreover, we visualised the results with the significant difference (p < 0.05) through violin plots, and the results are displayed in . Increased levels of Naive B cells, resting CD4-positive (CD4+) memory T cells, gamma delta T (γδT) cells, activated dendritic cells, resting mast cells, and activated mast cells accumulated in the LR group. At the same time, monocytes showed increased enrichment in the HR group. In addition, among these immune checkpoint genes, only PDCD1 had higher expression in the HR group than in the LR group (A).
Figure 8. Immune characteristics analysis. (A) Heatmap visualising the difference in immune-related functions between the low- and high-risk subgroups. The differences in ESTIMATE score (B) and immune score (C) between the low- and high-risk subgroups are presented in violin plots. ‘*’, ‘**’ and ‘***’ represent p < 0.05, p < 0.01 and p < 0.001, respectively.
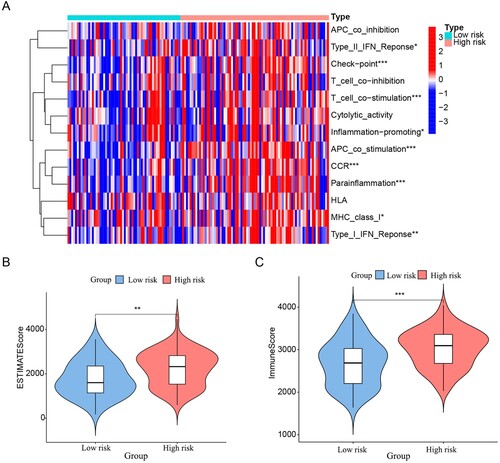
Figure 9. Differential analysis of immune cell infiltration. The results showed differences in the distribution of immune cells between the two groups. ‘*’, ‘**’ and ‘***’ represent p < 0.05, p < 0.01 and p < 0.001, respectively.
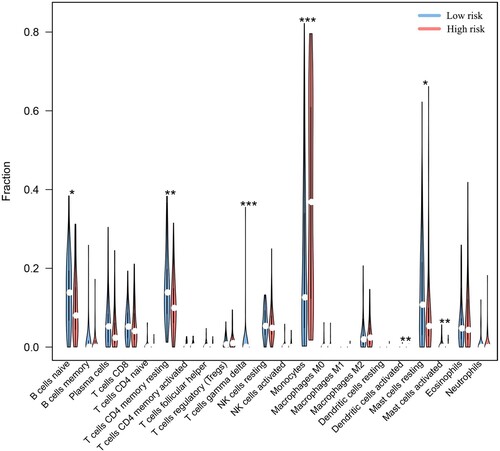
Figure 10. Differential expression of immune checkpoint genes and TIDE analysis. (A) The results showed the differential expression of PDCD1 between the low-risk and high-risk subgroups. (B) The results suggested that there were large differences in TIDE scores between the high-risk and low-risk subgroups, and the high-risk group had a higher TIDE score. ‘***’ represents p < 0.05.
3.7. Immune response prediction and drug sensitivity analysis
Considering the differences in immune-related functions between the HR and LR groups, we predicted the sensitivity of both groups to immunotherapy by the TIDE algorithm. The results showed that the HR group had higher TIDE points, suggesting that overall, the HR group may be less sensitive to immune checkpoint inhibitor therapy than the LR group (B). We further analysed the correlation of risk scores with sensitivity to chemotherapy and targeted drugs (Figure S6). A significant correlation was found between drug sensitivity and the risk score. Specifically, the LR group was more sensitive to specific agents, such as CP466722, cytarabine, navitoclax, OSI-027, VX-680, and ZM-447439 (Figure S7).
4. Discussion
AML is characterised by poor prognosis and high heterogeneity. It is vital that accurate prognostic stratification is used to select an appropriate treatment strategy. Therefore, an exploration of the factors affecting prognosis to improve risk classification is a crucial way to enhance patient prognosis. Recently, there is increasing evidence that metabolic reprogramming is a prominent feature of tumour cells [Citation7]. Previous studies have shown that there are different dominant metabolic pathways in various tumour cells. LSCs separated from de novo AML patients show an aberrant dependence on amino acid metabolism for oxidative phosphorylation and survival. Interfering with the amino acid metabolic pathway can reduce the degree of oxidative phosphorylation and ultimately lead to LSC death. In contrast, LSCs isolated from relapsed AML patients are not dependent on amino acid metabolism, given that they are able to compensate by increasing fatty acid metabolism [Citation20]. In addition, evidence supports the theory that elevated nicotinamide (NAM) metabolism underlies both the mechanism of venetoclax/azacitidine resistance and the metabolic vulnerability of relapsed/refractory leukemia stem cells (R/R LSCs) [Citation11]. Moreover, NAM as a precursor of nicotinamide adenine dinucleotide (NAD+), is engaged in its biosynthesis and biodegradation [Citation21]. A recent study also showed that NAD + plays an indispensable role in many enzymatic reactions of energy metabolism, including glycolysis, oxidative phosphorylation (OXPHOS), fatty acid oxidation, and the tricarboxylic acid (TCA) cycle [Citation22]. Nevertheless, the magnitude of the effect of NAD+, the centre of cellular metabolism, on the prognosis of AML needs to be further investigated. With the development of whole genome sequencing technology, there is a better understanding of the mechanisms of disease pathogenesis and the factors associated with prognosis [Citation23, Citation24]. Some studies have observed aberrant expression of certain lncRNAs in AML and considered that these lncRNAs might influence patient prognosis [Citation25]. Studies exploring the relationship between lncRNAs and the prognosis of AML are still limited Therefore, NAD + metabolism-related lncRNAs were identified for the purpose of predicting the survival of AML patients.
Although several valuable signatures are available for the prognostic analysis of AML patients, most of the studies only focused on pyroptosis, autophagy, ferroptosis oxidative stress, and mutation [Citation26–33], but little attention has been given to tumour cell metabolism. Moreover, some studies have used both GEO and TCGA data to expand the sample size, but the data preprocessing and sample backgrounds were different, resulting in different cut-off values and biased prediction results. In addition, some prediction models involve too many variables to facilitate clinical applications in the future. In this study, we constructed a risk score model with only four NAD+ metabolism-related lncRNAs by analysing data from the TCGA database. A series of analyses have shown that the signature has good predictive ability. The risk score was proven to be an independent prognostic factor of AML, and the patients in the HR subgroup had a worse outcome than those in the LR group. Then, we found that there were significant differences in mutation and immunity characteristics between the HR and LR subgroups. Moreover, we further performed immune response prediction and drug sensitivity analysis.
Our prognostic model involved four lncRNAs related to NAD+ metabolism. According to the results of Cox regression analysis, LINC01679, AC079922.2, and LINC02465 were considered risk factors associated with poor prognosis in patients with AML, while TRAF3IP2-AS1 was related to a favourable prognosis. A recent study showed that in prostate cancer, high expression of LINC01679 was observed in patients with superior survival [Citation34]. The expression of LINC02465 was revealed to correlate with tumour size and stage, lymph node metastasis, and differentiation in gastric cancer (GC). Moreover, LINC02465 was upregulated in GC patients with poor prognoses. The results also indicated that LINC02465 could regulate many cellular functions, such as proliferation and migration, invasion, and epithelial–mesenchymal transition in vitro. In addition, inhibition of LINC02465 limited tumour growth in vivo. Mechanistically, LINC02465 may regulate the PI3 K/AKT signalling pathway leading to GC. In conclusion, LINC02465 is considered an oncogenic lncRNA that promotes GC onset and progression via the PI3 K/AKT pathway [Citation35]. To date, LINC01679 and LINC02465 have been reported only in solid tumours but have not been involved in hematologic tumours. TRAF3IP2-AS1 is considered a prognostic biomarker in the majority of cancer types, including renal cell carcinoma [Citation36], autoimmune diseases [Citation37], pancreatic Cancer [Citation38], endometrial Cancer [Citation39], and glioblastomas [Citation40]. More importantly, TRAF3IP2-AS1 was thought to be a ‘protective’ lncRNA in AML [Citation41], which was consistent with our findings. To date, no work has been reported on AC079922.2, further exploration is needed to reveal the mechanisms of how lncRNAs regulate the process of AML.
In this study, we examined the predictive value of the risk score based on NAD + metabolism-related lncRNAs for the outcome of AML patients. Based on the risk score, AML patients were divided into HR and LR subgroups. Kaplan–Meier analysis revealed a statistically considerable difference between the HR and LR subgroups, and patients in the HR subgroup had worse outcomes in the training, test, and entire cohorts. Compared with traditional clinical characteristics (age, gender, cytogenetic risk, FAB), the risk score showed a better predictive property by the C-index. In ROC analysis, the AUC values of 1-,2- and 3-year survival were 0.815, 0.765, and 0.717, respectively, in the patients with AML. These results suggested that the risk score had a good predictive capability for patient survival. Univariate and multivariate COX regression analyses proved the risk score to be an independent prognostic factor. We built a nomogram based on risk scores and clinical characteristics to extend the clinical applicability of prognostic models.
To further identify the biological functions associated with the risk score, we screened DEGs between the HR and LR subgroups for enrichment analysis. As a result, many biological pathways related to immunity and cell migration were observed, which suggested that DEGs might be relevant to the tumour immune microenvironment. Previous studies supported that cancer cells could secrete a diversity of cytokines, chemokines, and other factors for microenvironmental remodelling, which contributed to tumorigenesis and progression [Citation42].
To investigate the potential mechanisms underlying the different prognoses of patients in different risk subgroups, we further compared the mutation and immune factors between the two groups. Mutations are a key factor affecting the prognosis of patients. TP53, an essential tumour suppressor gene, is responsible for several fundamental cellular functions such as cellular senescence, apoptosis, DNA repair, maintenance of genomic homeostasis, and cellular metabolism. Moreover, TP53 mutations were associated with advanced age, complex cytogenetic features, a high risk of relapse, and chemoresistance [Citation43]. Our results are similar to those of previous studies, and patients in the HR group had a higher frequency of TP53 mutations than those in the LR group. However, ASXL1 mutations associated with worse outcome were more frequent in the LR group (8%) than in the HR group (4%). The limited sample size in this study may be an important influencing factor. We also compared the differences between the HR and LR subgroups regarding TMB. The TMB values were lower in the HR group than in the LR group. TMB is defined as the total number of mutations in a tumour sample, and TMB is currently usually indicated by the number of mutations per megabase (Mut/Mb) of DNA being sequenced. Nevertheless, there is no consensus on determining high and low TMB. Some studies consider ≥20 Mut/Mb as high TMB when detected; TMB-medium, 6–19 Mut/Mb; TMB-low, ≤ 5 Mut/Mb. The FDA documents released considered ≥10 Mut/Mb as high TMB [Citation17, Citation44]. AML itself is a common mutation burden disease [Citation17], a fact that is consistent with our findings.
Evidence supports the idea that metabolic reprogramming plays a crucial role in regulating antitumour immune responses by influencing the function of immune cells [Citation45]. Previous studies have shown that immune and stromal cells are essential members of the tumour microenvironment (TME) and play important roles in the development and progression of AML and therapeutic resistance [Citation46]. These immune cells infiltrating the tumour microenvironment (TME) constitute the tumour immune microenvironment (TIME). It has been shown that the composition and activity of immune cells in the TIME and some related influencing factors, including the expression of immune checkpoint molecules on the cell surface and alterations in the associated matrix, determine the status of immune responses in the TME and affect the clinical prognosis of patients with tumours [Citation47]. In our study, the HR group possessed a higher immune score, suggesting a complex dynamic immunomodulatory process in the progression of AML. Immediately afterwards, we compared immune cell type comparisons between the HR and LR groups. The results showed that distinctly higher infiltration of monocytes and lower infiltration of Naive B cells, resting CD4-positive (CD4+) memory T cells, γδT cells, and resting mast cells in the HR group with worse prognosis, suggesting that the characteristic enrichment of immune cells may be associated with the survival of AML patients. This relationship has been discussed in other studies, and the results are consistent with ours. Monocytes play an essential role in the induction of immune tolerance, angiogenesis, and metastasis for tumour growth and progression [Citation48]. Additionally, monocytes produce tumour-associated macrophages that inhibit the antitumour immune response [Citation49]. Naive B cells can evolve into antibody-secreting plasma cells or memory B cells when exposed to a new antigen, which facilitates the immune response to cancer [Citation50]. A recent study showed that increased levels of Naive B cells and decreased levels of γδT cells accumulated in AML patients with superior survival [Citation51]. Mast cells, innate immune cells, play an important role in the inflammatory response and tissue homeostasis and have different prognostic implications in different tumour types and stages. Mast cells can promote tumour cell survival, angiogenesis, and metastasis. In contrast, they can also recruit various immune cells to coordinate antitumour immune responses [Citation19, Citation52]. Abnormal proliferation of mast cells can develop into systemic mastocytosis and eventually progress to mast cell leukemia [Citation53]. However, more in-depth studies are still needed to explore the relationship between the risk score and immune cells in the TME. In addition, the different expression levels of the immune checkpoint gene PDCD1 in the HR and LR groups indicated that patients from the HR group might benefit from PD-1 inhibitors. Immune evasion is considered to be one of the fundamental causes of AML progression and relapse, which provides a theoretical basis for immunotherapy. Based on the analysis of immune cell infiltration and risk score, we found a significant correlation between them. We further performed correlation analysis between the risk score and drugs and performed drug sensitivity prediction analysis. These results suggested that our model could predict the chemotherapy response and provide a reference for AML treatment to a certain extent.
Some limitations involved in this research should be noted. First, the sample size of AML used for analysis was limited, and our own sequencing data from clinical samples will be used for validation in the future. And we need more clinical cases to validate and improve the reliability of the nomogram. Second, the database used for the analysis lacked specific patient data, which prevented us from reassessing patients according to the new ICC, WHO and ELN 2022 classification. Finally, the results of our research are preliminary, and all of the analyses were based on public database mining with no involvement of fundamental trials. This indicates that further molecular experiments are necessary to elucidate the exact mechanisms of the genes in the model in AML progression, immunotherapy, and drug resistance. Given that these fundamental experiments are time-consuming and costly projects, they will be carried out in future studies.
5. Conclusion
In summary, the risk signature based on NAD + metabolism-related lncRNAs was proven to be an independent prognostic factor in AML and showed good performance in predicting the outcomes of patients, TMB, immune microenvironment, and therapeutic sensitivity in AML. This may, to some extent, provide a reference for the accurate risk prediction and personalised therapy of AML.
Author contributions
(I) Conception and design: YZ, JJ and YN. (II) Download and collection of data: YZ, XY, and JJ. (III) Data analysis and interpretation: YZ, YG, and LZ. (IV) Production of table and figure: YZ, JJ and YN. (V) Manuscript writing: All authors. (VI) Final approval of manuscript: All authors.
Acknowledgments
Thanks to the support of the Department of Hematology, the First Affiliated Hospital of Lanzhou University.
Data availability statement
All data related to this manuscript can be downloaded online for free from the TCGA database in the GDC Data Portal (https://portal.gdc.cancer.gov/) and UCSC Xena (https://xenabrowser.net/datapages/).
Disclosure statement
No potential conflict of interest was reported by the author(s).
References
- Pelcovits A, Niroula R. Acute myeloid leukemia: a review. R I Med J (2013). 2020;103(3):38–40. PMID: 32236160.
- Döhner H, Estey E, Grimwade D, et al. Diagnosis and management of AML in adults: 2017 ELN recommendations from an international expert panel. Blood. 2017;129(4):424–447. doi:10.1182/blood-2016-08-733196
- Estey EH. Acute myeloid leukemia: 2019 update on risk-stratification and management. Am J Hematol. 2018;93(10):1267–1291. doi:10.1002/ajh.25214
- Newell LF, Cook RJ. Advances in acute myeloid leukemia. Br Med J. 2021;375:n2026, doi:10.1136/bmj.n2026
- De Kouchkovsky I, Abdul-Hay M. Acute myeloid leukemia: a comprehensive review and 2016 update. Blood Cancer J. 2016;6(7):e441, doi:10.1038/bcj.2016.50
- Tamamyan G, Kadia T, Ravandi F, et al. Frontline treatment of acute myeloid leukemia in adults. Crit Rev Oncol Hematol. 2017;110:20–34. doi:10.1016/j.critrevonc.2016.12.004
- Sun L, Suo C, Li ST, et al. Metabolic reprogramming for cancer cells and their microenvironment: beyond the Warburg effect. Biochim Biophys Acta Rev Cancer. 2018;1870(1):51–66. doi:10.1016/j.bbcan.2018.06.005
- Martínez-Reyes I, Chandel NS. Cancer metabolism: looking forward. Nat Rev Cancer. 2021;21(10):669–680. doi:10.1038/s41568-021-00378-6
- Covarrubias AJ, Perrone R, Grozio A, et al. NAD+ metabolism and its roles in cellular processes during ageing. Nat Rev Mol Cell Biol. 2021;22(2):119–141. doi:10.1038/s41580-020-00313-x
- Ghanem MS, Monacelli F, Nencioni A. Advances in NAD-Lowering Agents for Cancer Treatment. Nutrients. 2021 May 14;13(5):1665. doi:10.3390/nu13051665.
- Jones CL, Stevens BM, Pollyea DA, et al. Nicotinamide metabolism mediates resistance to venetoclax in relapsed acute myeloid leukemia stem cells. Cell Stem Cell. 2020;27(5):748–764.e4.e744. doi:10.1016/j.stem.2020.07.021
- Rajman L, Chwalek K, Sinclair DA. Therapeutic potential of NAD-boosting molecules: the In vivo evidence. Cell Metab. 2018;27(3):529–547. doi:10.1016/j.cmet.2018.02.011
- Pramono AA, Rather GM, Herman H, et al. NAD- and NADPH-contributing enzymes as therapeutic targets in cancer: An overview. Biomolecules. 2020 Feb 26;10(3):358. doi:10.3390/biom10030358.
- Navas LE, Carnero A. NAD+ metabolism, stemness, the immune response, and cancer. Signal Transduct Target Ther. 2021;6(1):2, doi:10.1038/s41392-020-00354-w
- Zapata-Pérez R, Wanders RJA, van Karnebeek CDM, et al. NAD+homeostasis in human health and disease. EMBO Mol Med. 2021;13(7):e13943, doi:10.15252/emmm.202113943
- Lin L, Chen L, Xie Z, et al. Identification of NAD+ metabolism-derived gene signatures in ovarian cancer prognosis and immunotherapy. Front Genet. 2022;13:905238, doi:10.3389/fgene.2022.905238
- Chalmers ZR, Connelly CF, Fabrizio D, et al. Analysis of 100,000 human cancer genomes reveals the landscape of tumor mutational burden. Genome Med. 2017;9(1):34, doi:10.1186/s13073-017-0424-2
- Wu T, Dai Y. Tumor microenvironment and therapeutic response. Cancer Lett. 2017;387:61–68. doi:10.1016/j.canlet.2016.01.043
- Hempel HA, Cuka NS, Kulac I, et al. Low intratumoral mast cells Are associated With a higher risk of prostate cancer recurrence. Prostate. 2017;77(4):412–424. doi:10.1002/pros.23280
- Jones CL, Stevens BM, D’Alessandro A, et al. Inhibition of amino acid metabolism selectively targets human leukemia stem cells. Cancer Cell. 2018;34(5):724–740.e4.e724. doi:10.1016/j.ccell.2018.10.005
- Xie N, Zhang L, Gao W, et al. NAD+ metabolism: pathophysiologic mechanisms and therapeutic potential. Signal Transduct Target Ther. 2020;5(1):227, doi:10.1038/s41392-020-00311-7
- Chiarugi A, Dölle C, Felici R, et al. The NAD metabolome — a key determinant of cancer cell biology. Nat Rev Cancer. 2012;12(11):741–752. doi:10.1038/nrc3340
- Sun J, Li W, Sun Y, et al. A novel antisense long noncoding RNA within the IGF1R gene locus is imprinted in hematopoietic malignancies. Nucleic Acids Res. 2014;42(15):9588–9601. doi:10.1093/nar/gku549
- Papaioannou D, Nicolet D, Ozer HG, et al. Prognostic and biologic relevance of clinically applicable long noncoding RNA profiling in older patients with cytogenetically normal acute myeloid leukemia. Mol Cancer Ther. 2019;18(8):1451–1459. doi:10.1158/1535-7163.MCT-18-1125
- Garzon R, Volinia S, Papaioannou D, et al. Expression and prognostic impact of lncRNAs in acute myeloid leukemia. Proc Natl Acad Sci U S A. 2014;111(52):18679–18684. doi:10.1073/pnas.1422050112
- Dong C, Zhang N, Zhang L. The multi-omic prognostic model of oxidative stress-related genes in acute myeloid leukemia. Front Genet. 2021;12:722064, doi:10.3389/fgene.2021.722064
- Huang L, Lin L, Fu X, et al. Development and validation of a novel survival model for acute myeloid leukemia based on autophagy-related genes. PeerJ. 2021;9:e11968, doi:10.7717/peerj.11968
- Wang J, Zhuo Z, Wang Y, et al. Identification and validation of a prognostic risk-scoring model based on ferroptosis-associated cluster in acute myeloid leukemia. Front Cell Dev Biol. 2022;9:800267, doi:10.3389/fcell.2021.800267
- Han C, Zheng J, Li F, et al. Novel prognostic signature for acute myeloid leukemia: bioinformatics analysis of combined CNV-driven and ferroptosis-related genes. Front Genet. 2022;13:849437, doi:10.3389/fgene.2022.849437
- Liu S, Luo D, Luo J, et al. Construction of a pyroptosis-related signature for prognostic prediction and characterization of immune microenvironment in acute myelogenous leukemia. Int J Gen Med. 2022;Volume 15:2913–2927. doi:10.2147/IJGM.S352062
- Nie L, Zhang Y, You Y, et al. The signature based on seven genomic instability-related genes could predict the prognosis of acute myeloid leukemia patients. Hematology. 2022;27(1):833–841. doi:10.1080/16078454.2022.2107970
- Shao R, Wang H, Wang J, et al. Comprehensive analysis of a pyroptosis-related gene signature of clinical and biological value in acute myeloid leukaemia. Int Immunopharmacol. 2022;108:108802, doi:10.1016/j.intimp.2022.108802
- Xu Q, Guo T. Somatic mutation-associated risk index based on lncRNA expression for predicting prognosis in acute myeloid leukemia. Hematology. 2022;27(1):659–671. doi:10.1080/16078454.2022.2056677
- Zhang P, Tan X, Zhang D, et al. Development and validation of a set of novel and robust 4-lncRNA-based nomogram predicting prostate cancer survival by bioinformatics analysis. PLoS One. 2021;16(5):e0249951, doi:10.1371/journal.pone.0249951
- Han L, Hao Y, Wang J, et al. Knockdown of LINC02465 suppresses gastric cancer cell growth and metastasis Via PI3K/AKT pathway. Hum Gene Ther Clin Dev. 2019;30(1):19–28. doi:10.1089/humc.2018.177
- Yang L, Chen Y, Liu N, et al. Low expression of TRAF3IP2-AS1 promotes progression of NONO-TFE3 translocation renal cell carcinoma by stimulating N6-methyladenosine of PARP1 mRNA and downregulating PTEN. J Hematol Oncol. 2021;14(1):46, doi:10.1186/s13045-021-01059-5
- He R, Wu S, Gao R, et al. Identification of a Long Noncoding RNA TRAF3IP2-AS1 as Key regulator of IL-17 signaling through the SRSF10–IRF1–Act1 axis in autoimmune diseases. J Immunol. 2021;206(10):2353–2365. doi:10.4049/jimmunol.2001223
- Li J, Zhang J, Tao S, et al. Prognostication of pancreatic cancer using the cancer genome atlas based ferroptosis-related long Non-coding RNAs. Front Genet. 2022;13:838021, doi:10.3389/fgene.2022.838021
- Shi R, Wang Z, Zhang J, et al. N6-Methyladenosine-related long noncoding RNAs as potential prognosis biomarkers for endometrial cancer. Int J Gen Med. 2021;Volume 14:8249–8262. doi:10.2147/IJGM.S336403
- Zan XY, Li L. Construction of lncRNA-mediated ceRNA network to reveal clinically relevant lncRNA biomarkers in glioblastomas. Oncol Lett. 2019;17(5):4369–4374. doi:10.3892/ol.2019.10114
- Zhong F, Yao F, Cheng Y, et al. m6A-related lncRNAs predict prognosis and indicate immune microenvironment in acute myeloid leukemia. Sci Rep. 2022;12(1):1759, doi:10.1038/s41598-022-05797-5
- Hinshaw DC, Shevde LA. The tumor microenvironment innately modulates cancer progression. Cancer Res. 2019;79(18):4557–4566. doi:10.1158/0008-5472.CAN-18-3962
- Barbosa K, Li S, Adams PD, et al. The role of TP53 in acute myeloid leukemia: challenges and opportunities. Genes Chromosomes Cancer. 2019;58(12):875–888. doi:10.1002/gcc.22796
- Goodman AM, Kato S, Bazhenova L, et al. Tumor mutational burden as an independent predictor of response to immunotherapy in diverse cancers. Mol Cancer Ther. 2017;16(11):2598–2608. doi:10.1158/1535-7163.MCT-17-0386
- Xia L, Oyang L, Lin J, et al. The cancer metabolic reprogramming and immune response. Mol Cancer. 2021;20(1):28, doi:10.1186/s12943-021-01316-8
- Tabe Y, Konopleva M. Role of microenvironment in resistance to therapy in AML. Curr Hematol Malig Rep. 2015;10(2):96–103. doi:10.1007/s11899-015-0253-6
- Chen Z, Zhou L, Liu L, et al. Single-cell RNA sequencing highlights the role of inflammatory cancer-associated fibroblasts in bladder urothelial carcinoma. Nat Commun. 2020;11(1):5077, doi:10.1038/s41467-020-18916-5
- Ugel S, Canè S, De Sanctis F, et al. Monocytes in the tumor microenvironment. Annu Rev Pathol. 2021;16:93–122. doi:10.1146/annurev-pathmechdis-012418-013058
- Varol C, Mildner A, Jung S. Macrophages: development and tissue specialization. Annu Rev Immunol. 2015;33:643–675. doi:10.1146/annurev-immunol-032414-112220
- Siegrist CA, Aspinall R. B-cell responses to vaccination at the extremes of age. Nat Rev Immunol. 2009;9(3):185–194. doi:10.1038/nri2508
- Cheng Y, Wang X, Qi P, et al. Tumor microenvironmental competitive endogenous RNA network and immune cells Act as robust prognostic predictor of acute myeloid leukemia. Front Oncol. 2021;11:584884, doi:10.3389/fonc.2021.584884
- Komi DEA, Redegeld FA. Role of mast cells in shaping the tumor microenvironment. Clin Rev Allergy Immunol. 2020;58(3):313–325. doi:10.1007/s12016-019-08753-w
- Valent P, Akin C, Hartmann K, et al. Updated diagnostic criteria and classification of mast cell disorders: a consensus proposal. Hemasphere. 2021;5(11):e646, doi:10.1097/HS9.0000000000000646