
 ?Mathematical formulae have been encoded as MathML and are displayed in this HTML version using MathJax in order to improve their display. Uncheck the box to turn MathJax off. This feature requires Javascript. Click on a formula to zoom.
ABSTRACT
Objective
The prognosis of acute myeloid leukemia (AML) remains poor although the basic and translational research has been highly productive in understanding the genetics and pathopoiesis of AML and a plethora of targeted therapies have been developed. Consequently, it is crucial to deepen the knowledge of molecular pathogenesis underlying AML for the advancement of new treatment options.
Method
A RSK gene family-related signature was constructed to investigate whether RSK gene family members were useful in predicting the prognosis of AML patients. The relationship between the RSK gene family-related signature and the infiltration of immune cells was further assessed using the CIBERSORT algorithm. The ‘oncoPredict’ package was used to analyze relationships between the RSK gene family-related signature and the sensitivity to drugs or small molecules.
Results
Patients were classified into two groups using the RSK gene family-related signature following the median risk score. Overall survival (OS) was significantly longer in patients with low-risk scores than that in patients with high-risk scores as showed by both training and validation datasets. Moreover, the signature was helpful in predicting 1-year, 3-year, and 5-year OS in training and validation datasets. In addition, it was identified that low-risk patients exhibited greater sensitivity to 20 drugs or small molecules and that high-risk patients had higher sensitivity to 38 drugs or small molecules.
Conclusion
RSK gene family members, particularly RPS6KA1 and RPS6KA4, may help to predict prognosis for AML patients. Furthermore, RPS6KA1 may serve as a novel drug target for AML.
Background
Acute myeloid leukemia (AML) is one of the most frequently occurred hematopoietic cancers in adults [Citation1]. During the last 15 years, substantial effects have been yielded through translational and basic studies in understanding the molecular and genetic mechanism behind AML pathogenesis. Consequently, numerous novel and efficacious targeted treatments have been established, like protein kinase small-molecule inhibitors, such as gilteritinib [Citation2], enasidenib [Citation3], and ivosidenib [Citation4], immune checkpoint antibodies, such as gemtuzumab [Citation5], and mitochondrial inhibitors, such as venetoclax [Citation6,Citation7]. AML still has poor outcomes in spite of these advancements, with about 50% of 5-year overall survival (OS) rate in patients before 40 years and 10% of 5-year OS rate in patients older than 65 years [Citation8,Citation9]. Therefore, more knowledge about the molecular mechanism of AML pathogenesis is urgently needed to develop novel therapies [Citation10,Citation11].
The RSK family comprises four human isoforms (RPS6KA1, RPS6KA2, RPS6KA3, and RPS6KA6) and two structurally related homologues (RSP6KA4 and RSP6KA5). RSK gene family members share a high degree of sequence homology (75–80% amino-acid identity) and are uniquely characterized by the presence of two distinct functional kinase domains [Citation12,Citation13].
Arsenic trioxide (As2O3) is one of the most efficacious agents in the treatment of acute promyelocytic leukemia (APL) [Citation14,Citation15] but is ineffective against other forms of AML [Citation16]. Inhibition of RPS6KA1 (RSK1) enhances As2O3-dependent apoptosis of AML cells, suggesting the potential of RPS6KA1 targeting in combination with As2O3 as a novel treatment option for AML [Citation17].
A previous study documented that RPS6KA1 represents a promising target for novel therapeutic strategies targeting therapy-resistant internal tandem duplication mutations in FLT3 juxtamembrane domain (FLT3-ITDs)-positive AML [Citation18]. However, there is no research on the possibility of using RPS6KA1 to predict the OS of AML patients. Likewise, the drug sensitivity of patients with different RPS6KA1 expression has not yet been explored.
On this basis, this study systematically probed into the expression of RSK gene family members and their prognostic values and constructed a prognostic signature in 130 samples with AML from The Cancer Genome Atlas (TCGA) cohorts. Then, two microarray datasets were used to validate the RSK gene family-related prognostic signature, followed by analyses of the association of the signature with clinical outcomes, immune heterogeneity, and drug response features.
Materials and methods
AML dataset source
Gene expression data of tumor specimens and clinical data were obtained from the TCGA database (https://portal.gdc.cancer.gov/). Clinical information, such as survival, gender, and age of patients, was also acquired from the TCGA website. After samples without completed clinical information were removed, this research included 130 tumor tissues.
Microarray datasets GSE37642 [Citation19–22] and GSE12417 [Citation23] were harvested from the Gene Expression Omnibus (GEO) database (http://www.ncbi.nlm.nih.gov/geo). In GSE37642, gene expression data of 136 samples were screened from the platform GPL570 (HG-U133_Plus_2) Affymetrix Human Genome U133 Plus 2.0 Array. In GSE12417, gene expression data of 79 samples were retrieved from the GPL570 platform. This was because only the data retrieved from the GPL570 platform contained the expression of the RSK family.
Data preprocessing
For GEO database-derived microarray datasets, the Robust Multi-array Average approach available through the ‘affy’ package was utilized to obtain background-adjusted, probe-level, and quantile-normalized data-summarized values for probe sets. For the TCGA-LAML dataset-derived high-throughput sequencing, transcripts per million (TPM) values were generated by converting row read count values because TPM values were more comparable between samples and more alike to values produced by microarrays [Citation24].
The association between RSK family genes and clinical features
UALCAN (Birmingham, AL, USA) publicly available at http://ualcan.path.uab.edu [Citation25] was used to evaluate the association between RSK family genes and clinical features including age, gender, FLT3 mutation, PML/RAR-fusion, RAS activation, and race. The 2017 European Leukemia Net (ELN) recommendations for genetic risk stratification of ALM have been widely adopted [Citation26]. The expression of RSK family genes in each group of the ELN risk system was also explored.
Identifying an RSK family-related prognostic signature
Univariate Cox proportional hazards regression analyses were firstly implemented on expression matrix of genes in the RSK family to evaluate the relationship of genes in the RSK family with prognosis (OS) in the TCGA-LAML cohort. Genes in the RSK family with p < 0.1 were regarded as the potential prognosis-associated genes.
In the training step, an optimal prognostic signature with the fewest RSK genes was constructed using the least absolute shrinkage and selection operator (LASSO) penalty in the discovery cohorts. The optimal value of the penalty parameter l was tuned using ten-fold cross-validation, which yielded the minimal partial likelihood deviance. Finally, a prognostic signature related to two RSK genes with non-zero coefficients was identified.
The risk score was computed for the signature in each sample using the equation as follows: , where the Coefi marks the coefficient and the Ei indicates the normalized expression of each chosen RSK gene with log2 and Z-score transformations. The median risk score was employed as cutoff to categorize patients into high-risk and low-risk groups. Kaplan-Meier curves were plotted for analyzing survival rates, with the difference measured using the log-rank test. The time-dependent receiver operating characteristic (ROC) curve was computed using the timeROC package.
Differentially expressed genes (DEGs)
DEGs between the predicted high-risk and low-risk groups were determined by DESeq2 packages [Citation27]. Significant DEGs were selected with the criteria of absolute log2FC > 1 and BH-adjusted p value < 0.05. Gene ontology (GO) and Kyoto Encyclopedia of Genes and Genomes (KEGG) enrichment analyses were performed with clusterProfiler packages [Citation28].
Analysis of drug sensitivity in cancer
The R package ‘oncoPredict’ [Citation29] was used to clarify the difference in drug sensitivity between the high-risk group and the low-risk group. As a public database, the Genomics of Drug Sensitivity in Cancer (GDSC) database (https://www.cancerrxgene.org/) [Citation28] can be utilized for exploring cancer molecular therapy and mutation. The gene expression data of cell lines and half-maximal inhibitory concentration (IC50) values of variable anticancer drugs were collected from a website (https://osf.io/c6tfx/files/osfstorage). A ridge regression model was utilized to analyze the difference in the sensitivity to different anticancer drugs between the high-risk group and the low-risk group [Citation29,Citation30].
Protein–protein interaction (PPI)
To explore the function of RSK family genes, we performed PPI analysis by using STRING database [Citation31].
Results
Six RSK genes were adopted to evaluate the relationship of gene expression with prognosis in the TCGA-LAML cohort with a univariate Cox proportional hazards regression model. Only two genes (RPS6KA1 and RPS6KA4) were determined as potential prognosis-associated genes (p < 0.1, ). In addition, the association of these two genes with clinical features such as age, gender, FLT3 mutation, PML/RAR-fusion, RAS activation, the ELN 2017 risk system, and race was analyzed (). We found that the expression of RPS6KA1 in adverse and intermediate groups of the ELN 2017 risk system was higher than that in the favorable group.
Figure 1. The association of RPS6KA1/RPS6KA4 expression with age, gender, FLT3 mutation, PML/RAR-fusion, RAS activation, race and the ELN 2017 risk system.
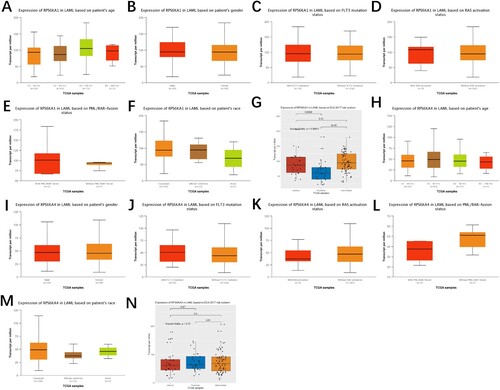
Table 1. The relationship of RSK gene family members with OS in AML patients of TCGA cohorts.
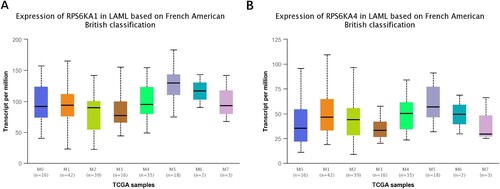
Morphologically, AML was classified into eight groups in the French-American-British classification system (FAB M0-M7) [Citation32]. The expression of these two genes was further tested in different stages. Both genes were highly expressed in AM5, without significant differences ().
Figure 2. The gene expression of RPS6KA1 and RPS6KA4 in different stages of AML.
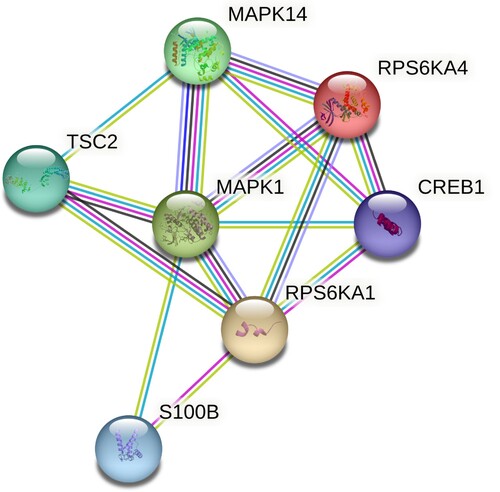
To explore the function of RPS6KA1 and RPS6KA4, we performed PPI analysis (). The result showed that RPS6KA1 interacted with S100B, TSC2, MAPK1, and CREB1, while RPS6KA4 interacted with CREB1, MAPK1, and MAPK14.
Figure 3. The PPI network displayed the interaction between RSK family genes (RPS6KA1 and RPS6KA4) and other genes.
The LASSO analysis was carried out to construct an optimal prognostic signature containing the fewest RSK genes in the TCGA-LAML cohort. Two genes were observed to have non-zero coefficients. The LASSO-selected features were utilized to construct the RSK family-related signature (A). The following equation was adopted to compute the corresponding risk score in all training and validation datasets: Risk Score = 0.222 × RPS6KA1 + 0.103 × RPS6KA4.
Figure 4. Construction of the RSK gene family-related prognostic model. (A) The corresponding hazard ratios of two genes included in the multivariate Cox regression model. (B) Risk score distribution of AML patients in TCGA cohorts, and the heatmap of the survival status of patients and the expression of characteristic genes. (C) The Kaplan-Meier curve showing the difference detected by the log-rank test for patients in TCGA cohorts. (D) The time-dependent ROC curve evaluating the accuracy of the prognostic model in TCGA cohorts.
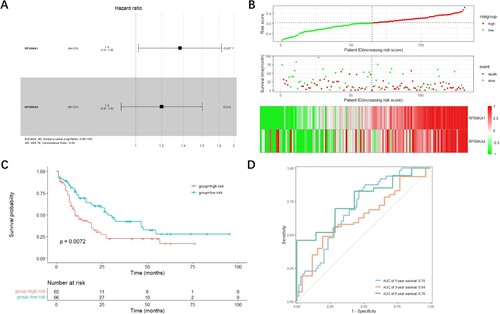
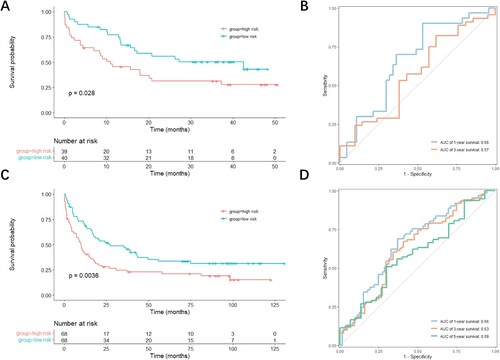
Based on the calculated risk score, the patients in the three datasets were arranged into high-risk and low-risk groups with their respective median risk scores as cutoff (B). As risk scores in both groups increased, the number of living patients decreased (B). The expression levels of both RPS6KA1 and RPS6KA4 were higher in patients with high-risk scores than in patients with low-risk scores (B). To determine the predictive performance of the signature, the Kaplan-Meier analysis was performed to determine whether OS was different in patients with low-risk scores and patients with high-risk scores. The ROC curve was utilized to assess the predictive accuracy of the signature. In the TCGA-LAML cohort, patients with high-risk scores displayed prominently shorter OS than patients with low-risk scores (p = 0.0072, C). Additionally, the area under the ROC curve (AUC) of the signature was 0.70 for 1-year OS and 0.76 for 5-year OS (D). The performance of the RSK family-related signature was slightly better than that of the ELN 2017 risk system especially for 1-year OS (Figure S1). In the GSE12417 dataset, OS was conspicuously longer in patients with low-risk scores than in patients with high-risk scores (p = 0.028, A), with the AUC of the signature for 1-year OS of 0.66 (B). In the GSE37642 dataset, the OS time also evidently varied in different groups (p = 0.0036, C), with the AUC of the signature for 1-year OS of 0.66 (D).
Figure 5. Evaluation of the accuracy of the prognostic model in validation datasets. (A, C) Kaplan-Meier curves showing the difference detected by the log-rank test for patients in GSE12417 (A) and GSE37642 (C) datasets. (B, D) Time-dependent ROC curves evaluating the accuracy of the prognostic model in GSE12417 (B) and GSE37642 (D) datasets.
Furthermore, univariate and multivariate analyses were performed to assess whether the RSK family-related signature had prognostic significance (). The results of univariate analysis showed the association of OS with age (HR, 1.03; 95% CI: 1.02-1.05; p value = 2.21 × 10⁻⁵), gender (HR, 1.01; 95% CI: 0.64-1.57; p value = 0.98), the RSK family-related signature (HR, 4.63; 95% CI: 1.99-10.79; p value = 3.88 × 10⁻⁴), and the ELN 2017 risk system (HR, 1.83; 95% CI: 1.30-2.58; p value = 5.21 × 10⁻⁴). The multivariate analyses showed that age (HR, 1.03; 95% CI: 1.01-1.05; p value = 2.13 × 10⁻⁴), the RSK family-related signature (HR, 4.25; 95% CI: 1.80-10.00; p value = 9.30 × 10⁻⁴), and ELN 2017 risk system (HR, 1.49; 95% CI: 1.03-2.16; p value = 0.035) remained independent prognostic factors for OS.
Table 2. Uni – and multi-variate Cox regression analysis for overall survival of TCGA-LAML cohort.
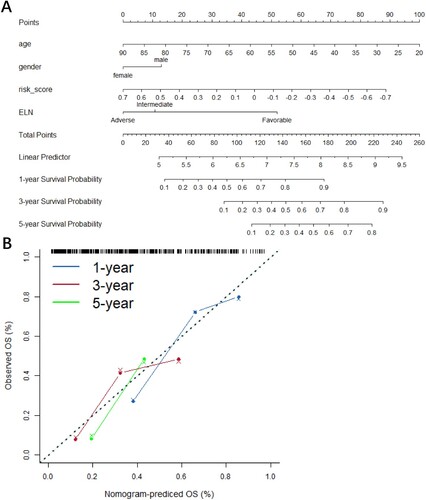
A nomogram plot that integrated risk scores, age, gender, and the ELN risk system was constructed (A) to more accurately assess the signature. The calibration curves showed that the signature could accurately predict the utility of 1-year, 3-year, and 5-year OS in AML patients (B).
Figure 6. Nomogram (A) and the calibration curve of nomogram (B) showing clinicopathological characteristics, such as age, gender, and risk scores and manifesting favorable predictive accuracy for 1-, 2-, and 3-year survival rates.
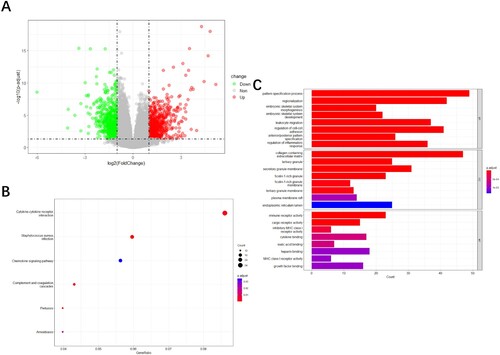
The DESeq2 package was adopted to screen out DEGs between the predicted high-risk and low-risk groups. With the criteria of absolute log2FC > 1 and BH-adjusted p value < 0.05, 1,291 DEGs were identified including 706 significantly upregulated genes and 585 significantly downregulated genes (A). Afterwards, DEGs were mainly enriched in cytokine-cytokine receptor interaction and chemokine signaling pathway, as revealed by KEGG functional analyses (B). The result of GO analyses manifested that DEGs were mostly enriched in neutrophil degranulation and neutrophil activation involved in immune response (C).
Figure 7. Functional analysis. (A) The volcano plot of the 1,291 significant DEGs between the high-risk group and the low-risk group. The enrichment analysis showed the enriched KEGG pathways (B) and enriched GO terms (C).
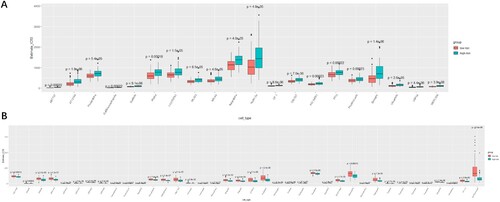
To clarify the relationship between the RSK gene family-related signature and the sensitivity of drugs or small molecules, the gene expression data of 809 cell lines and the IC50 value of 198 anticancer drugs or small molecules were downloaded from the GDSC database. The IC50 values of each patient in TCGA cohorts were computed in the light of the gene expression of cell lines to 198 anticancer drugs or small molecules. Afterwards, the difference in IC50 values between patients with low-risk scores and patients with high-risk scores was analyzed (A, B). The total IC50 values of 20 anticancer drugs or small molecules in patients with high-risk scores were considerably higher than those in patients with low-risk scores subsequent to Bonferroni correction (p < 2.5 × 10⁻⁴, 0.05/198, A). Furthermore, patients in the high-risk group were sensitive to 38 anticancer drugs or small molecules (B).
Figure 8. Evaluation of the sensitivity to different drugs or small molecules with risk scores of the RSK gene family according to the GDSC database. (A) Drugs or small molecules that patients in the low-risk group were more sensitive to. (B) Drugs or small molecules that patients in the high-risk group were more sensitive to.
Discussion
In this study, the RSK gene family-related signature was constructed to explore whether the RSK gene family assisted in predicting the prognosis of AML patients. Based on the median risk score, the patients were assigned to low-risk and high-risk groups. Low-risk patients had markedly longer OS than high-risk patients in both validation and training datasets. The results manifested that the signature was useful in predicting 1-year, 3-year, and 5-year OS in validation and training datasets. The high-risk score illustrated that there existed a higher percentage of immune cell infiltration.
The obtained RSK gene family-related signature was employed to identify the difference in OS between the low-risk group and the high-risk group. The result was evaluated in training and validation datasets (C, A, C), which illustrated the usefulness of the signature for predicting the prognosis of AML patients. The performance of the RSK family-related signature was slightly better than that of the ELN 2017 risk system especially for 1-year OS. The multivariate analysis results also indicated that the RSK family-related signature could be used to further stratify AML patients on the basis of the ELN 2017 risk system. Thereafter, the nomogram plot also proved the accuracy of the RSK gene family-related signature combined with clinical risk factors and the ELN 2017 risk system to predict 1-year, 3-year, and 5-year OS ().
RPS6KA1 and RPS6KA4 expression was positively linked to risk scores, and the survival rate was poor in the high-risk group, demonstrating RPS6KA1 and RPS6KA4 as unfavorable factors. This result was consistent with a previous finding that RPS6KA1 (RSK1) was able to enhance the survival and proliferation of AML cells [Citation18]. FLT3-ITD is the most frequent tyrosine kinase mutation in AML associated with poor prognosis. FLT3-ITD activates RPS6KA1 through activation of the MEK/ERK pathway [Citation18]. Phosphorylated RPS6KA1 and PIM can synergistically activate the mTORC1/S6 K/4EBP1 pathway and eIF4B [Citation18]. RPS6KA1 downregulation increased the sensitivity to BH3 mimetics and induced the activation of Bax which led to AML cell apoptosis [Citation33,Citation34]. However, the function of RPS6KA4 in the survival of AML cells was unknown. A previous study showed that the overexpression of element-binding protein (CREB1) increased AML cell growth by driving the expression of key regulators of apoptosis [Citation35]. The PPI results suggested that RPS6KA4 may enhance the survival and proliferation of AML cells by interacting with and phosphorylating CREB1.
Additionally, the current study identified 20 drugs or small molecules that low-risk patients exhibited greater sensitivity to and 38 drugs or small molecules that high-risk patients demonstrated more sensitivity to. The drugs or small molecules that high-risk patients had greater sensitivity to may be beneficial to patients with high-risk scores. Several of them have been reported to inhibit the survival of AML cells. For example, previous studies showed that Aurora kinase A inhibitor Alisertib and Aurora kinase B inhibitor Barasertib strongly inhibited the growth and proliferation of AML cells. ADC2014, a mTORC1/2 dual inhibitor, reduced pH in the acidic organelles, including lysosomes, and synergistically enhanced the cytotoxic effect of Gemtuzumab ozogamicin in primary leukemia cells [Citation36]. The combine of PIM and AKT kinase inhibitors (AZD5363) showed synergistic cytotoxicity in AML [Citation37]. Other drugs (like camptothecin, dactinomycin and dactolisib) were also verified to be useful for treating AML [Citation38,Citation39]. Further research is warranted to delve into the mechanism and availability of other drugs or small molecules in the clinical treatment of AML. These drugs may provide potential clues for precise treatment for AML patients with different risk scores.
In summary, the current study obtained two RSK genes linked to prognosis in AML patients. The constructed signature was helpful in predicting 1-year, 3-year, and 5-year OS. Of note, it was also confirmed that RPS6KA1 might be a novel drug target for the treatment of AML. The identified drugs or small molecules might provide new ideas for the therapy of AML patients with high expression of RPS6KA1.
Supplemental Material
Download JPEG Image (1 MB)
Acknowledgements
Thanks to all the contributors.
Disclosure statement
No potential conflict of interest was reported by the author(s).
Data availability statement
The datasets used or analyzed during the current study are available from the corresponding author on reasonable request.
Additional information
Funding
References
- Thomas D, Majeti R. Biology and relevance of human acute myeloid leukemia stem cells. Blood. 2017;129(12):1577–1585.
- Perl AE, Martinelli G, Cortes JE, et al. Gilteritinib or chemotherapy for relapsed or refractory flt3-mutated aml. N Engl J Med. 2019;381(18):1728–1740.
- Stein EM, DiNardo CD, Pollyea DA, et al. Enasidenib in mutant idh2 relapsed or refractory acute myeloid leukemia. Blood. 2017;130(6):722–731.
- DiNardo CD, Stein EM, de Botton S, et al. Durable remissions with ivosidenib in idh1-mutated relapsed or refractory aml. N Engl J Med. 2018;378(25):2386–2398.
- Vago L, Gojo I. Immune escape and immunotherapy of acute myeloid leukemia. J Clin Invest. 2020;130(4):1552–1564.
- Candon D. The effect of cancer on the labor supply of employed men over the age of 65. Econ Hum Biol. 2018;31:184–199.
- Ram R, Amit O, Zuckerman T, et al. Venetoclax in patients with acute myeloid leukemia refractory to hypomethylating agents-a multicenter historical prospective study. Ann Hematol. 2019;98(8):1927–1932.
- Estey EH. Acute myeloid leukemia: 2019 update on risk-stratification and management. Am J Hematol. 2018;93(10):1267–1291.
- Shallis RM, Wang R, Davidoff A, et al. Epidemiology of acute myeloid leukemia: recent progress and enduring challenges. Blood Rev. 2019;36:70–87.
- Zhang L, Ke W, Hu P, et al. N6-methyladenosine-related lncrnas are novel prognostic markers and predict the immune landscape in acute myeloid leukemia. Front Genet. 2022;13:804614.
- Fu D, Zhang B, Wu S, et al. Prognosis and characterization of immune microenvironment in acute myeloid leukemia through identification of an autophagy-related signature. Front Immunol. 2021;12:695865.
- Jones SW, Erikson E, Blenis J, et al. A xenopus ribosomal protein s6 kinase has two apparent kinase domains that are each similar to distinct protein kinases. Proc Natl Acad Sci USA. 1988;85(10):3377–3381.
- Fisher TL, Blenis J. Evidence for two catalytically active kinase domains in pp90rsk. Mol Cell Biol. 1996;16(3):1212–1219.
- Powell BL, Moser B, Stock W, et al. Arsenic trioxide improves event-free and overall survival for adults with acute promyelocytic leukemia: North American leukemia intergroup study c9710. Blood. 2010;116(19):3751–3757.
- Soignet SL, Frankel SR, Douer D, et al. United States multicenter study of arsenic trioxide in relapsed acute promyelocytic leukemia. J Clin Oncol: Off J American Soc Clin Oncol. 2001;19(18):3852–3860.
- Parmar S, Rundhaugen LM, Boehlke L, et al. Phase ii trial of arsenic trioxide in relapsed and refractory acute myeloid leukemia, secondary leukemia and/or newly diagnosed patients at least 65 years old. Leuk Res. 2004;28(9):909–919.
- Galvin JP, Altman JK, Szilard A, et al. Regulation of the kinase rsk1 by arsenic trioxide and generation of antileukemic responses. Cancer Biol Ther. 2013;14(5):411–416.
- Watanabe D, Nogami A, Okada K, et al. Flt3-itd activates rsk1 to enhance proliferation and survival of aml cells by activating mtorc1 and eif4b cooperatively with pim or pi3k and by inhibiting bad and bim. Cancers (Basel). 2019;11(12).
- Li Z, Herold T, He C, et al. Identification of a 24-gene prognostic signature that improves the European leukemianet risk classification of acute myeloid leukemia: an international collaborative study. J Clin Oncol: Off J American Soc Clin Oncol. 2013;31(9):1172–1181.
- Herold T, Metzeler KH, Vosberg S, et al. Isolated trisomy 13 defines a homogeneous aml subgroup with high frequency of mutations in spliceosome genes and poor prognosis. Blood. 2014;124(8):1304–1311.
- Kuett A, Rieger C, Perathoner D, et al. Il-8 as mediator in the microenvironment-leukaemia network in acute myeloid leukaemia. Sci Rep. 2016;5:18411.
- Herold T, Jurinovic V, Batcha AMN, et al. A 29-gene and cytogenetic score for the prediction of resistance to induction treatment in acute myeloid leukemia. Haematologica. 2018;103(3):456–465.
- Metzeler KH, Hummel M, Bloomfield CD, et al. An 86-probe-set gene-expression signature predicts survival in cytogenetically normal acute myeloid leukemia. Blood. 2008;112(10):4193–4201.
- Wagner GP, Kin K, Lynch VJ. Measurement of mrna abundance using RNA-Seq data: Rpkm measure is inconsistent among samples. Theory in Biosciences = Theorie in den Biowissenschaften. 2012;131(4):281–285.
- Chandrashekar DS, Bashel B, Balasubramanya SAH, et al. Ualcan: a portal for facilitating tumor subgroup gene expression and survival analyses. Neoplasia (New York, NY). 2017;19(8):649–658.
- Döhner H, Estey E, Grimwade D, et al. Diagnosis and management of aml in adults: 2017 eln recommendations from an international expert panel. Blood. 2017;129(4):424–447.
- Love MI, Huber W, Anders S. Moderated estimation of fold change and dispersion for RNA-Seq data with deseq2. Genome Biol. 2014;15(12):550.
- Yu G, Wang LG, Han Y, et al. Clusterprofiler: an r package for comparing biological themes among gene clusters. Omics: A J Integr Biol. 2012;16(5):284–287.
- Maeser D, Gruener RF, Huang RS. Oncopredict: an r package for predicting in vivo or cancer patient drug response and biomarkers from cell line screening data. Brief Bioinform. 2021;22(6):bbab260.
- Geeleher P, Cox N, Huang RS. Prrophetic: an r package for prediction of clinical chemotherapeutic response from tumor gene expression levels. PloS one. 2014;9(9):e107468.
- Szklarczyk D, Gable AL, Lyon D, et al. String v11: protein-protein association networks with increased coverage, supporting functional discovery in genome-wide experimental datasets. Nucleic Acids Res 2019;47(D1):D607–D613.
- Goldman SL, Hassan C, Khunte M, et al. Epigenetic modifications in acute myeloid leukemia: prognosis, treatment, and heterogeneity. Front Genet. 2019;10:133.
- Gores GJ, Kaufmann SH. Selectively targeting Mcl-1 for the treatment of acute myelogenous leukemia and solid tumors: Figure 1. Genes Dev. 2012;26(4):305–311.
- Czabotar PE, Lessene G, Strasser A, et al. Control of apoptosis by the bcl-2 protein family: Implications for physiology and therapy. Nat Rev Mol Cell Biol. 2014;15(1):49–63.
- Mitton B, Hsu K, Dutta R, et al. Small molecule screen for inhibitors of expression from canonical creb response element-containing promoters. Oncotarget. 2016;7(8):8653–8662.
- Mizutani Y, Inase A, Maimaitili Y, et al. An mtorc1/2 dual inhibitor, azd2014, acts as a lysosomal function activator and enhances gemtuzumab ozogamicin-induced apoptosis in primary human leukemia cells. Int J Hematol. 2019;110(4):490–499.
- Meja K, Stengel C, Sellar R, et al. Pim and akt kinase inhibitors show synergistic cytotoxicity in acute myeloid leukaemia that is associated with convergence on mtor and mcl1 pathways. Br J Haematol 2014;167(1):69–79.
- Lawal B, Kuo YC, Khedkar H, et al. Deciphering the immuno-pathological role of flt, and evaluation of a novel dual inhibitor of topoisomerases and mutant-flt3 for treating leukemia. Am J Cancer Res. 2022;12(11):5140–5159.
- Liu H, Hussain Z, Xie Q, et al. Targeting pi3k/akt/mtor pathway to enhance the anti-leukemia efficacy of venetoclax. Exp Cell Res. 2022;417(2):113192.