
 ?Mathematical formulae have been encoded as MathML and are displayed in this HTML version using MathJax in order to improve their display. Uncheck the box to turn MathJax off. This feature requires Javascript. Click on a formula to zoom.
ABSTRACT
Background
Autoimmune hemolytic anemia (AIHA) is caused by auto-antibodies, secreted by overactivated B cells, directed against self-red blood cells, resulting in hemolysis. It found that aberrant DNA methylation in B cells can induce the production of autoantibodies. Therefore, we attempted to explore if similar aberrant DNA methylation occur in AIHA patients.
Methods
A 49-year-old female wAIHA patient and a 47-year-old female healthy control (HC) were enrolled. Peripheral blood (PB) B cells DNA was extracted. After constructing genomic libraries, bisulfite genomic sequencing (BSP) and DNA methylation profiles were analyzed. BSP was verified using PB B cells from 10 patients with hemolysis, 10 patients with hemolytic remission, and 10 healthy controls (HCs) by Methylation-specific PCR.
Results
Total DNA methylation of whole-genome C bases (4.8%) and CG type bases (76.8%) in wAIHA patient were lower than those in the HC (5.3 and 82.5%, respectively) (p = 0.022 and p < 0.001). DNA methylation of C bases and CG type bases in whole-genome regulatory elements, such as coding sequence, up2Kb and down2Kb in the patient were also lower than those in the HC (p = 0.041, p = 0.038, and p = 0.029). 30,180 DNA-methylated regions (DMRs) on all 23 chromosomes were identified. DMR-related genes were mainly involved in the Rap1, phospholipase D, HIF-1, calcium, vascular endothelial growth factor (VEGF) and Ras signaling pathways.
Conclusion
The DNA methylation spectrum of B cells in AIHA patients is different from that of HC, and the proportion of hypo-methylation regions is higher than that of HC. DMR-related genes are mainly related to some signaling pathways.
1. Introduction
AIHA is an autoimmune disease (AID) characterized by autoantibodies against RBC surface antigens, which are generated and secreted by over-reactive B cells. These autoantibodies, accompanied by abnormal activation of the complement system in some patients, lead to the destruction of RBCs, causing hemolytic anemia [Citation1]. Based on the binding properties of autoantibodies, AIHA can be further divided into warm antibody AIHA (wAIHA), cold antibody AIHA, and mixed-type AIHA; wAIHA accounts for approximately 70% of AIHA cases [Citation2]. Although the use of glucocorticoids is effective in most patients, only approximately 30% of achieve complete remission, with hemolysis relapse in most [Citation3]. B cells play a pivotal role in the pathogenesis of autoimmune diseases and altered B-cell signaling and hyperactivated humoral responses are key drivers of human autoimmunity [Citation4]. In AIHA patients absolute B cell numbers were significantly increased with upregulation of activation markers [Citation5]. Duan N found that bruton’s tyrosine kinase (BTK) and phosphorylated BTK (p-BTK) increases in the B lymphocytes of AIHA patients [Citation6]. Therefore, it is necessary to understand the mechanisms that lead to B-cell activation in patients with wAIHA to identify potential therapeutic targets.
The term ‘epigenetics’ can be outlined as the meiotically/mitotically heritable alterations in gene expression without changes to the sequence of bases in the DNA [Citation7]. Epigenetic dysregulation directly influences the development of autoimmunity by regulating immune cell functions [Citation8]. Tanaka S provided clear evidence that an epigenetic regulator has a critical role in peripheral B cell tolerance and prevention of autoimmune disease [Citation9]. Many studies have highlighted the essential roles of epigenetic regulation in different B-cell subsets and this epigenetic regulation contributes to the pathogenesis of autoimmune diseases, including systemic lupus erythematosus (SLE), primary Sjögren’s syndrome (pSS), and rheumatoid arthritis (RA) [Citation10–12]. DNA methylation is one of the most studied epigenetic marks and methylation of the 5’ position of cytosines (5mC), in the context of CpG dinucleotides, is the main form of DNA methylation in mammals and is usually associated with gene suppression [Citation13]. Abnormal DNA methylation in B cells can induce the production of the autoantibodies and mediate the occurrence of AID [Citation14]. Recent findings underlined the critical role of DNA methylation in numerous autoimmune diseases by altering gene expression profiles [Citation15,Citation16]. We hypothesized that DNA methylation in peripheral blood B cells, which participate in the pathogenesis of AIHA, is decreased. We constructed and analyzed a wAIHA DNA methylation profile to further explore the mechanisms that lead to B cell overreaction and autoantibody secretion, in a patient with wAIHA who suffered a hemolytic episode, with an age- and sex-matched healthy control (HC). The peripheral B lymphocytes of 20 patients with wAIHA were used for verification.
2. Materials and methods
2.1. Study subjects
A 49-year-old female with wAIHA hospitalized in the Hematology Department in December 2020 and a 47-year-old female HC were enrolled for bisulfite genomic sequencing (BSP). 20 patients, including 10 with hemolysis and 10 patients in remission, and 10 HCs were enrolled for methylation-specific PCR (MSP) to verify the sequencing results of patients with hemolytic episodes and healthy control. All AIHA patients were diagnosed in accordance with Chinese guideline criteria [Citation17]. The clinical characteristics of the 20 patients are shown in .
Table 1. Clinical characteristics of wAIHA patients.
2.2. Separation and purification of peripheral blood B lymphocytes
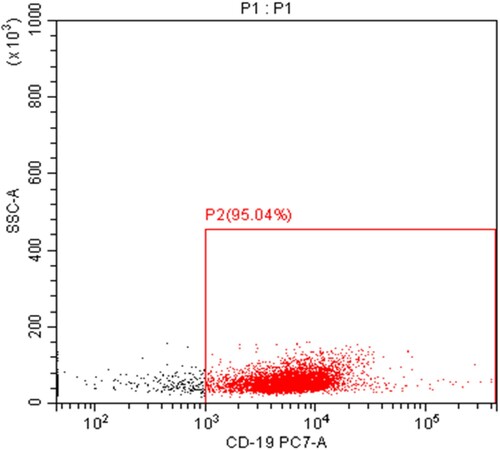
Peripheral venous blood (10 mL) was obtained from each subject, EDTA was added, and peripheral blood mononuclear cells were isolated using a Lymphocyte Separation Medium (Beijing Solarbio Science & Technology Co., Ltd., China). Anti-human CD19 magnetic beads (20 µl) and 80 µl separation buffer (Miltenyi Biotec, Germany) were added to 107 mononuclear cells. The suspension was fully mixed in the dark and incubated at 4°C for 15 min. Separation buffer (1 mL) was added, followed by pelleting the cells at 1500 rpm for 10 min. After discarding the supernatant, 500 µl separation buffer was added to resuspend the PBMCs. A magnetic cell sorting device was installed, and CD19+ B cells were separated according to the manufacturer’s instructions. Sorting purity was assayed by flow cytometry and was above 90% ().
Figure 1. The purity of CD19+ B lymphocytes separated by magnet-activated cell sorting (MACS) and the purity of CD19 positive B cells is greater than 95%.
2.3. DNA extraction, genomic library construction, and BSP
B-lymphocyte DNA was extracted according to the instructions of the DNA Isolation Mini Kit (Vazyme Biotech, China). DNA concentration and purity were measured by spectrophotometry. Genomic DNA samples were sheared into 100∼300 bp fragments using ultrasound [Citation18]. Their ends were repaired and connected with a methylation sequencing adapter. Fragments were modified with a DNA methylation modification kit (EZ DNA Methylation-Gold Kit; Zymo Research, CA, USA). After 2% agarose gel electrophoresis, fragments were selected based on their lengths. Appropriate DNA fragments were purified using a QIAquick Gel Extraction Kit (Qiagen, Germany), and PCR was used to amplify them.
2.4. BSP data analysis
Clean data were obtained after filtering the sequencing data, including decontamination and low-quality data removal. The clean data were mapped to the human reference genome using BSMAP software. Mapping and bisulfite conversion rates of each sample were calculated. The methylation level of site C in the whole genome was calculated using the formula:
where Nm represents the number of reads indicating methylated sites, while Nnm is the number of reads indicating non-methylated sites.
DMRs in B cells of the patient with AIHA were identified based on methylation levels of C sites in the whole genome compared with the HC. Each DMR contained at least five CG sites and the average methylation levels in this region were compared between the two samples. If the fold change of the average DNA methylation level in this region was ≥2 (p ≤ 0.05) by Fisher's exact test compared with the HC, then this region was to be a DMR. Gene ontology (GO) functional enrichment and Kyoto Encyclopedia of Genes and Genomes (KEGG) pathway enrichment analyses were performed on DMR-related genes [Citation19].
2.5. Validation of BSP data by MSP
Five DMRs identified by BSP were selected randomly, including two genes in which the DNA methylation of the promoter was significantly decreased (TCF4 and IL-18) and three genes with significantly elevated promoter DNA methylation (PTPN7, NOD2, and WT1). Based on the sequencing data, MSP primers were designed using online primer design tools (http://www.urogene.org/methprimer/index.html) (). An additional 10 patients with hemolytic wAIHA, 10 with wAIHA in remission, and 10 HCs were enrolled. B-lymphocytes from each group were isolated and purified as described above. DNA was extracted and modified using an EpiArtTM DNA Methylation Bisulfite Kit (Vazyme Biotech). After PCR amplification and agarose gel electrophoresis of the bisulfite transformation DNA products, MSP data were obtained using a gel imaging analysis system (Guangzhou Biolight Biotechnology Co., Ltd., China).
Table 2. The primer sequences for methylation specific PCR.
2.6. Statistical analysis
All analyses were performed using SPSS 22.0. Data are expressed as means ± standard deviation. Comparisons between two groups were analyzed using Student’s t-test. One-way analysis of variance was used for multiple independent groups. Fisher's exact test was used to analyze the data. Statistical significance was set at p < 0.05. GraphPad Prism 6 software was used to visually depict the statistical analyses.
3. Results
3.1. Sequencing library construction
Sequencing data were more than 90% clean, which met the requirements for further analysis (). A shows the base content distribution of the clean reads. The left part represents strand 1, which was directly obtained during sequencing. Because of bisulfite modification, the unmethylated cytosine (C) was converted to uracil (U) and then to thymine (T). The T content was relatively high, whereas C content was relatively low in strand 1. The right part shows the base content distribution of complementary strand 2. The adenine (A) content was relatively high, and the guanine (G) content was relatively low, which corresponded to strand 1. B shows the sequencing quality distribution of bases in the clean reads. During sequencing, the quality of most of the bases was greater than 35 (Q > 35), while the proportion of low-quality (Q < 20) bases was extremely low. Clean read base content distribution and base sequencing quality distribution indicated the reliability of the BSP data. The base content distribution and base mass distribution maps initially verified the reliability of the sequencing results. In summary, the data used for database construction meets the standards and can be used for methylation analysis.
Figure 2. (A) After getting the original data, first filter the data, including decontamination and low-quality data, to get ‘clean read’. The base content distribution of clean reads. The horizontal axis indicates the base position on the reads and vertical axis indicates the proportion of the bases. The left part represents strand 1 which was obtained directly during the sequencing process. The content of T bases was relatively high and the content of C bases was relatively low. The right part represents the base contents distribution of complementary strand 2, and the content of adenine (A) was relatively high, the content of guanine (G) was relatively low which was corresponding to strand 1. (B) The base quality distribution of clean reads. The horizontal axis indicates the base position on the reads and vertical axis indicates the base sequencing quality. Each point in the figure represents the sequencing quality of the corresponding base in reads. The figure indicates that the distribution of base content and quality distribution meet the standards for further analysis.
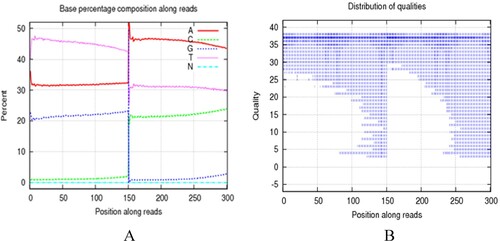
Table 3. The basic processing and quality control of the sequencing data.
3.2. Mapping, depth, and coverage of C sites
After clean read acquisition, BSMAP was used to map the clean reads to the human genome. Mapping rates were greater than 95%. The bisulfite conversion rate was approximately 99%. The sequencing depth of C-sites for each sample was more than 18X and coverage were both greater than 85% ().
Table 4. Mapping results of the sequencing data and QC control.
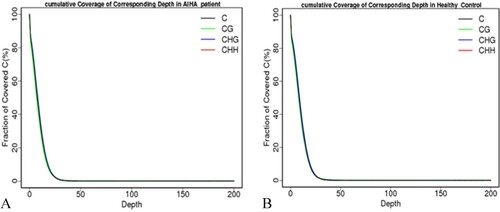
Sequencing depth was approximately evenly distributed (). The depth cumulative distribution curves for different types of C bases in the patient with AIHA and the HC roughly coincided. The proportion of C bases with sequencing depths of no less than 20X accounted for approximately 80% of all C bases in the whole genome. The coverages of C sites within the range of all chromosomes and regulatory elements in whole genomes of the patient with AIHA and the HC were approximately 80%. These data met the criteria for further analysis ().
Figure 3. The sequencing depth distribution of (A) autoimmune hemolytic anemia (AIHA) patient and (B) healthy control. The horizontal axis represents the sequencing depth and the vertical axis is the percentage of the whole genome bases corresponding to the sequencing depth. The sequencing depth corresponding to the highest point of the curve is close to or consistent with the average coverage depth of the entire genome, and the distribution map shows that the sequencing data results are roughly evenly distributed.
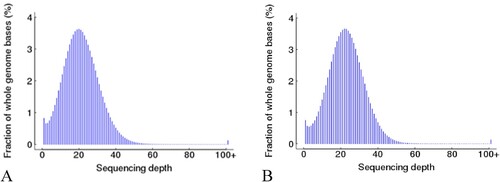
Figure 4. The cumulative sequencing depth distribution of C bases in (A) autoimmune hemolytic anemia (AIHA) patient and (B) Health Control. The horizontal axis represents the sequencing depth and the vertical axis represent the percentage of covered C bases which sequencing depth is no less than the corresponding sequencing depth. The proportion of C bases in the entire genome is approximately 80%, and the cumulative distribution curves of sequencing depth for different types of C bases roughly overlap.
The above suggests that the coverage of C sites within the range of chromosomes and various types of regulatory elements in the entire genome meets the analysis standards.
3.3. Whole-genome DNA methylation in AIHA
Methylation level of the C base was calculated as the number of sequences covering this site, which supported methylated C sites divided by the total number of sequences effectively covering this site during sequencing. The total DNA methylation levels of whole-genome C bases (4.848%) and CG type bases (76.793%) in the patient were lower than those in the HC (5.335% and 82.504%) (p = 0.022 and p < 0.001). DNA methylation levels of C bases and CG type bases in regions of the whole genome regulatory element, such as coding sequence, up2Kb and down2Kb in the patient with AIHA were lower than those in the HC (p = 0.041, p = 0.038, and p = 0.029) ( and ). This result shows the degree of methylation of the c base contained on each chromosome of AIHA patients and healthy controls.
Table 5. The average DNA methylation level of all chromosomes and regulatory elements in the whole genome of wAIHA patient.
Table 6. The average DNA methylation level of all chromosomes and regulatory elements in the whole genome of HCs.
3.4. GO functional enrichment and KEGG pathway enrichment analyses
shows the number of CG-base DMRs detected and the total length of DMRs on each chromosome in the patient with AIHA compared with the HC. DMR-related genes and genes corresponding to DMR-related promoters were identified. Compared with the HC, the top 10 DMR-related genes and the top 10 genes corresponding to DMR-related promoters, in which DNA methylation levels were significantly increased or decreased in B cells of the patient with AIHA are shown ( and ; and ). We have identified genes and promoter regions with significant differences in methylation degree between AIHA patients and healthy controls.
Figure 5. Compared with healthy control, top 10 DNA-methylated regions (DMRs)-related genes which the DNA methylation level significantly increased or decreased in B cells of AIHA patient.
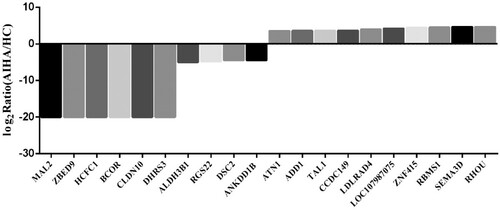
Figure 6. Compared with healthy control, the top 10 genes corresponding to DNA-methylated regions (DMRs)-related promotor regions which the DNA methylation level significantly increased or decreased in B cells of AIHA patient.
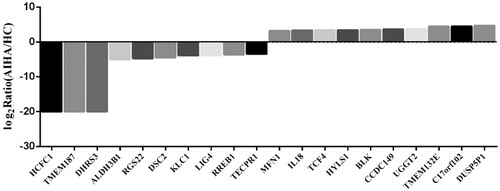
Table 7. The differential methylation regions between AIHA patients and HCs.
Table 8. Top 10 significantly altered DMRs related genes in B cells from AIHA patient.
Table 9. Top 10 significantly altered genes corresponding to DMRs related promotor regions in B cells of AIHA patient.
GO functional enrichment analysis was performed for DMR-related genes. The top 10 genes with the most significant enrichment were selected for each of the three types of gene ontology (A). KEGG pathway enrichment analysis was performed for DMR-related genes; the top 20 pathways with the most significant enrichment are shown in B. Through analysis, it was found that DMR-related genes are mainly involved in Rap1, phospholipase D, HIF-1, calcium, VEGF, and Ras signaling pathways, regulation of transient receptor potential ion channels in the inflammatory response, and the process of neurotransmitter transmission.
Figure 7. (A) Gene ontology (GO) functional enrichment analysis of DMRs-related genes. (B) Kyoto encyclopedia of genes and genomes (KEGG) pathway enrichment analysis of DNA-methylated regions (DMRs)-related genes. (C) GO functional enrichment analysis of genes corresponding to DNA-methylated regions (DMRs)-related promoter regions. (D) KEGG pathway enrichment analysis of genes corresponding to DNA-methylated regions (DMRs)-related promoter regions.
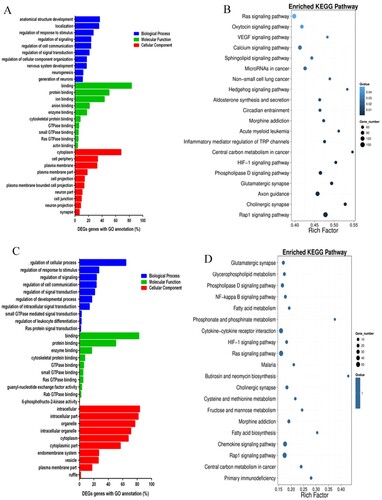
GO functional enrichment analysis was performed for DMR-related promoters. The top 10 genes with the most significant enrichment were selected for each of the three types of gene ontology (C). KEGG pathway enrichment analysis was also performed, and the top 20 pathway items with the most significant enrichment are shown in D. It found that genes corresponding to DMR-related to promoter regions are mainly involved in Rap1, cytokines, Ras, HIF-1, NF-κB, and phospholipase D signaling pathways, biosynthesis of fatty acids, metabolism of fructose, mannose, fatty acid, phosphonate, phosphinate, and glycerol-phospholipid, primary immune deficiency, and the interaction of cytokines and their receptors.
3.5. Verification of BSP using MSP
An additional 10 patients with hemolytic wAIHA, 10 with remission wAIHA, and 10 HCs were enrolled in the study. B lymphocytes from each were isolated and purified. Their DNA was extracted and modified. After PCR amplification and agarose gel electrophoresis of the bisulfite transformation DNA products, MSP data were quantified using a gel imaging system. DNA products that could be amplified by methylation primers were to be methylated in the promoter, and those that could be amplified by non-methylation primers were to be unmethylated in the promoter. DNA products that could be amplified by both methylation and non-methylation primers were to be partially methylated in the promoter.
The methylation status of the NOD2 promoter region in B cells was assessed. In one case, no target product was amplified by non-methylation or methylation-primers. Among the remaining 29 cases, there were 10 cases in the hemolytic group, 10 cases in the remission group, and 9 cases in the HC group. In the hemolytic group, methylation and partial methylation were present in six and four cases, respectively, while non-methylation was absent in the NOD2 promoter in peripheral blood B cells. In the remission group, methylation and partial methylation were present in six and four cases, respectively, while non-methylation was absent. In the HC group, methylation and partial methylation were present in eight and one case, respectively, while non-methylation absent. The percentage of cases in which the NOD2 promoter was methylated in the B cells of patients with AIHA (60%) was less than that in HCs (88.9%). However, methylation of the NOD2 promoter was not significantly different among the three groups according to Fisher’s exact test (p = 0.311) (A and ).
Figure 8. (A) Methylation status of NOD2 gene promoter region in peripheral blood B cells. The proportion of methylation in the NOD2 gene promoter region of peripheral blood B cells in AIHA patients (60%) is lower than that in healthy controls (88.9%), but there was no statistical difference. (B) Methylation status of TCF4 gene promoter region in peripheral blood B cells. The proportion of unmethylated TCF4 gene promoter region in peripheral blood B cells of AIHA patients (21.1%) is lower than that of healthy controls (40%), which also lacks statistical significance.
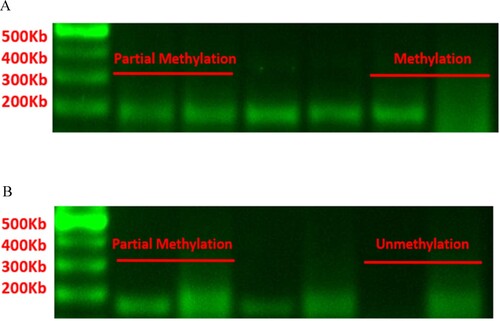
Table 10. Methylation status of NOD2 gene promoter region in peripheral blood B cells of AIHA patients and HCs.
The methylation status of TCF4 promoter in B cells was assessed. In one case, no target product was amplified by non-methylation or methylation primers. Among the remaining 29 cases, there were nine cases in the hemolytic group, 10 cases in the remission group, and 10 cases in the HCs. In the hemolytic group, methylation was absent, partial methylation was present in seven cases, and non-methylation was present in two cases for the TCF4 promoter. In the remission group, methylation was absent, while partial methylation and non-methylation were present in eight and two cases, respectively. In HCs, methylation was absent, partial methylation in six cases, and non-methylation in four cases. The percentage of cases in which the TCF4 promoter was non-methylated in peripheral blood B cells of patients with AIHA (21.1%) was lower than that in HCs (40%). However, methylation of the TCF4 promoter was not significantly different among the three groups according to Fisher’s exact test (p = 0.563) (B and ).
Table 11. Methylation status of TCF4 gene promoter region in peripheral blood B cells of AIHA patients and HCs.
The degree of NOD2 gene promoter methylation in peripheral blood B cells of AIHA patients was lower than that of healthy controls, while the degree of TCF4 gene promoter methylation was higher than that of healthy controls, consistent with BSP sequencing results, but lacking statistical differences.
The promoters of the WT1 and PTPN7 genes were methylated in all DNA samples analyzed by MSP. In our methylation analysis of the IL-18 promoter, we found no amplification by either non-methylation or methylation primers designed using online tools in any DNA sample. It showed that the WT1 and PTPN7 gene promoters of AIHA patients and healthy controls were all methylated, and there was no difference between the two groups, and there was no difference in the methylation of the IL-18 promoter region between the two groups.
4. Discussion
BSP is the gold standard for DNA methylation studies, as it provides accurate data for single cytosine bases (C-bases) in the whole genome [Citation20]. After our construction of the B-cell BSP methylation profile in AIHA, more DMRs and DMR-related downstream genes were identified. The specific mechanisms by which abnormal B cell DNA methylation participates in the pathogenesis of AIHA needs to be further explored.
In this study, we found that total DNA methylation levels of both C and CG type bases in the patient with AIHA were lower than those in the HC. In the patient with AIHA, DNA methylation levels of C bases and CG type bases in regions of the whole genome regulatory element, such as coding sequence, up2Kb, down2Kb, and mRNA regions, were lower than those in the HC. These data preliminarily demonstrate that DNA methylation profiles differ between patients with AIHA and HC. A total of 30,180 DMRs were identified on 23 chromosomes of the patient with AIHA. There are two types of corresponding relationships between DMRs and their downstream genes. First, any regions identified as DMRs can be screened into the Gene List as DMR-related genes. Second, only promoters identified as DMRs can be screened into the Gene List as genes corresponding to DMR-related promoters. Studies have found that the pathways enriched by the KEGG public database for downstream genes screened by two different corresponding relationships overlap. Phospholipase D (PLD), HIF-1, Rap1, and Ras signaling pathways were enriched in two different analyses. Many studies have found that abnormal activation of these signaling pathways is correlated with the occurrence of multiple AIDs.
PLD on the surface of mammalian cells catalyzes the hydrolysis of phosphatidylcholine to produce choline and phosphatidic acid, which function as secondary messengers to transmit signals and promote the transport of vesicles [Citation21]. Among the PLD protein family, PLD1 and PLD2 are two major subtypes that have been extensively studied. Lymphocyte adhesion and transport through the endothelial barrier are key factors that mediate the development of central nervous system immune diseases such as multiple sclerosis. PLD1 expression is elevated in the lymphocytes of patients with multiple sclerosis, where it plays a central role in immune cell migration [Citation22]. PLD-2 signaling promotes chemotaxis, migration, and cytoskeletal remodeling of immune cells, which participate in the pathogenesis of multiple AIDs [Citation23]. It has been reported that PLD2 mutations may be involved in familial systemic lupus erythematosus by inhibiting PLD2-RAS signaling and downregulating Ras activity [Citation24].
Recent studies have shown that HIF-1 signaling regulates the development and differentiation of multiple immune cells. HIF-1 induces the transformation of macrophages into M1 macrophages that participate in the anti-infection immune response by producing IL-1β, inducible nitric oxide synthase, and other proinflammatory cytokines [Citation25]. It also induces the expression of the co-stimulatory factors CD80 and CD86 on dendritic cells to promote T-cell proliferation [Citation26]. It also inhibits Treg development by binding Foxp3 and promoting its degradation. Studies have also indicated that HIF-1 directly activates the transcription factor RORγt and glycolysis pathway to promote the development of Th17 cells that are involved in innate immunity and inflammation, resulting in the overexpression of IL-17, which mediates the early inflammatory response and histopathological damage [Citation27]. Additionally, HIF-1 plays an important role in the proliferation and differentiation of progenitor B cells, regulating the development of B1 and B2 cell subsets. It has been shown that the expression level of CD45 (B220) on the surface of B1 cells in the peritoneal cavity of HIF1A-deficient murine Hif1a-/-Rag2-/- model was significantly increased, and B2 cells matured abnormally with increased autoreactivity [Citation28].
Abnormal activation of the HIF-1 signaling pathway correlates with the occurrence of many AIDs, including rheumatoid arthritis. The expression of HIF-1 is significantly increased, and its level is significantly associated with the number of new blood vessels in the synovial tissue of patients with rheumatoid arthritis [Citation28]. The expression of HIF-1 promotes the proliferation of Th1 and Th17 cells, which is mediated by synovial fibroblasts, resulting in the production of IFN-γ and IL-17 [Citation29]. In addition, the inflammatory response in synovial tissues is promoted by activation of the HIF-1/IL-33 signaling pathway [Citation30]. HIF-1 also participates in the proliferation and migration of fibroblast-like synovial cells mediated by matrix metalloproteinases [Citation31]. HIF-1 promotes glycolysis in osteoclasts and synovial cells to produce a large amount of ATP, leading to pathological bone damage in patients with rheumatoid arthritis [Citation32]. It has been shown that the expression of HIF-1 is elevated in the skin and serum of patients with psoriasis [Citation33]. It promotes angiogenesis by promoting the expression of VEGF and inducing keratinocyte proliferation through glucose transporter member-1 [Citation34]. HIF-1 directly activates the transcription factor RORγt to promote Th17 cell differentiation and IL-17 production [Citation35]. Th17 cells promote the secretion of inflammatory cytokines such as IL-6 and IL-8 by keratinocytes, which play an important role in the maintenance of chronic inflammation in patients with psoriasis. In conclusion, HIF-1 is a potential therapeutic target for numerous AIDs.
The Rap1 signaling pathway also regulates the development and differentiation of multiple immune cells and responses [Citation36]. Overactivation of Rap1 signaling leads to inhibition of double-positive T cell proliferation in the thymus [Citation37]. Meanwhile, activation of Rap1 signaling induces the expression of lymphocyte function-associated antigen-1 and mediates its binding with its ligand intercellular adhesion molecule-1 to promote the formation of immune synapses between T cells and antigen-presenting cells. However, overactivation of Rap1 signaling results in T-cell anergy through inhibition of RAS-ERK signaling [Citation38]. The Rap1 signaling pathway also regulates the differentiation and development of B cells and the development of immune tolerance [Citation39]. After developing into immature B cells in the bone marrow, some B cells recognize self-antigens and have a tendency for autoimmunity. These immature B cells establish central immune tolerance through clonal deletion, receptor editing, and anergy [Citation40]. During receptor editing, the light chain Vκ gene is expressed and rearranged, resulting in the synthesis of a new light chain to replace the self-reactive light chain and allowing further development of the B cells. Overactivation of Rap1 signaling promotes the expression of the transcription factor OcaB through downstream p38MAPK signaling, which leads to the gradual transition from light chain Vκ gene expression and rearrangement to Vλ gene expression and rearrangement, resulting in the allelic fusion of Vκ and Vλ genes [Citation41]. B cells arising from incomplete receptor editing have a tendency to self-react and migrate to the peritoneal cavity to become B1a cells. A large number of autoantibodies are produced and secreted from B1a cells after receiving peripheral self-antigen stimulation through class switching and affinity maturation, which mediates the occurrence of AIDs [Citation42]. Minato et al. found that leukemia occurred in some Spa1-/- mice, characterized by overactivation of the Rap1 signaling pathway, in which the phenotype of malignant cells was identical to that of B1a cells (CD5 + Mac-1 + B220+) [Citation43]. The production of anti-RBC autoantibodies and the onset of hemolytic anemia were also observed in a few Spa1-/- mice, with clinical features similar to those of chronic lymphocytic leukemia in humans.
The Rap1 signaling pathway was significantly enriched in the KEGG pathway enrichment analysis for DMR-related genes. Its activation may promote the expression of transcription factor OcaB via p38MAPK signaling, induce the allelic fusion of Vκ and Vλ genes during receptor editing, and promote the proliferation of self-reactive B1a cells, which mediate the occurrence of AIHA.
In this study, we used MSP with many patients to verify our BSP data from a single patient. The methylation of the NOD2 promoter in peripheral blood B cells of patients with AIHA was lower than that in HCs. The methylation level of the TCF4 promoter region was higher than that of HCs. These data were consistent with those obtained by BSP. However, Fisher's exact test indicated that there were no significant differences in methylation of the NOD2 or TCF4 promoters among the groups, which may be related to small sample size. BSP can only roughly describe and analyze the DNA methylation profile of B cells in patients with AIHA, so our results need to be further verified by MSP with large sample sizes. However, GO functional enrichment and KEGG pathway enrichment analyses for DMR-related genes provides a direction for further research on the mechanism of B cell hyperimmunity caused by abnormal DNA methylation in AIHA.
5. Conclusions
The total DNA methylation level of whole genome C bases and CG type bases in peripheral blood B cells of patients with wAIHA was reduced, and the DNA methylation profile of B lymphocytes of the patient with AIHA was different from that of the HC, but the studies with larger samples will clarify if these differences are statistically significant. Functional enrichment and pathway enrichment analyses of DMR-related genes suggest that activation of the Rap1 signaling pathway may lead to B lymphocyte over-immunity and autoantibody production in patients with AIHA.
Ethics approval and consent to participate
All study participants provided informed consent. The study design was approved by the Ethics Committee of Tianjin Medical University General Hospital and was performed in accordance with the Declaration of Helsinki.
Acknowledgements
The authors thank Editage (www.editage.cn) for English language editing.
Disclosure statement
No potential conflict of interest was reported by the author(s).
Additional information
Funding
References
- Bass GF, Tuscano ET, Tuscano JM. Diagnosis and classification of autoimmune hemolytic anemia. Autoimmun Rev. 2014;13(4-5):560–564. doi:10.1016/j.autrev.2013.11.010
- Jäger U, Barcellini W, Broome CM, et al. Diagnosis and treatment of autoimmune hemolytic anemia in adults: recommendations from the first international consensus meeting. Blood Rev. 2020;41:100648. doi:10.1016/j.blre.2019.100648
- Brodsky RA. Warm autoimmune hemolytic anemia. N Engl J Med. 2019;381(7):647–654. doi:10.1056/NEJMcp1900554
- Xiao F, Rui K, Shi X, et al. Epigenetic regulation of B cells and its role in autoimmune pathogenesis. Cell Mol Immunol. 2022;19(11):1215–1234. doi:10.1038/s41423-022-00933-7
- Zhu H, Xu W, Liu H, et al. Expression of activated molecules on CD5(+)B lymphocytes in autoimmune hemolytic anemia. Int J Hematol. 2016;103(5):545–553. doi:10.1007/s12185-016-1964-8
- Duan N, Zhao M, Wang Y, et al. Expression of BTK/p-BTK is different between CD5+ and CD5- B lymphocytes from autoimmune hemolytic anemia/Evans syndromes. Hematology. 2019;24(1):588–595. doi:10.1080/16078454.2019.1652005.
- Bird A. Perceptions of epigenetics. Nature. 2007;447(7143):396–398. doi:10.1038/nature05913
- Moosavi A, Motevalizadeh AA. Role of epigenetics in biology and human diseases. Iran Biomed J. 2016;20(5):246–258. doi:10.22045/ibj.2016.01.
- Tanaka S, Ise W, Inoue T, et al. Tet2 and Tet3 in B cells are required to repress CD86 and prevent autoimmunity. Nat Immunol. 2020;21(8):950–961. doi:10.1038/s41590-020-0700-y
- Rawlings DJ, Metzler G, Wray-Dutra M, et al. Altered B cell signalling in autoimmunity. Nat Rev Immunol. 2017;17:421–436. doi:10.1038/nri.2017.24
- Du W, Han M, Zhu X, et al. The multiple roles of B cells in the pathogenesis of Sjögren’s syndrome. Front Immunol. 2021;12:2180. doi:10.3389/fimmu.2021.684999.
- Ma K, Wang X, Shi X, et al. The expanding functional diversity of plasma cells in immunity and inflammation. Cell Mol Immunol. 2020;17:421–422. doi:10.1038/s41423-019-0308-z
- Schubeler D. Function and information content of DNA methylation. Nature. 2015;517(7534):321–326. doi:10.1038/nature14192
- Picascia A, Grimaldi V, Pignalosa O, et al. Epigenetic control of autoimmune diseases: from bench to bedside. Clin Immunol. 2015;157(1):1–15. doi:10.1016/j.clim.2014.12.013
- Paul DS, Teschendorff AE, Dang MA, et al. Increased DNA methylation variability in type 1 diabetes across three immune effector cell types. Nat Commun. 2016;7:13555. doi:10.1038/ncomms13555
- Tahara T, Hirata I, Nakano N, et al. Comprehensive DNA methylation profiling of inflammatory mucosa in ulcerative colitis. Inflamm Bowel Dis. 2017;23(1):165–173. doi:10.1097/MIB.0000000000000990
- Red Blood Cell Disease (Anemia) Group, Chinese Society of Hematology, Chinese Medical Association. [Chinese expert consensus on the diagnosis and treatment of autoimmune hemolytic anemia (2017) Red blood cell disease (anemia)]. Chin J Hematol. 2017;38(4):265–267. doi:10.3760/cma.j.issn.0253-2727.2017.04.001.
- Simpson JT, Workman RE, Zuzarte PC, et al. Detecting DNA cytosine methylation using nanopore sequencing. Nat Methods. 2017;14(4):407–410. doi:10.1038/nmeth.4184.
- Carmona-Saez P, Chagoyen M, Tirado F, et al. GENECODIS: a web-based tool for finding significant concurrent annotations in gene lists. Genome Biol. 2007;8(1):R3. doi:10.1186/gb-2007-8-1-r3.
- Gouil Q, Keniry A. Latest techniques to study DNA methylation[J]. Essays Biochem. 2019;63(6):639–648. doi:10.1042/EBC20190027
- Bowling FZ, Frohman MA, Airola MV. Structure and regulation of human phospholipase D[J]. Adv Biol Regul. 2021;79:100783. doi:10.1016/j.jbior.2020.100783
- Göbel K, Schuhmann MK, Pankratz S, et al. Phospholipase D1 mediates lymphocyte adhesion and migration in experimental autoimmune encephalo- myelitis. Eur J Immunol. 2014;44(8):2295–2305. doi:10.1002/eji.201344107
- Frohman MA. The phospholipase D superfamily as therapeutic targets. Trends Pharmacol Sci. 2015;36(3):137–144. doi:10.1016/j.tips.2015.01.001
- Peng L, Yuan X, Chen L, et al. Identification and functional analysis of a novel phospholipase D2 gene mutation associated with familial systemic lupus erythematosus. Zhong Nan Da Xue Xue Bao Yi Xue Ban. 2021;46(3):234–239. doi:10.11817/j.issn.1672-7347.2021.190589.
- You L, Wu W, Wang X, et al. The role of hypoxia-inducible factor 1 in tumor immune evasion[J]. Med Res Rev. 2021;41(3):1622–1643. doi:10.1002/med.21771
- Wobben R, Hüsecken Y, Lodewick C, et al. Role of hypoxia inducible factor-1α for interferon synthesis in mouse dendritic cells. Biol Chem. 2013;394(4):495–505. doi:10.1515/hsz-2012-0320
- McGettrick AF, O'Neill LAJ. The role of HIF in immunity and inflammation. Cell Metab. 2020;32(4):524–536. doi:10.1016/j.cmet.2020.08.002
- Guo X, Chen G. Hypoxia-inducible factor Is critical for pathogenesis and regulation of immune cell functions in rheumatoid arthritis. Front Immunol. 2020;11:1668. doi:10.3389/fimmu.2020.01668.
- Hu F, Mu R, Zhu J, et al. Hypoxia and hypoxia-inducible factor-1α provoke toll-like receptor signalling-induced inflammation in rheumatoid arthritis. Ann Rheum Dis. 2014;73(5):928–936. doi:10.1136/annrheumdis-2012-202444
- Hu F, Shi L, Mu R, et al. Hypoxia-inducible factor-1α and interleukin 33 form a regulatory circuit to perpetuate the inflammation in rheumatoid arthritis. PLoS One. 2013;8(8):e72650. doi:10.1371/journal.pone.0072650
- Li G, Zhang Y, Qian Y, et al. Interleukin-17A promotes rheumatoid arthritis synoviocytes migration and invasion under hypoxia by increasing MMP2 and MMP9 expression through NF-κB/HIF-1α pathway. Mol Immunol. 2013;53(3):227–236. doi:10.1016/j.molimm.2012.08.018
- Morten KJ, Badder L, Knowles HJ. Differential regulation of HIF-mediated pathways increases mitochondrial metabolism and ATP production in hypoxic osteoclasts. J Pathol. 2013;229(5):755–764. doi:10.1002/path.4159
- Rosenberger C, Solovan C, Rosenberger AD, et al. Upregulation of hypoxia- inducible factors in normal and psoriatic skin. J Invest Dermatol. 2007;127(10):2445–2452. doi:10.1038/sj.jid.5700874
- Tao J, Yang J, Wang L, et al. Expression of GLUT-1 in psoriasis and the relationship between GLUT-1 upregulation induced by hypoxia and proliferation of keratinocyte growth. J Dermatol Sci. 2008;51(3):203–207. doi:10.1016/j.jdermsci.2008.04.012
- Kagami S, Rizzo HL, Lee JJ, et al. Circulating Th17, Th22, and Th1 cells are increased in psoriasis. J Invest Dermatol. 2010;130(5):1373–1383. doi:10.1038/jid.2009.399
- Cantrell DA. GTPases and T cell activation[J]. Immunol Rev. 2003;192:122–130. doi:10.1034/j.1600-065X.2003.00028.x
- Johansen KH, Golec DP, Thomsen JH, et al. PI3K in T cell adhesion and trafficking. Front Immunol. 2021;12:708908. doi:10.3389/fimmu.2021.708908
- Khan U, Ghazanfar H. T lymphocytes and autoimmunity. Int Rev Cell Mol Biol. 2018;341:125–168. doi:10.1016/bs.ircmb.2018.05.008
- Christian SL, Lee RL, McLeod SJ, et al. Activation of the Rap GTPases in B lymphocytes modulates B cell antigen receptor-induced activation of Akt but has no effect on MAPK activation. J Biol Chem. 2003;278(43):41756–41767. doi:10.1074/jbc.M303180200
- Wang Y, Liu J, Burrows PD, et al. B cell development and maturation. Adv Exp Med Biol. 2020;1254:1-22. doi:10.1007/978-981-15-3532-1_1
- Ishida D, Su L, Tamura A, et al. Rap1 signal controls B cell receptor repertoire and generation of self-reactive B1a cells. Immunity. 2006;24(4):417–427. doi:10.1016/j.immuni.2006.02.007
- Morris G, Puri BK, Olive L, et al. Emerging role of innate B1 cells in the pathophysiology of autoimmune and neuroimmune diseases: association with inflammation, oxidative and nitrosative stress and autoimmune responses. Pharmacol Res. 2019;148:104408. doi:10.1016/j.phrs.2019.104408
- Minato N, Kometani K, Hattori M. Regulation of immune responses and hematopoiesis by the Rap1 signal. Adv Immunol. 2007;93:229–264. doi:10.1016/S0065-2776(06)93006-5