
ABSTRACT
Objective:
To explore the prognostic value of red blood cell distribution width (RDW) in newly diagnosed aplastic anemia (AA) patients treated with cyclosporine A (CsA) plus androgen or CsA alone.
Methods:
We retrospectively analyzed the clinical outcome of 220 patients with AA. According to the baseline level of RDW before treatment, the patients were divided into the high-RDW group (RDW ≥ 15%) and the normal-RDW group (RDW < 15%).
Results:
The median RDW of non-severe AA (NSAA) and severe AA (SAA) patients was 15.65% and 15.35%, respectively; this were significantly higher than that of very severe AA (VSAA) patients (13.35%). With median follow-up being 46 months, AA patients in the high-RDW group showed better 5-year OS and PFS than the normal-RDW group (93%: 75.3%; 74.3%: 61%). There was a higher ORR in the high-RDW group than the normal-RDW group (68.7%: 52.3%). The ORR of NSAA patients in the high-RDW group was better than that in the normal RDW group (75.8%: 60%). The 5-year OS of SAA/VSAA patients in the high-RDW group was significantly higher than the normal-RDW group (81.8%: 50.8%).
Conclusion:
This is the first documentation on the prognostic value of RDW in AA patients receiving CsA treatment with long-term follow-up, which had shown that high RDW at diagnosis was a better prognostic factor.
Introduction
Red blood cells (RBC) are the most common type of blood cells. Normally, the size of RBCs varies from 80 to 100 fL in the blood [Citation1,Citation2]. Under particular circumstances, the volume of RBCs may be subjected to remarkable increase or decrease. The degree of heterogeneity of RBC volume, which is traditionally known as anisocytosis, is conventionally quantified by means of a simple equation, in which the standard deviation (SD) of RBC volumes is divided by the mean corpuscular volume (MCV) of the erythrocytes, and then further multiplied for 100, to express data as a percentage (i.e. [SD of RBC volumes]/[MCV] × 100); the result of this equation is finally known as RBC distribution width (RDW) [Citation1]. The RDW value below the conventional reference range is infrequent and clinically meaningless, whereas a higher RDW value than the upper limit of the normal reference range suggested an increase in RBC volume heterogeneity [Citation2].
RDWs are used to differentiate the causes of anemia in recent decades. RDW is in a standard size, but a variety of diseases cause a higher RDW [Citation3]. Recent studies have reported the association between high RDW levels and poor prognosis in patients with cardiovascular disease, diabetes, acute kidney injury, hepatitis B, chronic obstructive pulmonary disease, malignant tumor and venous thrombosis [Citation4–11], whereas inflammation may be a bridge linking RDW with poor prognosis in a variety of diseases [Citation1]. Inflammatory factors lead to the impairment of erythrocyte maturity and the narrowing of erythrocyte life span by the impairment of iron metabolism and disruption of response erythropoietin (EPO), thus resulting in an extensive erythrocytes size heterogeneity and increasing RDW levels [Citation12–14]. It has been found that inflammation is the leading mechanism responsible for the presence of anisocytosis in patients with CVD [Citation4]. Atherosclerosis occurs because of multiple metabolic derangements, which essentially include dyslipidemia, inflammation and thrombosis [Citation15]. Hypoxia, secondary to the obstruction of pulmonary arteries may also cause hyperactivation of both neurohormonal and adrenergic pathways, thus finally triggering the release of proinflammatory cytokines [Citation16]. In patients with venous thromboembolism, RDW may hence be elevated because of the mechanisms mentioned above [Citation1].
Aplastic anemia (AA) is a rare bone marrow failure syndrome [Citation17]. Many inflammatory factors derived from hyperactive T cells lead to bone marrow stem progenitor cell injury, which plays an important role in the pathogenesis of AA and provides a theoretical basis for the immunosuppressive treatment (IST) of AA. So far, there have been no reports on the prognostic value of RDW in patients with AA treated with IST. This study attempted to explore the relationship between baseline RDW level before the treatment and prognosis in AA patients treated with cyclosporin A (CsA) plus androgen or CsA alone through retrospective analysis.
Materials and methods
Patients
This analysis included patients with AA who were newly diagnosed and treated at the Affiliated Hospital of Xuzhou Medical University, between April 2008 and September 2017. The personal information of all AA patients, including their names, genders, ages, ethnicities, occupations, telephones, addresses, ID numbers, the history of exposure to hazardous chemicals and radioactive materials or no, and medical data are recorded in the case system of our institute in detail. The diagnosis of AA, disease severity and response to IST refer to the criteria developed by British Committee For Standards In Hematology[Citation18]. Patients were excluded if (1) patients with congenital bone marrow failure, including Fanconi anemia (FA), dyskeratosis congenital, Schwachman-Diamond syndrome, Diamond–Blackfan anemia, (2) the disease was not newly diagnosed, and (3) they received therapy previously.
Measurement of RDW
The baseline RDW level at diagnosis was defined as the value that was obtained on the nearest day before the transfusion of red blood cells or the administration of CsA/androgen. RDW was measured using XE-2100 (Sysmex, Kobe, Japan). The reference range for RDW in our institution is 10.6% to 15%. We defined that the RDW level was ‘high’ when it was ≥15%.
Statistical analysis
All analyses and graphs were obtained using the statistical software SPSS Statistics 19.0(SPSS Inc, Chicago, IL). Non-normally distributed data were expressed as the median. Rates and proportions were compared using Pearson’s χ2 test. Mann-Whitney U test was for not normally distributed variables. The Kaplan–Meier method was used to evaluate overall survival (OS) and progression-free survival (PFS), and comparisons were based on the Log-rank test. Cox proportional hazard regression was used for analyzing the influence of all covariates on overall survival. All statistical tests were two-sided, with P values ≤0.05 indicating statistical significance.
Results
Patient characteristics
A total of 220 AA patients were eligible for this analysis. The median age was 27 years, and 60% were males. Among all patients, 207 (94%) AA patients were initially treated with CsA plus androgen and fewer AA patients chose CsA alone. At diagnosis, 64% had non-severe AA (NSAA), 25% had severe AA (SAA), and 11% had very severe AA (VSAA) ().
Table 1. Clinical characteristics.
Association between RDW level and clinical outcomes
In the entire follow-up population, the median baseline RDW level was 15.5%, and it ranged from 11.4% to 27.9%. Among these, 134 (61%) patients presented an RDW higher than the upper limit of the normal range (≥15%). The median RDW values of the normal-RDW group and the high-RDW group were 13.8% (range, 11.4–14.9%) and 16.7% (range, 15–27.9%) (P < 0.001), respectively. There were no significant gender and age differences in the two groups of AA patients (P = 0.779, P = 0.193). The proportion of patients with NSAA was significantly higher in the high-RDW group compared with the normal-RDW group. In accordance with the above results, the median RDW of NSAA and SAA patients was 15.65% and 15.35%, respectively, this was significantly higher than that of VSAA patients (13.35%) (P < 0.001, P = 0.007) (). In addition, the median ANC, AMC and PLT were also higher in the high-RDW group compared with those in the normal-RDW group (P = 0.001, P < 0.001, P = 0.031) (). Multivariate Cox-regression analysis showed that ≥55 years of age and SAA/VSAA were independent risk factors for inferior survival ().
Figure 1. Red blood cell distribution width (RDW) level according to disease severity at diagnosis (non-severe, severe, and very severe AA).
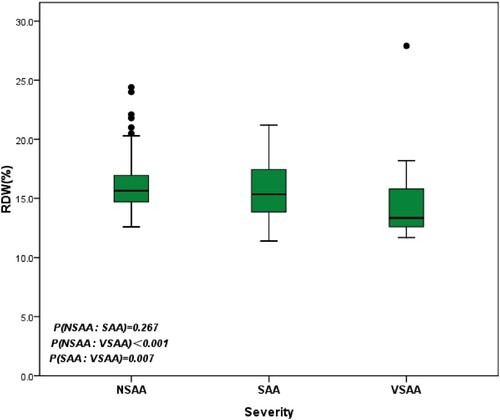
Table 2. Uni- and multivariable Cox regression.
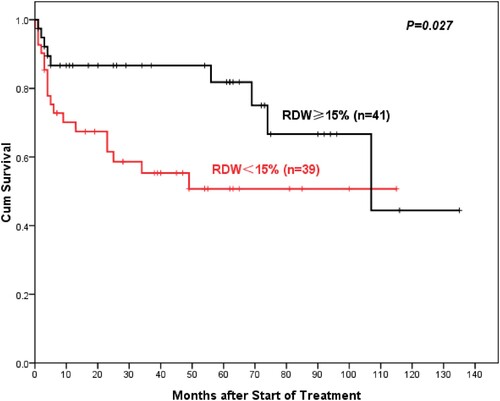
With a median follow-up was 46 (range 0–144) months, AA patients with high RDW showed better 5-year overall OS compared to normal RDW patients (93%: 75.3%, P = 0.003) (). Similarly, the 5-year PFS of AA patients in the high-RDW group was superior to the normal-RDW group (74.3%: 61%, P = 0.028) (). There was also a higher objective response rate (ORR, including complete remission (CR) rate and partial remission (PR) rate) in the high-RDW group compared with the normal-RDW group (68.7%: 52.3%, P = 0.015). Further studies showed that NSAA patients in the high-RDW group had higher 10-year OS than the normal-group patients with NSAA, but the difference was not statistically significant (97.8%: 86.8%, P = 0.73) (). Whereas ORR of NSAA patients in the high-RDW group was better than that in the normal RDW group (75.8%: 60%, P = 0.055). The 5-year OS of SAA/VSAA Patients in the high-RDW group was significantly higher than the normal-RDW group (81.8%: 50.8%, P = 0.027) ().
Figure 2. Overall Survival according to RDW (≥15%, < 15%).
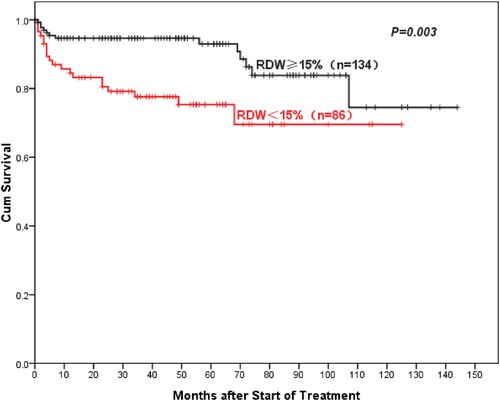
Figure 3. Progression-Free Survival according to RDW (≥15%, < 15%).
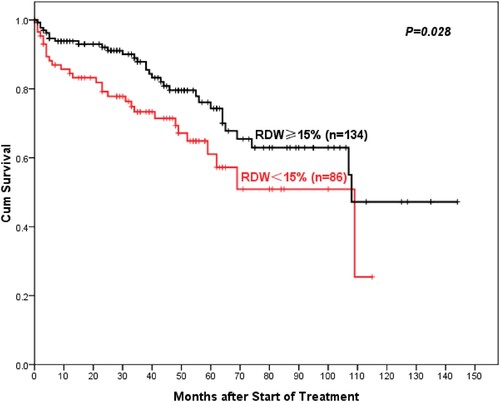
Figure 4. Overall Survival for NSAA patients according to RDW (≥15%, < 15%).
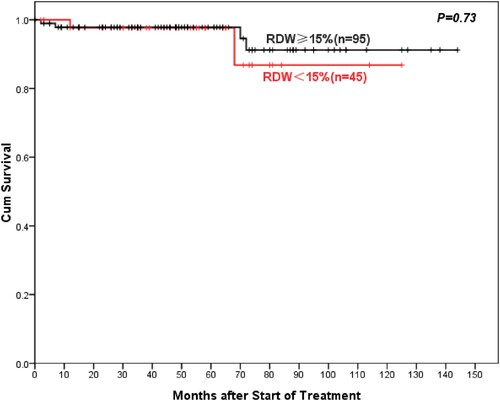
Figure 5. Overall Survival for SAA/VSAA patients according to RDW(≥15%, < 15%).
Discussion
In recent years, the prognostic value of RDW has been demonstrated in hematopoietic and lymphatic system disorders [Citation19–22]. The elevated RDW at diagnosis was a poor prognostic factor for PFS of symptomatic multiple myeloma (MM)[Citation19]. Clinical studies from Croatia have shown that high baseline RDW is an independent prognostic marker of inferior OS and event-free survival (EFS) in patients with diffuse large B-cell lymphoma (DLBCL) [Citation20]. Elevated RDW level at the moment of diagnosis was associated with advanced disease and shorter overall survival in chronic lymphocytic leukemia patients [Citation21]. Podhorecka et al. showed that chronic myeloid leukemia-chronic phase patients with a high RDW had significantly worse 5-year OS and PFS than those with a low RDW [Citation22]. In addition, RDW has predictive values in the risk of death associated with thrombotic events, non-hematological tumors, acute pancreatitis, critically ill patients, and even the population over 45 years of age [Citation9,Citation23–26].
To the best of our knowledge, this is the first report on the prognostic value of RDW in AA patients treated with CsA plus androgen or CsA alone, which showed that the elevated RDW at diagnosis was closely associated with prognosis in AA patients. The 5-year OS and 5-year PFS of the high-RDW group all were superior to the normal-RDW group in AA patients treated with CsA plus androgen or CsA alone. Prior studies have shown that RDW increases gradually with age [Citation27], but there was no age difference between the high-RDW group and the normal-RDW group in our study. Given that the high proportion of NSAA patients may lead to better OS and PFS in the high-RDW group, we divided the entire study population into the NSAA group and the SAA/VSAA group. Among NSAA patients, there was no significant difference in 10-year OS between the high-RDW group and the normal-RDW group, which may be associated with the longer OS of NSAA patients. If the follow-up time is extended and the number of cases is increased, there may be differences in survival between different RDW groups, just as the ORR of the high-RDW group is better than that of the normal-RDW group. In the SAA/VSAA group, patients with high RDW had better 5-year OS than those with normal RDW. Univariable Cox-regression analysis showed that RDW was a poor prognostic factor although the value of P did not meet the standard of statistical significance in the multivariate analysis, it is not difficult to find the potential significance of RDW in evaluating the prognosis of AA patients treated with CsA plus androgen or CsA alone.
Different from the results of previous clinical studies [Citation19–22], the high RDW patients had better prognoses in this study, which may be related to the pathogenesis of AA and the pharmacological mechanism of CsA. Immune-mediated excessive apoptosis of hematopoietic stem and progenitor cells plays an important role in the pathogenesis of AA [Citation17], and several clinical studies on the effectiveness of IST in the treatment of AA patients have also verified this view [Citation28–31]. Autoimmune dysregulation leads to the activation of T cells and monocytes, producing inflammatory factors such as interferon-γ (IFN-γ) and tumor necrosis factor-α (TNF-α), interleukin-1 (IL-1), IL-6, and IL-10. At the same time, these inflammatory factors induce ferritin expression and stimulate the storage and retention of iron within macrophages. These mechanisms lead to a decreased iron concentration in the circulation and thus to limited availability of iron for erythroid cells, which results in anemia and high RDW level finally [Citation13]. In this study, AA patients in the high-RDW group had a higher median monocyte count level, which suggested the inordinate autoimmune hyperfunction. As an immunosuppressive agent, CsA has been applied to the treatment of AA for more than 30 years [Citation32]. It can regulate the proportion of T cell subsets, inhibit the expression of IL-2R and the production of IL-2 in T cells were inhibited and the reactivity of T cells to IL-2, inhibit the production of IFN-γ and the negative regulation of IFN-γ on hematopoietic [Citation33]. Further studies on the pathogenesis of AA have found that chromosomal abnormalities, telomere attrition, somatic cell mutations, abnormal bone marrow hematopoietic microenvironment and viral infection may also contribute to the pathogenesis of AA, in addition to the abnormal activation of the immune system [Citation34, Citation35]. In other words, there may be individual differences in the main pathogenesis of different AA patients. Immunosuppressive therapy may be less effective when the pathogenesis other than the abnormally activated immune system predominates. Per prior studies, some AA patients did not respond to CsA treatment [Citation36–39]. Therefore, we speculated that the high RDW level indirectly reflects the abnormal activation of the immune system in AA patients, those who have positive responses to CsA treatment.
There were several limitations in this study. First, as with most retrospective analyses, this was a retrospective study in a single center with a small sample size. The value of RDW in the prognosis of AA may vary among different populations, and multicenter studies are warranted. Second, the relationship between RDW, the immune system and CsA needs to be further explored to provide more evidence for the individualized treatment of AA. In conclusion, despite the limitations, this is the first documentation on the prognostic value of RDW in AA patients receiving CsA treatment with long-term follow-up, which had shown that high RDW at diagnosis was a better prognostic factor.
Compliance with ethical standards
This study was reviewed by Xuzhou Medical University Institutional Review Board. Ethical approval for this investigation was obtained from the Ethics Committee of Xuzhou Medical University.
Disclosure statement
No potential conflict of interest was reported by the author(s).
Additional information
Funding
References
- Salvagno GL, Sanchis-gomar F, Picanza A, et al. Red blood cell distribution width: a simple parameter with multiple clinical applications. Crit Rev Clin Lab Sci. 2015 Dec;52(2):86–105. doi:10.3109/10408363.2014.992064
- Montagnana M, Cervellin G, Meschi T, et al. The role of red blood cell distribution width in cardiovascular and thrombotic disorders. Clin Chem Lab Med. 2011 Dec;50(4):635–641. doi:10.1515/cclm.2011.831
- Evans TC, Jehle D. The red blood cell distribution width. J Emerg Med. 1991 Jan;9(Suppl 1):71–74. doi:10.1016/0736-4679(91)90592-4
- Li N, Zhou H, Tang Q. Red blood cell distribution width: a novel predictive indicator for cardiovascular and cerebrovascular diseases. Dis Markers. 2017 Jun;2017:7089493. doi:10.1155/2017/7089493
- Malandrino N, Wu WC, Taveira TH, et al. Association between red blood cell distribution width and macrovascular and microvascular complications in diabetes. Diabetologia. 2012 Oct;55(1):226–235. doi:10.1007/s00125-011-2331-1
- Oh HJ, Park JT, Kim JK, et al. Red blood cell distribution width is an independent predictor of mortality in acute kidney injury patients treated with continuous renal replacement therapy. Nephrol Dial Transplant. 2012 Jun;27(2):589–594. doi:10.1093/ndt/gfr307
- Lou Y, Wang M, Mao W. Clinical usefulness of measuring red blood cell distribution width in patients with hepatitis B. PloS one. 2012 May;7(5):e37644. doi:10.1371/journal.pone.0037644
- Seyhan EC, Ozgul MA, Tutar N, et al. Red blood cell distribution and survival in patients with chronic obstructive pulmonary disease. Copd. 2013 Mar;10(4):416–424. doi:10.3109/15412555.2012.758697
- Koma Y, Onishi A, Matsuoka H, et al. Increased red blood cell distribution width associates with cancer stage and prognosis in patients with lung cancer. PloS one. 2013 Nov;8(11):e80240. doi:10.1371/journal.pone.0080240
- Seretis C, Seretis F, Lagoudianakis E, et al. Is red cell distribution width a novel biomarker of breast cancer activity? Data from a pilot study. J Clin Med Res. 2013 Jan;5(2):121–126. doi:10.4021/jocmr1214w
- Rezende SM, Lijfering WM, Rosendaal FR, et al. Hematologic variables and venous thrombosis: red cell distribution width and blood monocyte count are associated with an increased risk. Haematologica. 2014 Jan;99(1):194–200. doi:10.3324/haematol.2013.083840
- Jelkmann W. Proinflammatory cytokines lowering erythropoietin production. J Interferon Cytokine Res. 1998 Mar;18(8):555–559. doi:10.1089/jir.1998.18.555
- Weiss G, Goodnough LT. Anemia of chronic disease. N Eng J Med. 2005 Mar;352(10):1011–1023. doi:10.1056/NEJMra041809
- Kiefer CR, Snyder LM. Oxidation and erythrocyte senescence. Curr Opin Hematol. 2000 Mar;7(2):113–116. doi:10.1097/00062752-200003000-00007
- Lippi G, Franchini M, Targher G. Arterial thrombus formation in cardiovascular disease. Nat Rev Cardiol. 2011 Jul;8(9):502–512. doi:10.1038/nrcardio.2011.91
- Lippi G, Franchini M. Pathogenesis of venous thromboembolism: when the cup runneth over. Semin Thromb Hemost. 2008 Nov;34(8):747–761. doi:10.1055/s-0029-1145257
- Young NS, Calado RT, Scheinberg P. Current concepts in the pathophysiology and treatment of aplastic anemia. Blood. 2006 Oct;108(8):2509–2519. doi:10.1182/blood-2006-03-010777
- Killick SB, Bown N, Cavenagh J, et al. Guidelines for the diagnosis and management of adult aplastic anaemia. Br J Haematol. 2016 Jan;172(2):187–207. doi:10.1111/bjh.13853
- Lee H, Kong SY, Sohn JY, et al. Elevated red blood cell distribution width as a simple prognostic factor in patients with symptomatic multiple myeloma. Biomed Res Int. 2014 May;2014:145619. doi:10.1155/2014/145619
- Perisa V, Zibar L, Sincic-petricevic J, et al. Red blood cell distribution width as a simple negative prognostic factor in patients with diffuse large B-cell lymphoma: a retrospective study. Croat Med J. 2015 Aug;56(4):334–343. doi:10.3325/cmj.2015.56.334
- Podhorecka M, Halicka D, Szymczyk A, et al. Assessment of red blood cell distribution width as a prognostic marker in chronic lymphocytic leukemia. Oncotarget. 2016 May;7(22):32846–32853. doi:10.18632/oncotarget.9055
- Mao XL, Xi YM, Li ZJ, et al. Higher red blood cell distribution width at diagnose is a simple negative prognostic factor in chronic phase-chronic myeloid leukemia patients treated with tyrosine kinase inhibitors: a retrospective study. Medicine. 2021 Mar;100(10):e24003. doi:10.1097/MD.0000000000024003
- Bazick HS, Chang D, Mahadevappa K, et al. Red cell distribution width and all-cause mortality in critically ill patients. Crit Care Med. 2011 Aug;39(8):1913–1921. doi:10.1097/CCM.0b013e31821b85c6
- Abakay O, TanrikulU AC, Palanci Y, et al. The value of inflammatory parameters in the prognosis of malignant mesothelioma. J Int Med Res. 2014 Apr;42(2):554–565. doi:10.1177/0300060513504163
- Senol K, Saylam B, Kocaay F, et al. Red cell distribution width as a predictor of mortality in acute pancreatitis. Am J Emerg Med. 2013 Apr;31(4):687–689. doi:10.1016/j.ajem.2012.12.015
- Patel KV, Ferrucci L, Ershler WB, et al. Red blood cell distribution width and the risk of death in middle-aged and older adults. Arch Intern Med. 2009 Mar;169(5):515–523. doi:10.1001/archinternmed.2009.11
- Qiao R, Yang S, Yao B, et al. Complete blood count reference intervals and age- and sex-related trends of North China Han population. Clin Chem Lab Med. 2014 Jul;52:1025–1032. doi:10.1515/cclm-2012-0486
- Shin SH, Lee JW. The optimal immunosuppressive therapy for aplastic anemia. Int J Hematol. 2013 May;97(5):564–572. doi:10.1007/s12185-013-1331-y
- Huang IA, Jaing TH, Yang CP, et al. Single-Center Experience: immunosuppressive therapy as frontline treatment for 33 children with acquired severe aplastic anemia. Pediatr Hematol Oncol. 2009 Nov;26(7):487–495. doi:10.1080/08880010902772364
- Ahn MJ, Choi JH, Lee YY, et al. Outcome of adult severe or very severe aplastic anemia treated with immunosuppressive therapy compared with bone marrow transplantation: multicenter trial. Int J Hematol. 2003 Aug;78(2):133–138. doi:10.1007/BF02983381
- Fuhrer M, Rampf U, Baumann I, et al. Immunosuppressive therapy for aplastic anemia in children: a more severe disease predicts better survival. Blood. 2005 Sep;106(6):2102–2104. doi:10.1182/blood-2005-03-0874
- Frickhofen N, Heit W, Raghavachar A, et al. Treatment of aplastic anemia with cyclosporin A, methylprednisolone, and antithymocyte globulin. Klin Wochenschr. 1986 Nov;64(22):1165–1170. doi:10.1007/BF01728454
- Zhang NH, Shao ZH. Efficacy and mechanism of cyclosporine A in the treatment of aplastic anemia. Chin J Hematol. 1998 Apr;19(4):218. doi:10.3760/j:issn:0253-2727
- Young NS. Aplastic Anemia. N Eng J Med. 2018 Oct;379(17):1643–1656. doi:10.1056/NEJMra1413485
- Liu C, Sun Y, Shao Z. Current concepts of the pathogenesis of aplastic anemia. Curr Pharm Des. 2019 Mar;25(3):236–241. doi:10.2174/1381612825666190313113601
- Huo J, Li X, Shao Y, et al. Long-term follow-up of a novel immunosuppressive strategy of cyclosporine alternatively combined with levamisole for severe aplastic anemia. Ann Hematol. 2020 Aug;99(8):1727–1734. doi:10.1007/s00277-020-04153-9
- Wang M, Li X, Shi J, et al. Outcome of a novel immunosuppressive strategy of cyclosporine, levamisole and danazol for severe aplastic anemia. Int J Hematol. 2015 Aug;102(2):149–156. doi:10.1007/s12185-015-1818-9
- Yamazaki H, Sugimori C, Chuhjo T, et al. Cyclosporine therapy for acquired aplastic anemia: predictive factors for the response and long-term prognosis. Int J Hematol. 2007 Apr;85(3):186–190. doi:10.1532/IJH97.06156
- Al-ghazaly J, Al-dubai W, Al-jahafi AK, et al. Cyclosporine monotherapy for severe aplastic anemia: a developing country experience. Ann Saudi Med. 2005 Oct;25(5):375–379. doi:10.5144/0256-4947.2005.375