
ABSTRACT
Objectives
Chronic myeloid leukemia (CML) is an aggressive malignancy originating from hematopoietic stem cells. Imatinib (IM), the first-generation tyrosine kinase inhibitor, has greatly improved theliving quality of CML patients. However, owing to the recurrence and treatment failure coming from tyrosine kinase inhibitor (TKIs) resistance, some CML patients still bear poor prognosis. Therefore, we aimed to seek potential signaling pathways and specific biomarkers for imatinib resistance.
Methods
We performed mRNA and miRNA expression profiling in imatinib-sensitive K562 cells (IS-K562) and imatinib-resistant K562 cells (IR-K562). Differentially expressed genes (DEGs) were identified and pathway enrichment analyses were performed to explore the potential mechanism. The protein–protein interaction (PPI) network and miRNA-mRNA regulatory network were constructed to explore potential relationships among these genes. RT-qPCR, western blot and CCK8 were used for further experiments.
Results
A total of 623 DEGs and 61 differentially expressed miRNAs were identified. GO revealed that DEGs were mainly involved in cell adhesion, cell migration, differentiation, and inflammatory response. KEGG revealed that DEGs were typically enriched in the Rap1 signaling pathway, focal adhesion, proteoglycans and transcriptional misregulation in cancer, signaling pathways regulating pluripotency of stem cells and some immune-related pathways. The protein–protein interaction (PPI) network and miRNA-mRNA regulatory network revealed a web of diverse connections among genes. Finally, we proved that RHoGDI2 played a critical role in imatinib resistance.
Conclusion
The dynamic interplay between genes and signaling pathways is associated with TKIs resistance and RHoGDI2 is identified as a biomarker in IR-K562.
1. Introduction
Chronic myeloid leukemia (CML) is an aggressive malignancy originating from hematopoietic stem cells, characterized by Philadelphia (Ph) chromosome, a translocation between chromosomes 9 and 22 [Citation1]. The fusion gene BCR-ABL1 on the Philadelphia chromosome encodes the BCR-ABL1 protein with constitutive tyrosine kinase activity, which results in aberrant activation of oncogenic cytoplasmic signaling molecules or pathways, including the phosphoinositide 3-kinase (PI3K)/AKT pathway, the Janus-activated kinase (JAK)–STAT pathway, the signal transducer and activator of transcription (STAT) 1/3 pathway and the Ras-mitogen-activated protein kinase (MAPK) [Citation2,Citation3]. Disturbance of those signaling pathways contributes to CML cells proliferation and anti-apoptosis [Citation3,Citation4]. In recent years, many tyrosine kinase inhibitors targeting BCR/ABL1 and its downstream signaling pathways have been applied to clinical medicine, for they are ideal therapeutic targets for CML [Citation5]: First-generation TKI, imatinib (IM). Second-generation TKIs, dasatinib, bosutini, nilotinib. Third-generation TKI, ponatinib. The TKIs, especially IM, are markedly effective in CML. However, the rapidly acquired resistance of TKIs significantly hinders CML treatment efficacy. The resistance mechanism can be divided into BCR/ABL-dependent way and BCR/ABL-independent way. The former relates to the mutations and overexpression of BCR/ABL1 [Citation6], and the latter is associated with leukemic stem cells (LSCs) [Citation7], microenvironmental factors [Citation8], and impaired signaling pathways [Citation9]. Therefore, it is worthwhile to further investigate potential molecular mechanisms in TKIs-resistant CML and explore a novel therapeutic target.
MicroRNAs (miRNAs) are a class of small (∼21 nucleotides) non-protein-coding RNAs, which control mRNA expression. Their powerful degradation for target genes has a great influence on cell progression, cell cycle, proliferation and apoptosis, etc. MiRNAs have different expression profiles in cancers and are associated with the development of cancer. Thus, it might be an important kind of drug target or biological marker for cancer diagnosis and treatment. MiRNA-mRNA regulatory networks play an extremely significant role in cancer progression, including CML. Nie et al. demonstrated that miR-202-5p interacted with STAT5A and USP15 to regulate imatinib-induced apoptosis [Citation10]. Thus, we construct a miRNA-mRNA regulatory network to explore the mechanism of imatinib resistance.
RhoGDP dissociation inhibitor beta (RhoGDI2) plays a critical part in tumor progression. For one thing, RhoGDI2 is a regulator of cell invasion and metastasis [Citation11–14]. For another, RhoGDI2 affects the sensitivity of tumor cells to chemotherapy drugs [Citation15–17]. However, the role of RhoGDI2 in cancer progression remains controversial among these studies. As yet, little is known of whether RhoGDI2 affects imatinib resistance.
In this study, we explored mRNA and miRNA expression profiles in IS-K562 and IR-K562, performed GO/KEGG/GSEA enrichment pathways, and constructed PPI networks and miRNA-mRNA regulatory networks to investigate the potential mechanism thoroughly. And we further studied the function of RHoGDI2 in imatinib-resistant CML cells by silencing RHoGDI2 expression.
2. Materials and methods
2.1. Cell culture and IR-K562 construction
IS-K562 cells were purchased from American Type Culture Collection. IS-K562 were exposed to imatinib and gradually increased concentration to establish IR-K562 cells until they were able to grow continuously in medium containing 1μM imatinib. The medium containing 1μM imatinib was physiologically relevant and maybe could simulate the peak plasma/serum level of imatinib (5μM). IS-K562 cells were cultured in RPMI 1640 containing 10% fetal bovine serum . IR-K562 were cultured in RPMI 1640 containing 10% FBS and 1 µM imatinib. Those cells were grown at 37°C under a 5% CO2 atmosphere.
2.2. Gene expression microarray
mRNA and miRNA expression profiles were performed on 6 samples (IS-K562: n = 3, IR-K562: n = 3).
2.2.1. mRNA expression microarray
Total RNAs were extracted from IS-K562 and IR-K562 using TRNzol Universal reagent (TIANGEN, Beijing, China). NanoDrop 2000 (Thermo, Wilmington, U.S.A.) and Agilent Bioanalyzer 2100 (Agilent, California, U.S.A.) were used to determine the quantity and quality of RNA. Gene expression was analysed by GeneChip®PrimeView™ Human Gene Expression Array (Affymetrix, California, U.S.A.). Briefly, the RNA samples were amplified using the GeneChip 3′IVT Express Kit for Array Analysis. The total RNAs first underwent reverse transcription reaction to obtain first-strand cDNA. The single-stranded DNA then underwent second-strand cDNA synthesis and purification to become a double-stranded cDNA template. The template was amplified using the GeneChip 3′IVT Express Kit to obtain amplified RNA and biotin labeling. The aRNA was purified and then segmented and hybridized by GeneChip Hybridization Oven645 (Affymetrix, California, U.S.A.). After hybridization, the chip was washed and dyed (GeneChip Fluidics Station 450), and the images and raw data were scanned by the GeneChip Scanner 3000 (Affymetrix, California, U.S.A.). The process was as follows: First-Strand cDNA Synthesis 42°C, 2 h; Second-Strand cDNA Synthesis 16°C, 1 h, 65°C, 10 min; IVT 40°C, 16hr; Fragmentation 94°C, 35 min; Hybridization 98°C, 10 min, 45°C, 3 min.
2.2.2. miRNA expression microarray
The quality of RNA samples was assessed by NanoDrop ND-1000 spectrophotometer (Thermo, Wilmington, U.S.A.), and the integrity of RNA was assessed by Agilent Bioanalyzer 2100 (Agilent, California, U.S.A.) and gel electrophoresis. Briefly, for each sample, 100 ng total RNA was dephosphorylated to form the 3-OH end. Second, the 3-OH-ended RNA was effectively denatured by DMSO and labeled with Cy3 by using enzymes. The hybridization was performed on the Arraystar Human small RNA chip (8 × 15 K, Arraystar) with the labeled RNA and the results of hybridization were scanned by the Agilent Scanner G2505C (Agilent, California, U.S.A.). The final acquired array images were analyzed by Agilent Feature Extraction software (version 11.0.1.1). Subsequent data processes such as quantile normalization were performed using the Agilent Technologies GeneSpring GX v12.1 software package.
2.3. Bioinformatic analysis
2.3.1. DEG analysis
Limma package (3.50.3) in R software (version 4.1.3) was used to determine differentially expressed genes (DEGs). The mRNA DEGs filter criteria were set as adjusted P-value < 0.05 and |log2 fold change (FC)| > 1.5. Screening top 10 was up-regulated and the top 10 was down-regulated miRNA for further study. The differential expression data were displayed on the heat map and volcano map.
2.3.2. Pathway enrichment analyses
We used the DAVID database (https://david.ncifcrf.gov/) to perform Gene Ontology (GO) and Kyoto Encyclopedia of Genes and Genomes (KEGG) pathway enrichment analyses. R package GOplot [Citation18] was utilized to visualize the results and GOplot was characterized by the combination of expression data and functional analysis.
2.3.3. Gene set enrichment analysis (GSEA)
GSEA was based on the analysis of global gene expression. We downloaded the Hallmark gene sets (h.all.v2022.1.Hs.symbols.gmt) from GSEA (http://www.gsea-msigdb.org/gsea/downloads.jsp) to analyze, annotate and explain the results of enrichment analysis and utilized the clusterProfiler to determine whether the Hallmark gene sets show statistical differences between sensitive and resistant K562.
2.3.4. Protein–protein interaction networks (PPI) and hub gene identification
The protein–protein interaction (PPI) network of DEGs was constructed through STRING (http://string-db.org,Version:11.5), and the PPI network was visualized using Cytoscape software (version 3.9.1). CytoHubba was used to identify Hub genes.
2.3.5. miRNA-mRNA regulatory network
The target mRNA of the selected miRNA was predicted in the miRTarBase, miRDB and TargetScan databases. Then the target mRNA in the miRNA-mRNA regulatory network was analyzed by GO and KEGG. The miRNA-mRNA regulatory network was drawn using the Cytoscape (version 3.9.1).
2.4. siRNA transfection
IR-K562 cells (2 × 10⁵/ml) were seeded in 12 well plate. RHoGDI2 small interfering ribonucleic acid (siRNA) and control siRNA (GenePharma, Shanghai, China) were incubated with cells for 48 h, according to riboFECT™ CP (Ribo, Guangzhou, China) instruction manual. The sequence of the oligonucleotides was as follows:
siRhoGDI2 #1Sense strand: 5′-CCAUUGUGUUAAAGGAAGGTT-3′
Antisense strand: 5′-CCUUCCUUUAACACAAUGGTT-3′
siRhoGDI2 #2 Sense strand: 5′-GCUCAAUUAUAAGCCUCCATT-3′
Antisense strand: 5′-UGGAGGCUUAUAAUUGAGCTT-3′
Negative control Sense strand: 5′-UUCUCCGAACGUGUCACGUTT-3′
Antisense strand: 5′-ACGUGACACGUUCGGAGAATT-3′
2.5. RNA extraction and quantitative real-time PCR
72 h after transfection, RhoGDI2 expression was assessed by quantitative real-time PCR (RT-qPCR). According to the manufacturer's instructions, total RNAs were extracted from cells using TRNzol Universal reagent (TIANGEN, Beijing, China), and complementary DNA synthesis was performed using PrimeScript™ RT reagent Kit with gDNA Eraser (Takara, Kyoto, Japan). The expressions of RhoGDI2 and GAPDH were assessed by TB Green® Premix Ex Taq™ II (Takara, Kyoto, Japan). The relative expression of RhoGDI2 was analyzed using the 2-ΔΔCT. The primers were as follows:
RhoGDI2 forward: 5′-TTTATGGTTGGCAGCTATGGA-3′
RhoGDI2 reverse: 5′-GCTGAGGTGGTCTTGCTTGTC-3′
GAPDH forward: 5′-CGGATTTGGTCGTATTGGG -3′
GAPDH reverse: 5′-CTGGAAGATGGTGATGGGATT-3′
2.6. Western blot
Cells were lysed in RIPA lysis buffer (Solarbio, Beijing, China) containing phosphatase and protease inhibitor cocktail (NCM Biotech, Suzhou, China). BCA protein assay kit (TIANGEN, Beijing, China) was used to determine protein concentration. Protein samples (20μg) were separated using 10% SDS-PAGE and then transferred to nitrocellulose membranes. Membranes were blocked in 5% skim milk, and incubated with primary antibodies overnight at 4°C: anti-RhoGDI2 (66054-1-Ig, Proteintech) ,anti-BCL2 (12789-1-AP, Proteintech), and anti-GAPDH (60004-1-Ig, Proteintech) (1:1000). Then, the membranes were incubated with a rabbit or mouse secondary antibodies (1:10000), and immunoreactive bands were identified by Enhanced Chemiluminescent (NCM Biotech, Suzhou, China) and images were captured using the Molecular Imager ChemiDoc XRS + (Bio-Rad, California, U.S.A.).
2.7. Cell proliferation and viability assay
Cell proliferation and viability were detected by Cell Counting Kit-8 (Boster, Wuhan, China). Cells (1 × 10⁴ cells/well) with increasing concentrations of imatinib were seeded in 96-well culture plates for 48 h. Thereafter, 10 µl CCK-8 was added to each well and incubated for 2 h, the absorbance (OD) at 450 nm was determined using a multiscan FC microplate reader (Thermo, Wilmington, U.S.A.). 50% inhibition of growth (IC50) was calculated with GraphPad Software, Prism 7.0. For measuring cell proliferation, 1 × 10⁴ cells were incubated in 96-well plates followed by the addition of 10 µl of CCK-8 at time points (0, 24, 48, and 72 h).
2.8. Statistical analysis
Statistical analyses were performed using the Student's t-test or one-way ANOVA test based on the number of groups. Statistical analysis and diagrams were performed using GraphPad Prism 7.0.
3. Results
3.1. IR-K562 cells survive and proliferate in imatinib
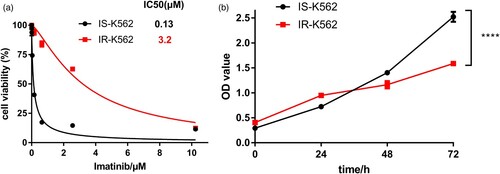
According to the above experimental method, it took about six months for IR-K562 cells to be successfully constructed. IS-K562 and IR-K562 cells upon exposure to a series of imatinib concentration gradients and the CCK-8 method was used to measure the cell inhibiting rate. IR-K562 had higher cell viability in the same drug concentration and a higher IC50 value than IS-K562 (A). IR-K562 displayed an IC50 value to imatinib about 30-fold higher than IS-K562 (IS-K562 IC50: 0.12μM, IR-K562 IC50: 3.68μM). Interestingly, we found that without the effect of IM, the growth rate of IR-K562 was lower than that of IS-K562 (B).
Figure 1. IR-K562 cells survive and proliferate in TKI. (A) a CCK-8 assays in IS-K562, IR-K562 treated with imatinib for 48 h. (B) a CCK-8 assays in IS-K562, IR-K562 at 0, 24, 48, 72 h.
3.2. The mRNA expression profile of IS-K562 and IR-K562 cells
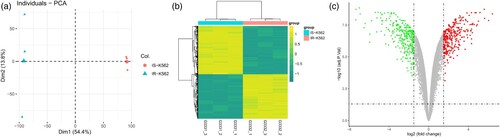
As drug resistance is probably associated with aberrantly gene expression, we performed mRNA profiling in IS-K562 and IR-K562. Principal component analysis (PCA) showed that transcriptome profiles in IR-K562 were distinct from that of IS-K562 (A). To evaluate the DEGs, a threshold of the p-value < 0.05 and |log2 fold change (FC)| ≥ 1.5 was applied, and there were 324 down-regulated and 299 up-regulated genes identified. All the DEGs were shown in a heatmap and hierarchical clustering for 6 samples (3 for IR-K562 and 3 for IS-K562) (B). The volcano plot displayed the integral distribution of genes (C).
Figure 2. Differentially expressed gene (DEG) analysis for IS-K562 vs IR-K562. (A) The principal component analysis shows a clear difference between resistant and sensitive K562. (B) The DEGs were compared in a hierarchical clustering heatmap. Yellow represents up-regulation and green represents down-regulation. (C) The volcano plot of DEGs. Red dots represent significant up-regulation, green dots represent significant down-regulation (Log |fold change| > 1.5, P < 0.05), and grey dots indicate no differential expression.
3.3. Differences in pathways between IS-K562 and IR-K562
To further explore the pathways and biological functions involved in DEGs, we performed pathway enrichment analysis including GO and KEGG. There were three included domains in GO analysis: biological process (BP), cellular component (CP) and molecular function (MF). The bubble plot showed that the DEGs between IS-K562 and IR-K562 were involved mainly in cell adhesion, cell migration, differentiation and proliferation (A). In the part of BP, the top 6 enriched GO terms were signal transduction, cell differentiation, positive regulation of transcription, cell adhesion, inflammatory response and negative regulation of cell proliferation (B). In the part of CP, the top 6 enriched GO terms were cytoplasm, cytosol, nucleus, plasma membrane, nucleoplasm and extracellular exosome (C). In the part of MF, the top 6 enriched GO terms were protein binding, identical protein binding, RNA polymerase II core promoter proximal region sequence-specific DNA binding, calcium ion binding, transcription factor activity and transcriptional activator activity (D).
Figure 3. GO term, KEGG enrichment pathway analysis and GSEA. (A) GO enrichment analysis is shown in the bubble diagram. The top 6 GO terms were shown in the Chord diagram. Gene ontology, including Biological process (B), Cellular components (C), Molecular function (D); (E) KEGG enrichment analysis; (F) The GSEA of imatinib-resistant K562.
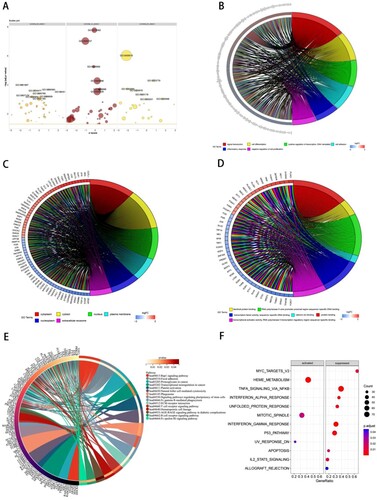
KEGG pathway enrichment revealed that DEGs were enriched in the following terms: Rap1 signaling pathway, focal adhesion, proteoglycans in cancer, transcriptional misregulation in cancer, platelet activation, phagosome, signaling pathways regulating pluripotency of stem cells, hematopoietic cell lineage, ECM-receptor interaction as well as some immune-related pathways, including Fc gamma R-mediated phagocytosis, natural killer cell-mediated cytotoxicity, T cell receptor signaling pathway, B cell receptor signaling pathway and Fc epsilon RI signaling pathway (E). We further applied GSEA enrichment analysis, which was based on the analysis of global gene expression, to examine the functional pathways and possible molecular mechanisms. GSEA showed that genes of IR-K562 were predominantly associated with some oncogenic-related signaling pathways, for instance, MYC, NF-κB, P53 and STAT5. They were also enriched in heme metabolism, interferon response, unfolded protein response, mitotic spindle, uv response, and apoptosis (F).
3.4. Protein–protein interaction (PPI) network and hub gene
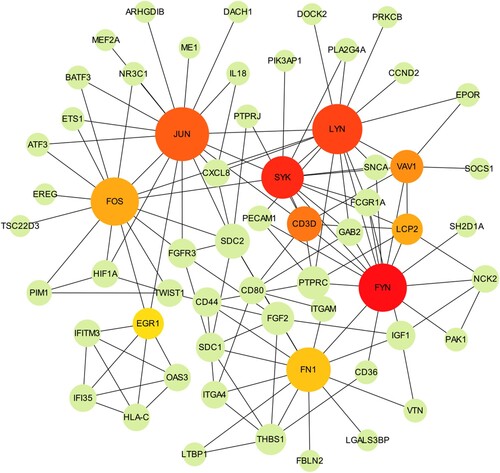
PPI network is a network of relationships and interactions between proteins and proteins. To identify the critical proteins, a PPI network for DEGs was constructed by the STRING database. By setting the confidence cut-off score at 0.9, a PPI network was established and the PPI enrichment p-value is 4.46e-09. The PPI network was optimized using Cytoscape software. The MCC method provided by CytoHubba was used to search pivotal nodes in the network. Finally, a concise PPI network was constructed (). The PPI network contained 60 nodes and 131 edges. Among these genes, JUN, LYN, FYN, SYK, FOS, FN1, CD3D, VAV1, LCP2, and EGR1 showed the highest node scores.
Figure 4. The PPI network was constructed using the top10 hub genes. 10 hub genes were calculated by cytoHubba. The size of each node represents its degree.
3.5. Prediction of miRNA target genes and miRNA-mRNA regulatory network
In miRNA expression profiling, IR-K562 expression profiling was compared with IS-K562 and obtained 61 differentially expressed miRNAs, of which 42 miRNAs were up-regulated and 19 were down-regulated. We listed the top10 up-regulated genes and the top 10 down-regulated genes in . We then selected those miRNAs for further investigation. The downstream target genes of top20 differentially expressed miRNAs were generated from miRDB, miRTarBase and TargetScan databases. And we performed KEGG enrichment analyses of candidate target genes, which were predicted simultaneously in three databases. Those genes enriched in microRNAs in cancer, p53 signaling pathway, AGE-RAGE signaling pathway in diabetic complications, proteoglycans in cancer, relaxin signaling pathway, signaling pathways regulating pluripotency of stem cells, chronic myeloid leukemia, HIF-1 signaling pathway, cell cycle, FoxO signaling pathway, pathways in cancer, adherens junction and platinum drug resistance (A). We screened two vital miRNAs, hsa-let-7d-5p and hsa-let-7g-5p, which were able to target multiple mRNAs in three databases at the same time (B). For other miRNAs, only one or two target genes could be predicted simultaneously in three databases and we eliminated these miRNAs.
Figure 5. miRNA-related pathways and networks. (A) KEGG enrichment analysis of the candidate target genes; (B) miRNA-mRNA regulatory network.
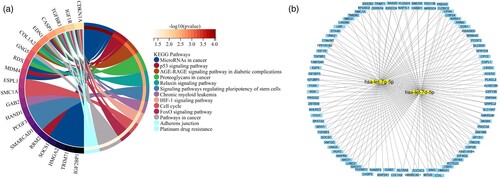
Table 1. Top10 up-regulated and Top10 down-regulated expression miRNAs.
3.6. Identification of RhoGDI2 as a biomarker of IR-K562
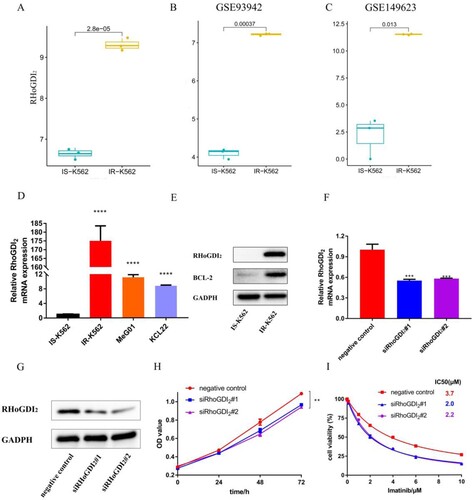
Among 623 DEGs, RhoGDI2 captured our immediate interest and made us want to explore more. Several studies had borne out that RhoGDI2 played critical roles in tumor progression [Citation13–15,Citation17]. As yet, little is known whether RhoGDI2 plays a part in IR-K562 cells. RhoGDI2 was enriched in several pathways: extracellular exosome, cytoplasm, cytoskeleton, cytosol, membrane, protein binding, GTPase activator activity and multicellular organism development. In addition, RhoGDI2 interacted with pivotal nodes in the PPI network. Here, we analyzed RhoGDI2 expression in our microarray data and two cohort profile datasets (GSE93942 and GSE149623) in the Gene Expression Omnibus (GEO) database. The results showed that the expression of RhoGDI2 was dramatically up-regulated in drug-resistant K562 (A–C). The mRNA levels of RhoGDI2 in IS-K562, IR-K562, MeG01 and KCL22 were quantitated by RT-qPCR. We found that RhoGDI2 was highly expressed in IR-K562 cells compared to other cell lines (D). Then, the protein levels of RhoGDI2 and BCL-2, a well-known TKI resistant gene were determined by western blot. It turned out IR-K562 with higher protein levels of RhoGDI2 and BCL-2 (E). The high expression of BCL-2 again proved that the IR-K562 was successfully constructed. Next, we determined the effect of RhoGDI2 on the proliferation ability and imatinib tolerability of IR-K562 cells. We used two independent siRNAs to inhibit RhoGDI2 expression and the knockdown efficiency was verified by RT-qPCR and western blot. The results showed RhoGDI2 expression was efficiently silenced (F, G). The proliferation ability and IC50 values of IR-K562 after transfection were determined by the CCK-8 method. We noted that RhoGDI2 silencing slightly reduced cell proliferation and increased the sensitivity of IR-K562 to imatinib (H, I).
Figure 6. Validation of RhoGDI2 in IR-K562. (A, B, and C) The expression of RhoGDI2 in IS-K562 and IR-K562; (D) The mRNA levels of RhoGDI2 were quantitated by RT-qPCR in IS-K562, IR-K562, MeG01, and KCL22.(E) Western blotting of IS-K562 and IR-K562; (F) RT-qPCR analysis showing the expression of RhoGDI2 mRNA in the negative control and siRhoGDI2 groups; (G) RhoGDI2 expression was measured by western blot after transfection (72 h); (H) CCK-8 assays for IR-K562 cells transfected with RhoGDI2 si-RNA for 72 h followed by imatinib treatment for another 48 h; (I) CCK-8 assays in negative control, siRHoGDI2#1, siRHoGDI2#2 at 0, 24, 48, 72 h without imatinib. p-values are determined by Student's t-test or one-way ANOVA, *p < 0.05; **p < 0.01; ***p < 0.001; ****p < 0.0001.
4. Discussion
The annual mortality of CML has fallen from 10% - 20% to an amazing 1%–2% after the widely use of imatinib [Citation19], and the 5-year overall survival rate under treatment is risen to 92%–95% due to the TKI therapy [Citation20]. However, the greatest obstacle to CML treatment is TKIs resistance. After 5-year imatinib therapy, 30%–50% of patients were imatinib-ineffective [Citation21]. Therefore, it is very important to provide new theoretical references for developing therapeutic targets. For this reason, we have performed mRNA and miRNA expression microarray analysis to explore the molecular mechanisms underlying imatinib-resistant CML cells.
The differential expression gene analysis of transcriptome microarray was performed and we obtained 623 DEGs. GO and KEGG enrichment analyses were performed to explore the function of DEGs. GO annotations mainly included signal transduction, cell differentiation, cell adhesion, inflammatory response, negative regulation of cell proliferation, and protein binding. Cell adhesion and negative regulation of cell proliferation were enriched, which were consistent with the observation of IR-K562 cells growing in clumps and the growth rate of IR-K562 cells was slower than that of IS-K562, respectively. These results are in good agreement with earlier findings, which also enriched cell adhesion, inflammatory response, cell surface, and protein binding[Citation22]. Research studies have long shown that cell adhesion plays an important part in drug resistance, and it is an important mechanism for tumor microenvironment protection [Citation23,Citation24]. According to another research finding, arsenic trioxide reduced the adhesion ability of cells and conquered cell adhesion-mediated drug resistance by down-regulating β1-integrin expression[Citation25]. KEGG enrichment analysis mostly included Rap1 signaling pathway, focal adhesion, proteoglycans in cancer, transcriptional misregulation in cancer, platelet activation, phagosome, signaling pathways regulating pluripotency of stem cells, hematopoietic cell lineage, ECM-receptor interaction and some immune-related pathways in IR-K562 cells. The results of GSEA showed that IR-K562 were predominantly enriched in some oncogenic-related signaling pathways. Immune-related pathways were commonly enriched by GO and KEGG enrichment analysis. Numerous studies reported that immune response played a critical role in cancer initiation and development [Citation26–28], and in the present research, it was also connected with imatinib resistance. According to the miRNA expression microarray analysis, we screened 61 differentially expressed miRNAs. We selected the top 20 differential miRNAs to predict the target genes and performed KEGG pathway enrichment analysis. KEGG analysis revealed that the target genes of the top 20 miRNAs are predominantly enriched in 13 signaling pathways, among which the p53 signaling pathway is an important cancer signal transduction pathway. It is reported that P53 combined with c-MYC can be used as therapeutic targets to eliminate leukemia stem cells.[Citation29] And pathways of signaling pathways regulating pluripotency of stem cells and chronic myeloid leukemia are also associated with CML.
RhoGDI2, a member of the Rho (or ARH) protein family, also known as ARHGDIB, was involved in various biological functions, including cell proliferation, signaling, cytoskeletal organization and secretion. The function of cytoskeletal organization and secretion is closely linked to drug resistance. Several studies reported that RhoGDI2 was a proto-oncogene and the expression of RhoGDI2 was high in several cancer cells, including breast cancer [Citation11], pancreatic cancer [Citation13], gastric cancer [Citation15], renal cell carcinoma [Citation30], lung cancer [Citation31], and bladder cancer [Citation32]. However, a few studies reported that RhoGDI2 acted as a tumor suppressor gene or metastasis suppressor gene, which conflicted with the conclusion stated above [Citation12,Citation14,Citation33–35]. The function and molecular mechanism of RhoGDI2 was rarely studied in imatinib-resistant leukemia. In this report, the gene expression microarray data revealed that RhoGDI2 mRNA expression value in IR-K562 cells was more elevated than IS-K562 and we demonstrated that RhoGDI2 transcription and protein levels were up-regulated in IR-K562 compared with IS-K562. We put forward the hypothesis that RhoGDI2 abnormal expression mediated imatinib resistance. As expected, functional analysis showed that RhoGDI2 knockdown repressed the proliferation of IR-K562 cells and increased the sensitivity of IR-K562 to imatinib. The result was similar to this research[Citation16], plasma RhoGDI2 level had a potential predictive value for anlotinib response. What is even more interesting is that FN1, one of the most pivotal nodes in our PPI network, is connected to the TKI anlotinib response according to this research [Citation16]. It is suggested that RhoGDI2 may be a potential biomarker in resistance CML and FN1 seems to play an important role in TKIs resistance.
Our results emphasized the DEGs and signal pathways between IS-K562 and IR-K562, the important influence of RhoGDI2 on CML resistance and it could be a potential treatment target point for imatinib-resistant CML treatment. However, there remain some limitations of the present study. First of all, to accurately find drug resistance-related genes, we were supposed to use imatinib-resistant patients’ peripheral blood mononuclear cells to perform sequencing. And secondly, only cell line was used for verification, it would be better to use large-scale clinical sampling to identify and validate RhoGDIB2 as a biomarker for imatinib resistance. Nevertheless, collecting clinical sampling was very hard owing to the strict screening criteria. Thirdly, the role of RhoGDI2 was not thoroughly explored. In the future, we will continue to collect clinical sampling for further verification. The functional analysis of RhoGDI2 is necessary and it will be interesting to explore the underlying mechanisms that RhoGDI2 ablation increases the sensitivity of IR-K562. In short, thi study provides a scientific basis for biomarker screening and provides novel theoretical references for therapeutic strategies of CML.
Disclosure statement
No potential conflict of interest was reported by the author(s).]
Additional information
Funding
References
- Shtivelman E, Lifshitz B, Gale RP, et al. Fused transcript of abl and bcr genes in chronic myelogenous leukaemia. Nature. 1985;315(6020):550–554. doi:10.1038/315550a0
- Perrotti D, Jamieson C, Goldman J, et al. Chronic myeloid leukemia: mechanisms of blastic transformation. J Clin Invest. 2010;120(7):2254–2264. doi:10.1172/JCI41246
- Cilloni D, Saglio G. Molecular pathways: BCR-ABL. Clin Cancer Res. 2012;18(4):930–937. doi:10.1158/1078-0432.CCR-10-1613
- Gorre ME, Mohammed M, Ellwood K, et al. Clinical resistance to STI-571 cancer therapy caused by BCR-ABL gene mutation or amplification. Science. 2001;293(5531):876–880. doi:10.1126/science.1062538
- Kashige N, Carpino N, Kobayashi R. Tyrosine phosphorylation of p62dok by p210bcr-abl inhibits RasGAP activity. Proc Natl Acad Sci U S A. 2000;97(5):2093–2098. doi:10.1073/pnas.040547997
- Bavaro L, Martelli M, Cavo M, et al. Mechanisms of disease progression and resistance to tyrosine kinase inhibitor therapy in chronic myeloid leukemia: an update. Int J Mol Sci. 2019;20(24):6141. doi:10.3390/ijms20246141
- Houshmand M, Simonetti G, Circosta P, et al. Chronic myeloid leukemia stem cells. Leukemia. 2019;33(7):1543–1556. doi:10.1038/s41375-019-0490-0
- Loscocco F, Visani G, Galimberti S, et al. BCR-ABL independent mechanisms of resistance in chronic myeloid leukemia. Front Oncol. 2019;9:939. doi:10.3389/fonc.2019.00939
- Moradi F, Babashah S, Sadeghizadeh M, et al. Signaling pathways involved in chronic myeloid leukemia pathogenesis: the importance of targeting Musashi2-Numb signaling to eradicate leukemia stem cells. Iran J Basic Med Sci. 2019;22(6):581–589. doi:10.22038/ijbms.2019.31879.7666
- Nie ZY, Yao M, Yang Z, et al. De-regulated STAT5A/miR-202-5p/USP15/Caspase-6 regulatory axis suppresses CML cell apoptosis and contributes to Imatinib resistance. J Exp Clin Cancer Res. 2020;39(1):17. doi:10.1186/s13046-019-1502-7
- Wang X, Bi X, Huang X, et al. Systematic investigation of biomarker-like role of ARHGDIB in breast cancer. Cancer Biomark. 2020;28(1):101–110. doi:10.3233/CBM-190562
- Wang P, Yang X, Wu P, et al. GM3 signals regulating TNF-alpha expression are mediated by Rictor and Arhgdib in mouse melanoma B16 cells. Oncology. 2007;73(5-6):430–438. doi:10.1159/000136801
- Yi B, Hu Y, Qin G, et al. Depletion of RhoGDI2 expression inhibits the ability of invasion and migration in pancreatic carcinoma. Int J Mol Med. 2014;34(1):205–212. doi:10.3892/ijmm.2014.1765
- Xia B, Wang J. Adenosine inhibits ovarian cancer growth through regulating RhoGDI2 protein expression. Drug Des Devel Ther. 2019;13:3837–3844. doi:10.2147/DDDT.S219028
- Cho HJ, Baek KE, Park SM, et al. RhoGDI2 confers gastric cancer cells resistance against cisplatin-induced apoptosis by upregulation of Bcl-2 expression. Cancer Lett. 2011;311(1):48–56. doi:10.1016/j.canlet.2011.06.024
- Lu J, Zhang W, Yu K, et al. Screening anlotinib responders via blood-based proteomics in non-small cell lung cancer. FASEB J. 2022;36(8):e22465. doi:10.1096/fj.202101658R
- Cho HJ, Kim IK, Park SM, et al. VEGF-C mediates RhoGDI2-induced gastric cancer cell metastasis and cisplatin resistance. Int J Cancer. 2014;135(7):1553–1563. doi:10.1002/ijc.28801
- Walter W, Sánchez-Cabo F, Ricote M. GOplot: an R package for visually combining expression data with functional analysis. Bioinformatics. 2015;31(17):2912–2914. doi:10.1093/bioinformatics/btv300
- Jabbour E, Kantarjian H. Chronic myeloid leukemia: 2018 update on diagnosis, therapy and monitoring. Am J Hematol. 2018;93(3):442–459. doi:10.1002/ajh.25011
- Cortes J, Pavlovsky C, Saußele S. Chronic myeloid leukaemia. Lancet. 2021;398(10314):1914–1926. doi:10.1016/S0140-6736(21)01204-6
- Cortes J, Lang F. Third-line therapy for chronic myeloid leukemia: current status and future directions. J Hematol Oncol. 2021;14(1):44. doi:10.1186/s13045-021-01055-9
- Zhang H, Wang P, Song T, et al. Screening and identification of key genes in imatinib-resistant chronic myelogenous leukemia cells: a bioinformatics study. Hematology. 2021;26(1):408–414. doi:10.1080/16078454.2021.1931740
- Damiano JS, Hazlehurst LA, Dalton WS. Cell adhesion-mediated drug resistance (CAM-DR) protects the K562 chronic myelogenous leukemia cell line from apoptosis induced by BCR/ABL inhibition, cytotoxic drugs, and gamma-irradiation. Leukemia. 2001;15(8):1232–1239. doi:10.1038/sj.leu.2402179
- Weisberg E, Wright RD, McMillin DW, et al. Stromal-mediated protection of tyrosine kinase inhibitor-treated BCR-ABL-expressing leukemia cells. Mol Cancer Ther. 2008;7(5):1121–1129. doi:10.1158/1535-7163.MCT-07-2331
- Guo-Bao W, Xiao-Qin C, Qi-Rong G, et al. Arsenic trioxide overcomes cell adhesion-mediated drug resistance through down-regulating the expression of beta(1)-integrin in K562 chronic myelogenous leukemia cell line. Leuk Lymphoma. 2010;51(6):1090–1097. doi:10.3109/10428191003746315
- Xia L, Oyang L, Lin J, et al. The cancer metabolic reprogramming and immune response. Mol Cancer. 2021;20(1):28. doi:10.1186/s12943-021-01316-8
- Hou J, Karin M, Sun B. Targeting cancer-promoting inflammation- have anti-inflammatory therapies come of age? Nat Rev Clin Oncol. 2021;18(5):261–279. doi:10.1038/s41571-020-00459-9
- Deets KA, Vance RE. Inflammasomes and adaptive immune responses. Nat Immunol. 2021;22(4):412–422. doi:10.1038/s41590-021-00869-6
- Abraham SA, Hopcroft LE, Carrick E, et al. Dual targeting of p53 and c-MYC selectively eliminates leukaemic stem cells. Nature. 2016;534(7607):341–346. doi:10.1038/nature18288
- von Klot CA, Dubrowinskaja N, Peters I, et al. Rho GDP dissociation inhibitor-β in renal cell carcinoma. Oncol Lett. 2017;14(6):8190–8196. doi:10.3892/ol.2017.7233.
- Niu H, Li H, Xu C, et al. Expression profile of RhoGDI2 in lung cancers and role of RhoGDI2 in lung cancer metastasis. Oncol Rep. 2010;24(2):465–471. doi:10.3892/or_00000880
- Zhu J, Tian Z, Li Y, et al. ATG7 promotes bladder cancer invasion via autophagy-mediated increased ARHGDIB mRNA stability. Adv Sci (Weinh). 2021;8(22):e2104365. doi:10.1002/advs.202104365
- Ma L, Xu G, Sotnikova A, et al. Loss of expression of LyGDI (ARHGDIB), a rho GDP-dissociation inhibitor, in Hodgkin lymphoma. Br J Haematol. 2007;139(2):217–223. doi:10.1111/j.1365-2141.2007.06782.x
- Liu L, Cui J, Zhao Y, et al. KDM6A-ARHGDIB axis blocks metastasis of bladder cancer by inhibiting Rac1. Mol Cancer. 2021;20(1):77. doi:10.1186/s12943-021-01369-9
- Harding MA, Theodorescu D. RhoGDI2: a new metastasis suppressor gene: discovery and clinical translation. Urol Oncol. 2007;25(5):401–406. doi:10.1016/j.urolonc.2007.05.006