
ABSTRACT
Objective: Diffuse Large B-Cell Lymphoma (DLBCL) is a common and frequently occurring subtype of Non-Hodgkin Lymphoma (NHL). The effective treatment and prognosis of DLBCL are still urgently needed to be explored. This article aims to shed light on the connection between DLBCL survival and NR3C1 expression levels. Methods: First, we divided the 952 DLBCL patients into an NR3C1 high-expression group and an NR3C1 low-expression group and compared the baseline characteristics of the two groups. Second, we used multivariate analysis to predict the dependent variable for age, pathology, ECOG score, lactate dehydrogenase (LDH) ratio, and NR3C1 expression level. Finally, we analyzed the progression-free survival (PFS) and overall survival rate (OS) of DLBCL patients with high or low NR3C1 expression. Results: DLBCL patients with high NR3C1 expression had a better prognosis than those with low NR3C1 expression (OS, P < 0.0001). In DLBCL patients of CHOP therapy, high NR3C1 expression was associated with a good survival prognosis in OS (OS, P = 0.028). Conclusion: In multivariate analysis, NR3C1 high expression was an independent prognostic factor that predicted a longer OS of DLBCL (OS, P = 0.0003). NR3C1 is considered an independent predictor of DLBCL patients and can be used as a biomarker for the prognosis of DLBCL.
Introduction
Diffuse Large B-Cell Lymphoma (DLBCL) is a common and frequently-occurring subtype of Non-Hodgkin Lymphoma, with a higher prevalence in adulthood, and more than 20,000 new cases of DLBCL are diagnosed each year around the world. Previous studies of gene expression profiling (GEP) have shown that DLBCL can be identified into different molecular subgroups: According to the 2022 National Comprehensive Cancer Network (NCCN) guidelines for DLBCL non-specific types (NOS), DLBCL can be divided into three subtypes, including germinal, non-germinal and others. The three kinds of subgroups differ in their pathogenesis and outcomes [Citation1, Citation2].
The DLBCL diagnosis standard follows the diagnostic criteria of the World Health Organization classification [Citation3]. And the International Prognostic Index (IPI), which incorporates details about the age, LDH, ECOG performance status, stage, and extranodal disease, is also of great value in planning therapy. Patients whose long-term survival is poor, usually present with advanced-stage DLBCL (stage III or IV), a high IPI score, elevated lactate dehydrogenase, extranodal involvement, and the development of systemic symptoms.
Earlier studies have shown alternative pathogenesis models that comprise various somatic genomic mutations, chromosomal translocations, escaping from immune surveillance, and aberrant somatic hypermutation (ASHM). B. Chapuy [Citation4] integrated the genetically heterogeneous DLBCL into 5 clusters based on the consensus clustering in 304 patients, including 1) A group of low-risk ABC-DLBCLs arises from the B cells in the extrafollicular/marginal zone; 2) Two distinct groups of GCB-DLBCLs differ in outcomes and targetable alterations; 3) an ABC/GCB-independent group inactivated both TP53 and CDKN2A with the unstable genome. R. Schmitz [Citation5] established a classification in DLBCL and found these genetic subtypes differed in their outcomes after immunochemotherapy, including 1) The MCD genetic subtype, which contains MYD88 and CD79B mutations, which are associated with a response to ibrutinib. 2) The BN2 subtype, which contains BCL6 fusions and NOTCH2 mutations, also associates with ibrutinib. 3) The N1 subtype, which differs from BN2 in genetic, phenotypical, and clinical aspects. 4) The EZB subtype, which concentrated most of the genetic lesions associated with the GCB subtype. In addition to these, it is known that the most common cytogenetic abnormalities in DLBCL are the oncogenes BCL2, BCL6, and MYC, and MYC aberrations are usually associated with rearrangements of BCL2 and/or BCL6 [Citation6].
For the mechanisms and pathways revealed, therapies were opened up to target some specific points of DLBCL. Since the 1990s, the standard chemotherapy has been the combination of cyclophosphamide, doxorubicin, vincristine, and prednisone (CHOP). This protocol was approved by adding rituximab to the R-CHOP receipt, which allows the therapy to produce better survival. Still, acha the lounge persists that approximately 40% of DLBCL patients are not cured under formal therapy [Citation7, Citation8]. The first two years after completion of treatment are usually the time point for relapses. Relapses may also occur five years after treatment. It is reported that patients diagnosed with a localized stage, a good IPI score, and extranodal involvement are more likely to encounter a late relapse [Citation9]. In subsequent research, DLBCL patients who had a concurrent indolent lymphoma at the same time and patients with the GCB subtype would have a higher possibility of late relapse [Citation4]. A relapse in DLBCL leads to a worse consequence than a relapse in indolent lymphoma. From the above, the effective treatment and prognosis of DLBCL are still urgent to explore.
NR3C1 is the gene that encodes glucocorticoid receptor (GR) [Citation10]. The NR3C1 is reported to be ubiquitous and expressed in many tissues, including fat, lung, bone marrow, and 25 other tissues [Citation11]. When the NR3C1 gene encounters mutations, glucocorticoid resistance will be generalized. Previous funding shows that the diverse translational regulations of GR result in many physiological mechanisms ranging from mitosis to apoptosis [Citation12]. Some previous reports proposed that cell-type-specific GR isoforms may play a vital role in glucocorticoid control [Citation13]. The induction of apoptosis and/or cell cycle arrest is identified as key drug targets for the treatment of pediatric acute lymphoblastic leukemia (ALL) [Citation14]. In different hematologic malignancy research, NR3C1 haploinsufficiency was found to result in corticoid resistance and loss of EZH2 function, which may lead to the extremely poor overall survival of specific pathological types [Citation15]. However, there are no studies on the relationship between NR3C1 and DLBCL. Thus, we addressed the expression level of NR3C1 among 952 DLBCL patients. In this study, we reported the PFS and OS of DLBCL patients with NR3C1 high or low expression and the PFS and OS of NR3C1 high or low expression in DLBCL patients under CHOP therapy and R-CHOP therapy.
Materials and methods
Data source and gene expression analysis
In our study, gene expression microarrays of 952 DLBCL patients were derived from the Gene Expression Omnibus database, including datasets GSE10846 (n = 414) [Citation16], GSE34171 (n = 68) [Citation17, Citation18], GSE31312 (n = 470) [Citation19, Citation20]. The selection criteria for DLBCL patients in our research were designed as follows: 1) All patients should have high throughput gene expression data. 2) All the patients should have some clinical features (biochemical, examination, karyotype, therapy, or therapy response). We divided patients into an NR3C1 high-expression group and an NR3C1 low-expression group based on NR3C1 expression levels. PFS and OS are clinical endpoints. The length of time that a patient lives with the disease but does not get worse during or after the treatment was defined as patient-friendly survival. The time from diagnosis to death for any cause or to the last follow-up was defined as the OS. The GPL570 Affymetrix Human Genome U133 Plus 2.0 Array was used for GSE10846 (n = 414), GSE31312 (n = 470), and GSE34171 (n = 68). The raw cel files were converted to probeset-specific expression values using Microarray Suite version 5.0 (MAS 5.0) with default Affymetrix analysis settings and global scaling as the method of normalization. The average trimmed target intensity of each array was arbitrarily set at 500. The research was conducted according to the International Conference on Human Rights and the Declaration of Helsinki. The Human Research Ethics Committee of Peking University Third Hospital approved the study.
We studied a total of 414 DLBCL patients from the GEO dataset GSE10846. Among these, 181 DLBCL patients underwent CHOP, and 233 patients received R-CHOP chemotherapy. All the gene expression was detected by the gene microarray method in DLBCL patients. The survival prognosis of OS in DLBCL patients was analyzed by NR3C1 gene expression. The OS of DLBCL patients under CHOP and R-CHOP therapy was then further studied. With statistical analysis, we excluded the influence of the two different treatment modalities on the patients' OS (Figure S1).
We studied a total of 68 DLBCL patients from GSE34171. The gene microarray method was used to detect all the gene expressions in DLBCL patients. We use NR3C1 gene expression to analyze the survival prognosis of OS in DLBCL patients.
We studied a total of 470 DLBCL patients from the GSE31312. All the gene expression in the DLBCL patients was detected by the gene microarray method. The survival prognosis of OS, as well as the PFS prognosis in DLBCL patients, were analyzed by NR3C1 gene expression.
Statistical analyses
Statistical analyses were accomplished by R software v3.1.3 (ggplot2 and the survminer package). We used descriptive statistics to summarize the clinical characteristics of DLBCL patients. Survival analysis was assessed by the log-rank test and Kaplan – Meier curves. To analyze the changes from baseline characteristics of DLBCL patients, we used Fisher’s exact test to analyze for Eastern Cooperative Oncology Group (ECOG) performance status, ISS score, gender, pathologic type, number of extranodal disease sites, and chemotherapies. We use the T-test to analyze the differences in clinical age and LDH between the NR3C1 high-expression group and the NR3C1 low-expression group. Multivariate analysis of OS in GSE10846 was performed using Cox regression analysis. P-value < 0.05 was considered statistically significant.
Results
Clinical baseline features of DLBCL
DLBCL patients from GSE10846 (n = 414) were divided into two groups ( and Table S1). Among 414 patients with DLBCL, 62 patients have a lowly expressed NR3C1 level, and 352 patients have a highly expressed level of NR3C1. We analyzed the age, gender, chemotherapy regimens, different subtypes, ECOG status, ISS stages, the extranodal site performance, and the LDH under the two different NR3C1 gene expression level groups. The ECOG performance status (P = 0.264, Fisher’s exact test), ISS score (P = 0.301, Fisher’s exact test), variable age (P = 0.261, Unpaired t-test, two-sided), gender (P = 0.559, Fisher’s exact test), and LDH (P = 0.675, Unpaired t-test, two-sided) between two NR3C1 expression groups have no significant difference. However, the treatments (CHOP-like and R-CHOP-like), pathologic types (ABC or GCB type), and a number of extranodal sites are different between the high and low NR3C1 expression groups (P < 0.05, Fisher’s exact test).
Table 1. Baseline patient characteristics according to the expression level of NR3C1 in 414 DLCBL patients of the GSE10846 dataset.
High NR3C1 gene expression predicts better survival in DLBCL patients
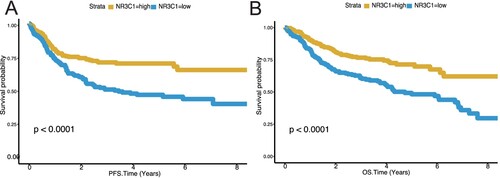
A survival difference between the NR3C1 high-expression groups and the NR3C1 low-expression groups was found in the training set (n = 414). Patients with high NR3C1 expression had a higher OS, while patients with low NR3C1 expression had a lower OS (A, OS, P < 0.0001, log-rank test). Then we use the dataset GSE34171 (n = 68) as a validation dataset to evaluate the prognostic efficiency of the NR3C1 expression level for patients' OS predictions. We found that patients with low NR3C1 expression exhibited poorer OS than those with high NR3C1 expression (B, OS, P < 0.0001, log-rank test). Then we analyzed the NR3C1 gene expression profiles of PFS and OS in 470 DLBCL patients from another validation dataset, the GSE31312 (n = 470). Patients with high NR3C1 expression had a better prognosis in PFS than low NR3C1 expression (A, PFS, P < 0.0001, log-rank test), and patients with low NR3C1 expression in DLBCL had a worse prognosis in OS than high NR3C1 expression (B, OS, P < 0.0001, log-rank test). All the findings in the training and validation datasets indicate that high NR3C1 expression has a good prognosis in patients with DLBCL.
Figure 1. Low NR3C1 expression predicts worse overall survival of DLBCL in GSE10846 (n = 414) and GSE34171 (n = 68). A, OS in different NR3C1 expression groups of DLBCL in the GSE10846 dataset. Kaplan – Meier curves were used. OS, P < 0.0001, log-rank test. The X-axis represents the OS time (years), and the Y-axis represents survival probability. The yellow line represents the NR3C1-high group (n = 352), and the blue line represents the NR3C1-low group (n = 62). OS: overall survival rate. B, OS in different NR3C1 expression groups of DLBCL in the GSE34171 dataset. Kaplan – Meier curves were used. OS, P < 0.0001, log-rank test. The X-axis represents the OS time (years), and the Y-axis represents survival probability. The yellow line represents the NR3C1-high group (n = 56), and the blue line represents the NR3C1-low group (n = 12). OS: overall survival rate.
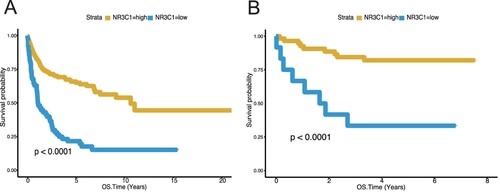
Figure 2. Low NR3C1 expression predicts worse overall survival and worse progression-free survival of DLBCL in GSE31312 (n = 470). A, PFS in different NR3C1 expression groups of DLBCL in the GSE31312 dataset. Kaplan – Meier curves were used. OS, P < 0.0001, log-rank test. The X-axis represents OS time (years) and PFS time (years), and the Y-axis represents survival probability. The yellow line represents the NR3C1-high group (n = 258), and the blue line represents the NR3C1-low group (n = 212). OS: overall survival rate. PFS: progression-free survival rate. B, OS in different NR3C1 expression groups of DLBCL in the GSE31312 dataset. Kaplan – Meier curves were used. PFS, P < 0.0001, log-rank test. The X-axis represents OS time (years) and PFS time (years), and the Y-axis represents survival probability. The yellow line represents the NR3C1-high group (n = 258), and the blue line represents the NR3C1-low group (n = 212). OS: overall survival rate. PFS: progression-free survival rate.
NR3C1 expression level predicts survival after CHOP therapy and R-CHOP therapy in DLBCL patients
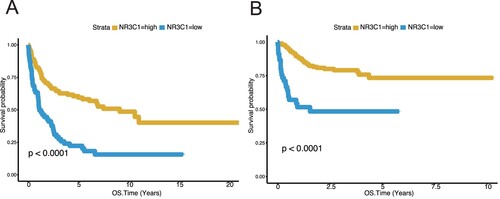
To examine the expression level of NR3C1 in DLBCL patients after CHOP or R-CHOP chemotherapy, we use the GSE10846 dataset to investigate the gene expression of NR3C1 in OS. In the subgroup of CHOP-treated patients (n = 181) the NR3C1-low expression cluster showed unfavorable OS relative to the NR3C1-high expression clusters (A, OS, P < 0.0001, log-rank test). In R-CHOP therapy (n = 233) the conclusions were in good agreement with the CHOP therapy. In OS, the NR3C1 high-expression group was associated with better survival of R-CHOP patients, while the NR3C1 low-expression group had poor survival after R-CHOP therapy (B, OS, P < 0.0001, log-rank test). Furthermore, we excluded the influence of the two different treatment modalities, CHOP and R-CHOP, on the patients’ OS (Figure S1).
Figure 3. High NR3C1 expression predicts better survival of CHOP or R-CHOP therapy DLBCL patients from the GSE10846 (n = 414) dataset. A, OS in different NR3C1 expression groups after CHOP therapy of DLBCL in the GSE10846 dataset Kaplan – Meier curves were used. The X-axis represents the OS time (years), and the Y-axis represents survival probability. OS, P < 0.0001, log-rank test. The yellow line represents the NR3C1-high group (n = 121), and the blue line represents the NR3C1-low group (n = 60). OS: overall survival rate. B, OS in different NR3C1 expression groups receives R-CHOP therapy for DLBCL in the GSE10846 dataset. Kaplan – Meier curves were used. The X-axis represents the OS time (years), and the Y-axis represents survival probability. OS, P < 0.0001, log-rank test. The yellow line represents the NR3C1-high group (n = 188), and the blue line represents the NR3C1-low group (n = 45). OS: overall survival rate.
Multivariate analysis of OS
The multivariate analysis assessed 414 DLBCL patients in GSE10846 for the independent risk factors of clinical prognosis in OS. In the multivariate analysis (), age (> 60 vs < = 60 years, HR = 2, P = 0.0008), pathology (GCB vs ABC, HR = 0.6, P = 0.0089), ECOG score (> = 2 vs <2, HR = 2.1, P = 0.0005), LDH ratio (>1 vs < = 1, HR = 2.1, P = 0.0003) and NR3C1 (High vs Low, HR = 0.4, P = 0.0003) are prognostic factors for DLBCL. Of note, NR3C1 expression and LDH levels were counted as having the minimum P score, indicating that NR3C1 expression as well as LDH levels are significantly associated with OS. The chemotherapy regimens (R-CHOP vs CHOP, HR = 0.8, P = 0.3003), ISS stage (> = 2 vs <2, HR = 2.0, P = 0.0779), and several extranodal disease sites (> = 2 vs <2, HR = 1.6, P = 0.2609) were not independent predictors of OS in the GSE10846 dataset. Initial results of multivariate analysis showed that NR3C1 (High vs Low, HR = 0.4, P = 0.0003) is a prognostic factor independent of age, pathology, ECOG, and LDH ratio in DLBCL patients.
Table 2. Multivariate analysis for OS in 414 DLCBL patients of the GSE10846 dataset.
Discussion
Diffuse large B-cell lymphoma is one of the most common types of non-Hodgkin lymphoma, with a two-thirds cure rate. According to the gene expression profile of DLBCL, more and more novel insights have been put into the molecular mechanisms of the respective DLBCL, thus improving the targets for early diagnosis, prognosis evaluation, and novel targeted drugs. The NR3C1 gene's function in modulating physiological processes includes inflammatory responses, cellular proliferation, and differentiation in target tissues. However, the prediction and prognostic significance of NR3C1 in DLBCL patients have not been studied. Only a handful of mechanisms for NR3C1 in cancer were reported, and none are specific to DLBCL. Therefore, we analyzed the expression level of the NR3C1 gene in patients with DLBCL and found that NR3C1 can be used as a feasible biomarker. We found that DLBCL patients with high NR3C1 expression had a good prognosis when we analyzed the difference in survival between the high and low NR3C1 expression groups. Afterward, to exclude any effect of CHOP and R-CHOP treatment methods on the results, we analyzed NR3C1 expression in the two treatment subgroups differently. We found that in the CHOP treatment group, patients in the low NR3C1 expression group had shorter OS and PFS. The conclusions reached in the R-CHOP group were consistent with those in the CHOP treatment group. That is, high NR3C1 expression was associated with a good prognosis. Thus, in this study, we have shown that DLBCL patients with high NR3C1 expression are associated with a good prognosis. In multiple factor analysis, these results were statistically significant. Therefore, it may be useful to distinguish patients with significantly worse prognoses with low NR3C1 expression and provide individualized treatment to improve their prognosis.
NR3C1 was reported to function in many hematologic malignancies as well as nonhematologic tumors, and NR3C1 also plays a critical role in immune response and B cell development. In nonhematologic tumors, 1) Hypermethylation and variation of NR3C1 cause NR3C1 gene absence or reduction, which are significantly associated with colorectal cancer as well as gastric tumorigenesis [Citation21–24]. 2) NR3C1 is significantly up-regulated in adrenocortical carcinoma (ACC), which shows poor prognosis [Citation25]. 3) In ER + breast cancer, NR3C1 high expression is significantly associated with a better outcome than NR3C1 low expression [Citation26]. 4) NR3C1 low expression may be related to liver metastasis [Citation27]. In hematologic malignancies, 1) 10% of childhood ETV6/RUNX1-positive B-cell acute lymphoblastic leukemia (B-ALL) was associated with loss of the NR3C1 gene expression [Citation28]. 2) Baltic plasmacytoid dendritic cell neoplasm (BPDCN) is a kind of highly aggressive leukemia that was found to be related to NR3C1 deletion [Citation15]. 3) NR3C1 deletion was significantly associated with relapsed childhood B-cell precursor acute lymphoblastic leukemia, linked with induction failure, second relapse, and OS. Patients with an NR3C1 deletion may increase their risk of death [Citation29]. 4) NR3C1 plays a vital role in B cell activation, and survival, and has profound alterations in B cell proliferation and differentiation. NR3C1 has a central effect on glucose restriction and the energy supply of B-lymphoid. Loss of NR3C1 may relate to glucose uptake and the consumption of ATP [Citation30]. So, according to most of the studies, NR3C1 reduction or low expression could cause malignant tumors and show a poor prognosis, especially in B-cell malignancies. This is in line with our research results. By investigating NR3C1 expression on DLBCL, we found DLBCL patients with low NR3C1 expression had a lower OS and a lower PFS, and high expression of the NR3C1 gene predicted a good prognosis for DLBCL.
NR3C1 also plays a vital role in the therapy for hematological tumors. 1) It was reported that gene deletions or duplications cause inactivating mutations of the NR3C1 and result in glucocorticoid resistance syndrome (GRS) [Citation31]. In B-cell acute lymphoblastic leukemia cell lines, NR3C1 deletion was found to result in glucocorticoid resistance, and NR3C1 ectopic expression could reverse GC resistance [Citation32]. Glucocorticoids such as dexamethasone and prednisolone are the regulated regimens for treating most lymphoid tumors. The standard R-CHOP therapy in DLBCL treatment is also a hormonal therapy containing prednisone, which belongs to the class of corticosteroids. 2) Multiple myeloma (MM) is a hematologic tumor derived from the neoplastic proliferation of plasma cells, and the VTD (bortezomib, thalidomide, and dexamethasone) therapy for MM is also a hormone-led therapy. In multiple myeloma patients treated with VTD, NR3C1 high expression levels were related to longer OS and EFS, and NR3C1 low expression levels showed shorter OS and EFS [Citation33]. In our research, we found DLBCL patients with NR3C1 high expression would have a longer OS after R-CHOP or CHOP treatment, while NR3C1’s low expression has a poorer prognosis after R-CHOP or CHOP therapy. Our results are from the previous study of multiple myeloma patients after VTD therapy.
The study has some shortcomings. We imply that NR3C1 has a specific survival rate to CHOP therapy and R-CHOP therapy; further research is required to clarify the molecular mechanism of this gene. It remains to be seen whether NR3C1 low expression and NR3C1 high expression are specific in other lymphoma types. From these aspects, we can get down to further study.
Conclusion
In conclusion, our results indicate that NR3C1' s high expression is a good prognostic factor for DLBCL. These results suggest that NR3C1 could provide a new perspective on the prognostic potential of DLBCL patients.
Disclosure statement
No potential conflict of interest was reported by the author(s).
Additional information
Funding
References
- Sehn LH, Gascoyne RD. Diffuse large B-cell lymphoma: optimizing outcome in the context of clinical and biologic heterogeneity. Blood. 2015;125:22–32. doi:10.1182/blood-2014-05-577189
- Havranek O, et al. Tonic B-cell receptor signaling in diffuse large B-cell lymphoma. Blood. 2017;130:995–1006. doi:10.1182/blood-2016-10-747303
- Vardiman JW, et al. The 2008 revision of the world health organization (WHO) classification of myeloid neoplasms and acute leukemia: rationale and important changes. Blood. 2009;114:937–951. doi:10.1182/blood-2009-03-209262
- Wang Y, et al. Late relapses in patients with diffuse large B-cell lymphoma treated with immunochemotherapy. J Clin Oncol. 2019;37:1819–1827. doi:10.1200/JCO.19.00014
- Pasqualucci L, Dalla-Favera R. Genetics of diffuse large B-cell lymphoma. Blood. 2018;131:2307–2319. doi:10.1182/blood-2017-11-764332
- Akyurek N, Uner A, Benekli M, et al. Prognostic significance of MYC, BCL2, and BCL6 rearrangements in patients with diffuse large B-cell lymphoma treated with cyclophosphamide, doxorubicin, vincristine, and prednisone plus rituximab. Cancer. 2012;118:4173–4183. doi:10.1002/cncr.27396
- Alizadeh AA, et al. Distinct types of diffuse large B-cell lymphoma identified by gene expression profiling. Nature. 2000;403:503–511. doi:10.1038/35000501
- Hu S, et al. CD30 expression defines a novel subgroup of diffuse large B-cell lymphoma with favorable prognosis and distinct gene expression signature: a report from the international DLBCL rituximab-CHOP consortium program study. Blood. 2013;121:2715–2724. doi:10.1182/blood-2012-10-461848
- Landsburg DJ, et al. Sole rearrangement but not amplification of MYC is associated with a poor prognosis in patients with diffuse large B cell lymphoma and B cell lymphoma unclassifiable. Br J Haematol. 2016;175:631–640. doi:10.1111/bjh.14282
- Encio IJ, Detera-Wadleigh SD. The genomic structure of the human glucocorticoid receptor. J Biol Chem. 1991;266:7182–7188. doi:10.1016/S0021-9258(20)89627-6
- Lu NZ, Cidlowski JA. Translational regulatory mechanisms generate N-terminal glucocorticoid receptor isoforms with unique transcriptional target genes. Mol Cell. 2005;18:331–342. doi:10.1016/j.molcel.2005.03.025
- Newton R. Anti-inflammatory glucocorticoids: changing concepts. Eur J Pharmacol. 2014;724:231–236. doi:10.1016/j.ejphar.2013.05.035
- Lu NZ, Cidlowski JA. The origin and functions of multiple human glucocorticoid receptor isoforms. Ann N Y Acad Sci. 2004;1024:102–123. doi:10.1196/annals.1321.008
- El-Fayoumi R, Hagras M, Abozenadaha A, et al. Association between NR3C1 gene polymorphisms and toxicity induced by glucocorticoids therapy in Saudi children with acute lymphoblastic leukemia. Asian Pac J Trop. 2018;19:1415–1423.
- Emadali A, et al. Haploinsufficiency for NR3C1, the gene encoding the glucocorticoid receptor, in blastic plasmacytoid dendritic cell neoplasms. Blood. 2016;127:3040–3053. doi:10.1182/blood-2015-09-671040
- Cardesa-Salzmann TM, et al. High microvessel density determines a poor outcome in patients with diffuse large B-cell lymphoma treated with rituximab plus chemotherapy. Haematologica. 2011;96:996–1001. doi:10.3324/haematol.2010.037408
- Chen L, et al. SYK inhibition modulates distinct PI3K/AKT- dependent survival pathways and cholesterol biosynthesis in diffuse large B cell lymphomas. Cancer Cell. 2013;23:826–838. doi:10.1016/j.ccr.2013.05.002
- Monti S, et al. Integrative analysis reveals an outcome-associated and targetable pattern of p53 and cell cycle deregulation in diffuse large B cell lymphoma. Cancer Cell. 2012;22:359–372. doi:10.1016/j.ccr.2012.07.014
- Frei E, et al. Addition of rituximab to chemotherapy overcomes the negative prognostic impact of cyclin E expression in diffuse large B-cell lymphoma. J Clin Pathol. 2013;66:956–961. doi:10.1136/jclinpath-2013-201619
- Xu-Monette ZY, et al. MDM2 phenotypic and genotypic profiling, respective to TP53 genetic status, in diffuse large B-cell lymphoma patients treated with rituximab-CHOP immunochemotherapy: a report from the international DLBCL rituximab-CHOP consortium program. Blood. 2013;122:2630–2640. doi:10.1182/blood-2012-12-473702
- Aranda CJ, et al. Intestinal epithelial deletion of the glucocorticoid receptor NR3C1 alters expression of inflammatory mediators and barrier function. FASEB J. 2019;33:14067–14082. doi:10.1096/fj.201900404RR
- Lind GE, et al. ADAMTS1, CRABP1, and NR3C1 were identified as epigenetically deregulated genes in colorectal tumorigenesis. Cell Oncol. 2006;28:259–272.
- Ahlquist T, et al. Gene methylation profiles of normal mucosa, and benign and malignant colorectal tumors identify early onset markers. Mol Cancer. 2008;7(94.
- Gu Y, et al. Functional polymorphisms inNR3C1are associated with gastric cancer risk in Chinese population. Oncotarget. 2017;8:105312–105319. doi:10.18632/oncotarget.22172
- Tacon LJ, et al. The glucocorticoid receptor is overexpressed in malignant adrenocortical tumors. J Clin Endocrinol Metab. 2009;94:4591–4599. doi:10.1210/jc.2009-0546
- Pan D, Kocherginsky M, Conzen SD. Activation of the glucocorticoid receptor is associated with poor prognosis in estrogen receptor-negative breast cancer. Cancer Res. 2011;71:6360–6370. doi:10.1158/0008-5472.CAN-11-0362
- Chang W, et al. Identification of novel hub genes associated with liver metastasis of gastric cancer. Int J Cancer. 2009;125:2844–2853. doi:10.1002/ijc.24699
- Bokemeyer A, et al. Copy number genome alterations are associated with treatment response and outcome in relapsed childhood ETV6/RUNX1-positive acute lymphoblastic leukemia. Haematologica. 2014;99:706–714. doi:10.3324/haematol.2012.072470
- Irving JA, et al. Integration of genetic and clinical risk factors improves prognostication in relapsed childhood B-cell precursor acute lymphoblastic leukemia. Blood. 2016;128:911–922. doi:10.1182/blood-2016-03-704973
- Chan LN, et al. Metabolic gatekeeper function of B-lymphoid transcription factors. Nature. 2017;542:479–483. doi:10.1038/nature21076
- Al Argan R, Saskin A, Yang JW, et al. Glucocorticoid resistance syndrome caused by a novel <i>NR3C1</i> point mutation. Endocr J. 2018;65:1139–1146. doi:10.1507/endocrj.EJ18-0135
- Julien S, et al. Characterization of a large panel of patient-derived tumor xenografts representing the clinical heterogeneity of human colorectal cancer. Clin Cancer Res. 2012;18:5314–5328. doi:10.1158/1078-0432.CCR-12-0372
- van Rhee F, et al. Total therapy 3 for multiple myeloma: prognostic implications of cumulative dosing and premature discontinuation of VTD maintenance components, bortezomib, thalidomide, and dexamethasone, relevant to all phases of therapy. Blood. 2010;116:1220–1227. doi:10.1182/blood-2010-01-264333