
ABSTRACT
Background
: Erythroid cells play important roles in hemostasis and disease. However, there is still significant knowledge gap regarding stress erythropoiesis.
Methods
: Two single-cell RNAseq datasets of erythroid cells on GEO with accession numbers GSE149938 and GSE184916 were obtained. The datasets from two sources, bone marrow and peripheral blood were analyzed using Seurat v4.1.1, and other tools in R. QC metrics were performed, data were normalized and scaled. Principal components that capture the variation of the data were determined. In clustering the cells, KNN graph was constructed and Louvain algorithm was applied to optimize the standard modularity function. Clusters were defined via differential expression of features.
Results
We identified 9 different cell types, with a particular cluster representing the stress erythroids. The clusters showed differentially expressed genes as observed from the gene signature plot. The stress erythroid cluster differentially expressed some genes including ALAS2, HEMGN, and GUK1.
Conclusion
The erythroid population was found to be heterogeneous, with a distinct sub-cell type constituting the stress erythroids; this may have important implications for our knowledge of steady-state and stress erythropoiesis, and the markers found in this cluster may prove useful for future research into the dynamics of stress erythroid progenitor cell differentiation.
Background
Erythrocytes, a type of blood cell, are involved in a wide variety of processes, including gaseous exchange, pH and redox homeostasis maintenance, controlling vascular tone, and blood coagulation [Citation1–3].
Erythrocytes are produced by a process called erythropoiesis, which occurs mostly in the bone marrow and ends in the bloodstream. Transforming multipotent hematopoietic stem cells into adult red blood cells (RBCs), which are highly functional specialized cells, requires a complex maturation process including many morphological changes [Citation4].
Steady-state erythropoiesis produces many erythrocytes, with adults making about 2.5 × 10⁶ erythrocytes every second [Citation5]. Inadequate or inhibited erythrocyte synthesis results in increased erythroid production. The steady-state erythropoiesis that normally compensates for erythrocyte loss is suppressed when inflammation from infection or tissue injury is present. These conditions favor the BMP4-dependent stress erythropoiesis pathway [Citation6]. Stress-induced BMP4-dependent erythropoiesis differs from steady-state.
Stress erythropoiesis is the process by which the body increases the production of RBCs in response to various stressors, such as anemia, hypoxia, or inflammation [Citation6]. Important for this process are cells called reticulocytes. According to studies, stress erythropoiesis causes the bone marrow to produce and release more reticulocytes [Citation7]. It is believed that this is the body’s technique for rapidly increasing the amount of fully developed red blood cells in circulation in response to a stressor, thereby meeting the increased oxygen demand that results from the stress.
Numerous studies have looked into the involvement of erythropoietin (Epo) and other signaling pathways in regulating stress erythropoiesis at the molecular and cellular levels. For example, research has shown that the transcription factor hypoxia-inducible factor 1 (HIF-1) is a key regulator of stress erythropoiesis, as it controls the expression of erythropoietin in response to hypoxia [Citation8]. Also, IL-1 β promote the proliferation of stress erythroid progenitors (SEPs) [Citation7]. As the SEPs proliferate, increased expression of Epo by the kidney promotes the transition of SEPs to stress BFU-E. Epo also induces the expression of erythroferrone (Erfe), which antagonizes hepcidin and releases iron for the differentiation of stress BFU-E [Citation9]. As a result of these occurrences, stress erythropoiesis is rapidly induced, leading to the production of stress BFU-E during the subsequent 6 days and a steady increase in the percentage of reticulocytes over the subsequent 14 days of recovery [Citation7]. These stress erythroid progenitors are derived from short-term hematopoietic stem cells (ST-HSCs) in the bone marrow [Citation33]. These cells have the potential to generate all cell lineages, however, upon homing to the spleen, signals in the splenic micro-environment commit these cells to the erythroid lineage. Stress erythroid progenitors are present in healthy individuals, but following lineage restriction, the SEPs proliferate, but do not differentiate, generating a transient amplifying population of progenitor cells [Citation34].
In this study, we analyzed single-cell RNA-seq data of erythroid cells from bone marrow and peripheral blood in healthy adults, to determine the cellular heterogeneity of erythroid cells. The datasets used were those generated by Xie et al., [Citation10] and Jain et al., [Citation11] and deposited in NCBI GEO of accession numbers GSE149938 and GSE184916 respectively.
Methods
Data description
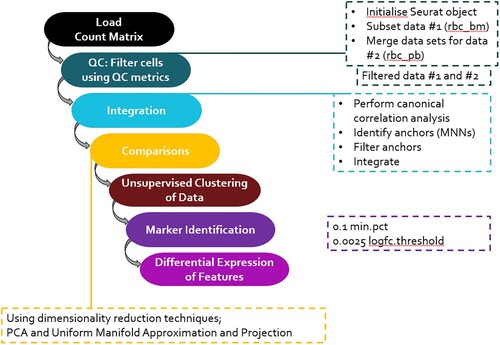
In this study, two transcriptomic data of blood cells from the bone marrow and peripheral blood deposited at the National Center for Biotechnology Information (NCBI) Gene Expression Omnibus (GEO) database were harnessed for data integration of erythroid cells, clustering analysis, and marker identification. The workflow is as shown in . The considered dataset is available at the NCBI GEO database. The GEO accessions of the scRNA seq dataset are GSE149938 and GSE184916. The blood samples used by Jain et al, to obtain their scRNA seq data, GSE184916, were collected from three adult healthy donors, which have been stored in the blood bank conditions and assayed at day 1 and day 15. We used the data assayed at day 1. Xie et al., profiled the transcriptomes of 7551 human blood cells representing 32 immunophenotypic cell types, including hematopoietic stem cells, progenitors and mature blood cells derived from 21 healthy donors. We used the erythrocytes dataset obtained from the bone marrow, GSE149938.
Figure 1. Workflow showing the processes followed in each stage of the analysis of the scRNA seq datasets.
Data integration
The two scRNA seq datasets were integrated using Seurat v4.1.1 for a more comprehensive understanding of cell behavior and function in reticulocytes. This method identifies anchors between pairs of datasets and use them to either harmonize information or transfer information from one dataset to another. The Seurat package (version 4.1.1) implemented in R (version 3.6.0) was used to remove batch effects, reduce dimension and cluster cells based on the UMI count. The two datasets were first split into two Seurat objects, after which the datasets were normalized and variable features were identified for each dataset independently, using the NormalizeData() and the FindVariableFeatures() in Seurat. The features that were repeatedly variable across the two datasets were selected for integration. The integration was then performed by first identifying anchors using the FindIntegrationAnchors() function, then integrating the two datasets together with IntegrateData() function with the default of 2000 features.
Clustering analysis
After doing some simple filtering for minimum gene and cell observance frequency cut-offs, data was initially normalized on the log scale in Seurat v4.1.1. First quality control was done to remove low quality cells (cells with low gene counts and high mitochondrial genes). The features were viewed using a violin plot. Low gene count was marked at <200 genes, while high mitochondrial level was marked at >5%. The data was then normalized in order to be able to compare the gene expression across multiple cells.
Regression techniques were used to remove further technical artifacts and minimize noise. Following quality control procedures, we determined principal components using our dataset's most variably expressed genes [Citation12]. Using techniques similar to those used by Macosko et al., [Citation13], significant principal components were identified, which were then used for downstream analysis. These significant principal components were then carried forward to perform cell clustering and to improve visualization. Seurat’s FindClusters () function [Citation12] was used to cluster cells, at a resolution of 0.6, into an ideal number of clusters for discovery of sources of heterogeneity, and t-distributed stochastic neighbor embedding (t-SNE) was used to visualize the cells, which reduced the information contained in the chosen significant principal components to two dimensions [Citation14].
Marker identification
‘FindAllMarkers’ from the Seurat package was used to detect cell type/cluster-specific signature genes, while ‘FindMarkers’ was applied to identify the DEGs between any two given groups. AUC scores of signature genes obtained by pROC represented the specificity of each gene for each cluster (ranging from 0 to 1; the larger the score, the more unique to each cluster). The filtered criteria for signature genes and DEGs was fold-change ≥ 1.5 or ≤0.67 and adjusted P-value ≤ 0.05. The marker with the lowest p-value was considered most significant, and named as a top marker for a particular cluster or cell type.
Limitations to the study
When compared to other nucleated cells, the number of transcripts per RBC is far lower. Since there are fewer transcripts, the principal component structure is simpler, and the resulting clustering pattern is lee resistant to random influences. Also, the datasets used for this analysis were gotten from RBC mRNA, which are not the most abundant RNA species in RBCs. As such, the heterogeneity of the erythroid cells may not have been fully captured. Instead, microRNAs are most abundant in RBCs and could provide a better dataset for RBCs heterogeneity analysis.
Results and discussion
Erythroid cells sub-populations as described by the differentially expressed genes
Single-cell RNA-seq data of erythroid cells generated by Xie et al., [Citation10] and Jain et al., [Citation11] and deposited in NCBI GEO of accession numbers GSE149938 and GSE184916 respectively were obtained. The datasets were from two different sources, the bone marrow and the peripheral blood. The datasets were analyzed using Seurat v4.1.1, and other tools in R.
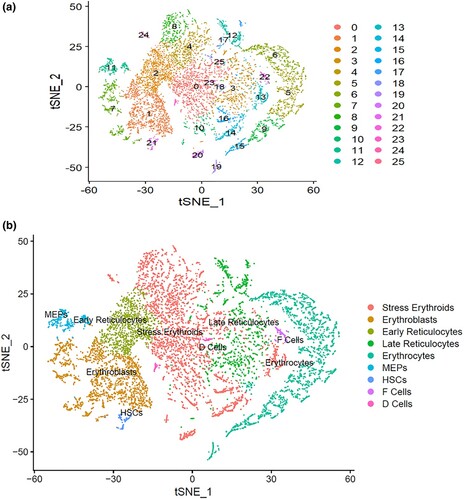
We integrated the two single-cell datasets followed by scaling of the dataset, linear dimensionality reduction and visualization by t-distributed stochastic neighbor embedding (t-SNE) plot. From the t-SNE analysis of the integrated datasets, we identified 26 different clusters ((A)) that were grouped into 9 cell types ((B)). Clusters 0, 4, 8, 10, 13, 14, 16, 20, 24 and 25 expressed markers of Stress erythroids. Clusters 1 and 7 expressed markers of the Erythroblasts. Clusters 3, 12, 17 and 18 expressed markers of late reticulocytes. Clusters 5, 6, 9, 15 and 19 formed the Erythrocytes. Clusters 2, 11, 21, 22 and 23 expressed markers of the early reticulocytes, megakaryocytes-erythroid progenitors (MEPs), Hematopoietic stem cells (HSCs), F-cells and D-cells respectively.
Figure 2. The tSNE plots of the integrated datasets showing the heterogeneous clusters of erythroid cells from bone marrow and from peripheral blood (A), identified under different cell types (B). Stress erythroids = clusters 0, 4, 8, 10, 13, 14, 16, 20, 24 and 25; Erythroblasts = clusters 1 and 7; Late reticulocytes = clusters 3, 12, 17 and 18; Erythrocytes = clusters 5, 6, 9, 15 and 19; Early reticulocytes = cluster 2; Megakaryocytes-erythroid progenitors (MEPs) = cluster 11; Hematopoietic stem cells (HSCs) = cluster 21; F-cells = cluster 22; and D-cells = cluster 23.
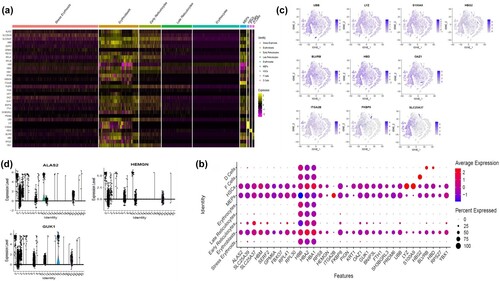
Next, the top marker genes in each of the clusters were identified and a heatmap plotted ((A)) to show these genes and their expression pattern in the different cell types. A gene signatures plot ((B)) was also plotted to illustrate which genes are differentially expressed in each of the cluster or the cell types. Furthermore, t-SNE plots were used to visualize the differentially expressed genes in different clusters ((C)). The different cell types showed a number of differentially expressed markers. For example, only one cluster showed a high expression of the HBG2 gene, which was corresponding to the cell type called the F-cells. The HBG2 is one of two genes responsible for the synthesis of the γ chains present in fetal hemoglobin (HbF) [Citation15]. HbF is the main haemoglobin in human zygotes within the second and third trimesters of intra-uterine life, and its expression continues until 4–6 months after birth before its synthesis is down-regulated to about 1%–2%, when β-haemoglobin becomes the predominant haemoglobin [Citation16]. Higher levels of HbF associated with sickle cell disease is linked with milder crises [Citation17], which has led to the many studies on trying to induce a sustained increase in HbF production.
Figure 3. Heterogeneity observed in the erythroid cell population: (A) Heatmap of the integrated scRNAseq dataset showing the expression patterns of the top marker genes in the 9 cell types. In the plot, high values are in yellow while how values are in purple. (B) Gene signature plot showing the average expression of differentially expressed features in the different cell types. This is showing both the magnitude of expression of the marker genes and the proportion of cells expressing the gene. (C) t-SNE plots displaying transcription activities for the differentially expressed genes in the different clusters of the erythroid population. Each t-SNE plot shows a particular gene marker that is differentially expressed in a specific cell type. (D) Violin plot showing the DEGs of the stress erythroid population in the different clusters.
Two clusters corresponding to the HSCs and the Erythroblasts expressed HBA1 and HBA2, while they differentially expressed (LYZ and S100A9) and HBB respectively. The HBA1 and HBA2 genes code for the alpha globin chains in hemoglobin [Citation18], with a defect in the genes leading to alpha thalassemia.
Another cluster corresponding to the D-cells differentially expressed BLVRB and HBD, while another cluster corresponding to the MEPs differentially expressed the ITGA2B. The BLVRB gene encodes for the protein biliverdine reductase, which catalyses the final stage of heme metabolism. The HBD gene codes for the hemoglobin delta subunit of hemoglobin, and is normally expressed in adults, though in small amounts. A mutation in the HBD gene results in Delta- thalassemia [Citation19]. ITGA2B gene, also known as CD41, encodes integrin alpha chain 2b. Integrins are integral membrane proteins with alpha and beta chains. Alpha chain 2b is post-translationally cleaved into disulfide-linked light and heavy chains that connect with beta 3 to generate a platelet-expressed fibrinogen receptor that is essential to coagulation. Mutations disrupting this function cause thrombasthenia [Citation20].
A cluster corresponding to the early reticulocytes showed the most number of differentially expressed genes with varying percentages of expression, including SLC25A37, HBM, SERF2, RPL41, RPL30 and YBX1. On the other hand the cluster corresponding to the late reticulocytes differentially expressed FKBP8. Differentiating erythroid cells express the SLC25A37 gene, which codes for the Mitoferrin-1 protein in humans [Citation21]. As a key component of mitochondrial iron homeostasis, this protein shuttles ferrous iron from the mitochondrial intermembrane space to the mitochondrial matrix, where it is used in the production of heme groups and Fe-S clusters, which are essential for erythropoiesis [Citation22]. Deficiencies in this protein have been linked to erythropoietic protoporphyria [Citation23].
Role of the stress erythroid differentially expressed markers in stress erythropoiesis
Given the importance of stress erythropoiesis in the amelioration of the symptoms of sickle cell anemia, we tried to understand the functions of some of the markers that were differentially expressed in the stress erythroid cluster. Stress erythroid progenitors initiate the process of stress erythropoiesis, which rapidly increases the production of reticulocytes and subsequently erythrocytes to compensate for the lost erythrocytes due to hemolysis of the sickle RBCs. The stress erythroid cluster of the erythroid population differentially expressed a number of markers ((B)), which were expressed by only a small number of cells in the cluster. The marker ALAS2 was expressed by only about 2% of the cells in this cluster. This gene encodes the mitochondria erythroid-specific 5’-aminolevulinate synthase (ALAS2) protein, also known as erythroid ALA synthase, which is an enzyme that catalyses the first step (a rate limiting step) in heme biosynthesis in erythroid cells [Citation24]. This gene is expressed in fetal liver and adult bone marrow, providing sufficient heme for hemoglobin biosynthesis.
Another marker that was expressed (at a p-value of 0.5) by a similar percentage of cells in this cluster was the HEMGN gene, which is homologous to human erythroid differentiation-associated gene (EDAG). An et al. [Citation25] identified HEMGN as a transcriptional modulator of hematopoietic development. GATA1 and HOXB4 control HEMGN's own transcription [Citation26]. Although HEMGN is primarily expressed in hematopoietic cells that are actively developing blood cells, it is down-regulated as blood cells differentiate. HEMGN recruits histone acetyltransferase p300 to acetylate GATA1 in order to favourably regulate erythroid differentiation of human CD34 + cells [Citation27]. HEMGN has recently been demonstrated to hasten human CD34 + cells’ entry into the cell cycle, increase their proliferative ability, and increase their capacity for repopulation [Citation28]. Additionally, HEMGN partly replicates the role of HOXB4 in encouraging the expansion of mouse myeloid progenitor cells ex vivo [Citation26]. A number of stresses, including differentiation induction, proliferation stimulation, irradiation, and hypoxia exposure, interestingly cause HEMGN expression to increase [Citation27,Citation29,Citation30]. This suggests that HEMGN may regulate how well HSPCs function under stress conditions, leading to the stress-induced induction of stress erythropoiesis.
Another gene differentially expressed by a small percentage of the cells in the stress erythroids cluster is the GUK1 gene, which encodes the enzyme guanylate kinase in humans [Citation31]. Erythropoietin modulates this enzyme by stimulating its phosphorylation. This enzyme is necessary for stress erythropoiesis because it generates GDP for nucleotide synthesis, a metabolic route that is considered to be a limiting factor under these conditions [Citation32].
Conclusion
The erythroid population showed heterogeneity, with a specific sub-cell type forming the stress erythroids. This could be significant for understanding steady-state and stress erythropoiesis, and the markers that were identified in this cluster could be helpful in the examination of the dynamics of stress erythroid progenitor cells differentiation during stress. Sickle cell disease is characterized by severe loss of erythrocytes which leads to induction of stress erythropoiesis in order to compensate for the loss. A study into the characterization of the stress erythroid population will give a more robust understanding of the treatment strategies for sickle cell disease.
Acknowledgements
We want to thank Xie et al., Citation2021 and Jain et al., Citation2022, for their single-cell RNA seq datasets on erythroid cells publicly made available for use on GEO.
Disclosure statement
No potential conflict of interest was reported by the author(s).
Data availability statement
The datasets used in this study are publicly available online. The two datasets (GSE149938 and GSE184916) were retrieved from the Gene Expression Omnibus (GEO) database on NCBI (https://www.ncbi.nlm.nih.gov/geo/).
Additional information
Funding
References
- Bernhardt I, Wesseling MC, Nguen DB, et al. Red blood cells actively contribute to blood coagulation and thrombus formation. In: A Tombak, editor. Erythrocyte. London: IntechOpen; 2019: 17-32.
- Helms CC, Gladwin MT, Kim-Shapiro DB. Erythrocytes and vascular function: oxygen and nitric oxide. Front Physiol. 2018;(9):125.
- Pernow J, Mahdi A, Yang J, et al. Red blood cell dysfunction: a new player in cardiovascular disease. Cardiovasc Res. 2019;115(11):1596–1605.
- Moras M, Lefevre SD, Ostuni MA. From erythroblasts to mature red blood cells: organelle clearance in mammals. Front Physiol. 2017;(8):1076.
- Seu KG, Papoin J, Fessler R, et al. Unraveling macrophage heterogeneity in erythroblastic islands. Front Immunol. 2017;(8):1140.
- Paulson RF, Ruan B, Hao S, et al. Stress erythropoiesis is a key inflammatory response. Cells. 2020;9(3):634.
- Bennett LF, Liao C, Quickel MD, et al. Inflammation induces stress erythropoiesis through heme-dependent activation of SPI-C. Sci Signal. 2019;12(598):eaap7336.
- Lee JW, Bae SH, Jeong JW, et al. Hypoxia-inducible factor (HIF-1) alpha: its protein stability and biological functions. Exp Mol Med. 2004;36(1):1–12.
- Arezes J, Foy N, McHugh K, et al. Erythroferrone inhibits the induction of hepcidin by BMP6. Blood. 2018;132(14):1473–1477.
- Xie X, Liu M, Zhang Y, et al. Single-cell transcriptomic landscape of human blood cells. Natl Sci Rev. 2021;8(3):nwaa180.
- Jain V, Yang WH, Wu J, et al. Single cell RNA-seq analysis of human red cells. Front Physiol. 2022;(13):648.
- Setup the Seurat Object. (2023). Seurat – guided clustering tutorial.
- Macosko EZ, Basu A, Satija R, et al. Highly parallel genome-wide expression profiling of individual cells using nanoliter droplets. Cell. 2015;161(5):1202–1214.
- McInnes L, Healy J, Melville J. (2018). Umap: uniform manifold approximation and projection for dimension reduction. arXiv preprint arXiv:1802.03426.
- Lanclos KD, Oner C, Dimovski AJ, et al. (1991). Sequence variations in the 5'flanking and IVS-II regions of the G gamma-and A gamma-globin genes of beta S chromosomes with five different haplotypes.
- Wang F, Yu J, Yang GH, et al. Regulation of erythroid differentiation by miR-376a and its targets. Cell Res. 2011;21(8):1196–1209.
- Akinsheye I, Alsultan A, Solovieff N, et al. Fetal hemoglobin in sickle cell anemia. Blood. 2011;118(1):19–27.
- Liebhaber SA, Goossens MJ, Kan YW. Cloning and complete nucleotide sequence of human 5'-alpha-globin gene. Proc Natl Acad Sci USA. 1980;77(12):7054–7058.
- Silva-Pinto AC, Silva TJ, Moretto EL, et al. Blood donor homozygous for Hb D Los Angeles. Transfus Apher Sci. 2014;51(2):219–220.
- Šimčíková D, Heneberg P. Refinement of evolutionary medicine predictions based on clinical evidence for the manifestations of Mendelian diseases. Sci Rep. 2019;9(1):1–17.
- Shaw GC, Cope JJ, Li L, et al. Mitoferrin is essential for erythroid iron assimilation. Nature. 2006;440(7080):96–100.
- Hentze MW, Muckenthaler MU, Galy B, et al. Two to tango: regulation of Mammalian iron metabolism. Cell. 2010;142(1):24–38.
- Wang Y, Langer NB, Shaw GC, et al. Abnormal mitoferrin-1 expression in patients with erythropoietic protoporphyria. Exp Hematol. 2011;39(7):784–794.
- Bishop DF, Henderson AS, Astrin KH. Human δ-aminolevulinate synthase: assignment of the housekeeping gene to 3p21 and the erythroid-specific gene to the X chromosome. Genomics. 1990;7(2):207–214.
- An LL, Li G, Wu KF, et al. High expression of EDAG and its significance in AML. Leukemia. 2005;19(8):1499–1502.
- Jiang J, Yu H, Shou Y, et al. Hemgn is a direct transcriptional target of HOXB4 and induces expansion of murine myeloid progenitor cells. Blood. 2010;116(5):711–719.
- Zheng WW, Dong XM, Yin RH, et al. EDAG positively regulates erythroid differentiation and modifies GATA1 acetylation through recruiting p300. Stem Cells. 2014;32(8):2278–2289.
- Zhao K, Zheng WW, Dong XM, et al. EDAG promotes the expansion and survival of human CD34 + cells. PLoS One. 2018;13(1):e0190794.
- Karim S, Mirza Z, Chaudhary AG, et al. Assessment of radiation induced therapeutic effect and cytotoxicity in cancer patients based on transcriptomic profiling. Int J Mol Sci. 2016;17(2):250.
- Li CY, Zhan YQ, Xu CW, et al. EDAG regulates the proliferation and differentiation of hematopoietic cells and resists cell apoptosis through the activation of nuclear factor-κB. Cell Death Differ. 2004;11(12):1299–1308.
- Fitzgibbon J, Katsanis N, Wells D, et al. Human guanylate kinase (GUK1): cDNA sequence, expression and chromosomal localisation. FEBS Lett. 1996;385(3):185–188.
- Oburoglu L, Tardito S, Fritz V, et al. Glucose and glutamine metabolism regulate human hematopoietic stem cell lineage specification. Cell Stem Cell. 2014;15(2):169–184.
- Xiang J, Wu DC, Chen Y, et al. In vitro culture of stress erythroid progenitors identifies distinct progenitor populations and analogous human progenitors. Blood. 2015;125(11):1803–1812.
- Paulson RF, Hariharan S, Little JA. Stress erythropoiesis: definitions and models for its study. Exp Hematol. 2020;89:43–54.