
ABSTRACT
Objective:
Multiple Myeloma (MM) is a hematologic malignant disease with unclear molecular mechanisms. This integrated bioinformatic study aimed to identify key genes, pathways and immune cell infiltration pattern in MM.
Methods:
Differentially expressed genes (DEGs) from GSE6477 and GSE16558 dataset were filtrated with R package ‘limma’, whose function were explored by Gene Ontology (GO) and Kyoto Encyclopedia of Genes and Genomes (KEGG) pathway enrichment analysis. The key genes were selected from Protein–protein interaction network (PPI) and logistic regression model. The correlation between key genes and survival in MM was evaluated using the survival and survminer package. Additionally, immune filtration analysis was accomplished by CIBERSORT tools.
Results:
118 DEGs (92 up-regulated and 26 down-regulated) from two GSE datasets were identified, which were closely related with B cell receptor signaling pathway and Epstein-Barr virus infection. Furthermore, CD24 and PTPRC of five hub genes identified in PPI network were further screened out by the logistic regression model. Besides, CD24 and PTPRC expression were significantly correlated to the survival time in MM patients. Finally, MM might cause different infiltrating immune cell compositions, including increased infiltrations of B cells memory, Plasma cells, T cells CD4 memory resting, T cells follicular helper, Tregs, NK cells resting, Macrophages(M0/M1), Dendritic cells resting and Mast cells activating, and lower proportions of B cells naïve, T cells CD4 naïve, Macrophages M2 and Neutrophils.
Conclusion:
Targeting CD24 and PTPRC as molecular markers of MM is valuable to MM therapy. Moreover, the immune cell infiltration will provide new insights into MM immunopathology.
1. Introduction
Multiple Myeloma (MM) is a type of hematologic tumor that affects plasma cells and presents abnormal plasma cell infiltration in the bone marrow and over-production of monoclonal protein in the serum and/or urine [Citation1]. It accounts for approximately 1% of neoplastic diseases and 13% of hematological diseases [Citation2]. The neoplastic cell proliferation is promoted by the cumulative effect of genetic and epigenetic modifications on plasma cells together with the involvement of the bone marrow microenvironment [Citation3]. The typical symptoms of MM include hypercalcemia, renal failure, anemia and bone lesions [Citation4]. Although the development of novel chemotherapeutic agents and cell therapy has improved patient outcomes to some extent, MM is still considered incurable 2 to >10 years median survival time [Citation5]. Consequently, uncovering the pathogenesis and identifying novel biomarkers of MM are crucial for early diagnosis, prevention, and targeted therapy.
In order to elucidate the etiopathogenesis of MM, many studies have been conducted via gene expression profiling based on high-throughput sequencing technology [Citation6,Citation7]. Related research data are available in public databases such as the Gene Expression Omnibus (GEO) database [Citation8], but inconsistent results and contradictory conclusions have often been observed due to the different study methods and sample selection. Therefore, a better approach combining expression profiling techniques with the integrated bioinformatics method might eliminate the inaccuracy and poor reproducibility in MM-related research. Furthermore, it is possible to identify novel diagnosing biomarkers and therapeutic targets for MM.
In this study, the differentially expressed genes (DEGs) between patients with MM and healthy controls were identified by using integrated bioinformatics analysis on data obtained from the GEO database. The messenger RNA (mRNA) gene expression profiles of MM including GSE6477 and GSE16558 have been selected and the common DEGs have been screened using the R package with the standard data processing. Then, gene ontology (GO) and KEGG pathway enrichment analysis, along with the protein–protein interactions (PPI) network establishment integrating modular analysis was performed to identify hub genes in MM. In addition, CIBERSORT was used to conduct the immune infiltrates. Our findings may highlight some initial signs for the diagnosis and treatment of MM.
2. Materials and methods
2.1. Microarray data information and DEG identification
GSE6477 and GSE16558 were selected and downloaded from the GEO database (http://www.ncbi.nlm.nih.gov/geo). The GSE6477 dataset, which included purified plasma cell samples from 125 diagnosed patients with MM and 15 healthy individuals, was performed on GPL96 platforms (HG-U133A Affymetrix Human Genome U133A Array). The GSE16558 data with 65 MM patients and 5 healthy controls of purified plasma cell samples was obtained from GPL6244 platforms (HuGene-1_0-st Affymetrix Human Gene 1.0 ST Array). The R software was utilized to screen DEGs across experimental conditions between MM patients and healthy adults. In the present study, the p-value < .05 and [log2FoldChange (log2FC)] > 1 were the criteria set for screening. The volcanic maps were used to visually show the genes identified and the top 50 remarkable varied genes with statistical significance identified in a heatmap drawn by R package.
2.2. GO and pathway enrichment analysis
Gene Ontology (GO) enrichment analysis and Kyoto Encyclopedia of Genes and Genomes (KEGG) enrichment analysis were used to annotate gene functions and signaling pathways involved. The GO enrichment represents the protein functions in the three hierarchies including Molecular Functions (MF), Biological process (BP), and Cellular Component (CC). The items with p-values < .05 were considered as significantly enriched.
2.3. PPI network establishment and modular analysis
STRING database was applied for the establishment of protein–protein interaction (PPI) network, providing an insight into the functional relationships of interacting genes or proteins. The data for all proteinprotein interactions is summarized, analyzed and calculated. The PPI network was visualized by Cytoscape software 3.7.2. Moreover, Molecular Complex Detection (MCODE), an application in Cytoscape for finding clusters (highly interconnected regions) in a PPI network, was utilized to identify the most significant module (based on the MCODE score and node number).
2.4. Gene set enrichment analysis
GSEA is a computational way to interpret the expression data of one gene set and evaluate the significant difference in various biological states. It was conducted for enrichment analysis. The GSEA was performed with the following settings: (1) default weighted enrichment method, (2) p < .05, (3) false discovery rate(FDR)q < 0.25. The enrichment results were visualized by using the plugin in Cytoscape.
2.5. Logistic regression model
The logistic regression model is a relationship between predictor variables and a categorical response variable. In the present study, all samples were classified into two sets- MM samples and the normal control samples. Subsequently, the logistic regression analysis was adopted to prioritize genes followed by multivariate logistic regression analysis to identify the target genes contained in the model by using the Generalized Linear Models (GLM) function of R language. The expression of mRNA was the continuous variable, and the sample set was the binary categorical response variable.
2.6. Survival analysis
The correlation between the selected gene expression and survival in MM patients was analyzed using the ‘survival’ and ‘survminer’ packages. Based on the GSE4581 data set (n = 414), the patients were classified into two groups according to the median of each selected gene expression for overall survival.
2.7. Immune infiltration analysis
Immune cell infiltration characteristics of MM were assessed by uploading gene expression matrices to the Cell Type Identification By Estimating Relative Subsets Of RNA Transcripts (CIBERSORT) website (https://cibersort.stanford.edu/), and the immune cell infiltration matrix was obtained. The ‘corrplot’ package was used to visualize the interaction infiltrating immune cells of 22 different immune types, and a p-value less than .05 was used as a criterion to filter qualified samples. The difference in immune infiltration extents represented by immune infiltration scores among subgroups was compared by the Wilcoxon test.
3. Results
3.1. Identification of DEGs
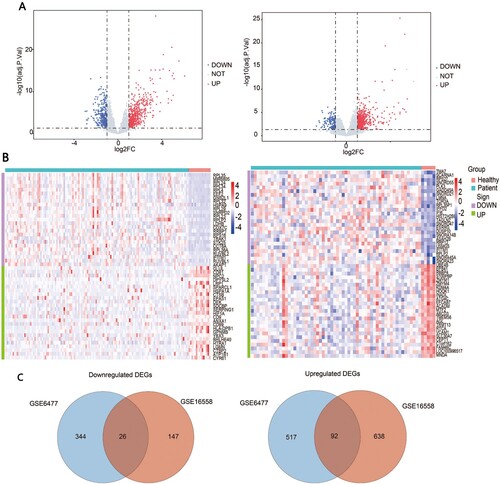
The gene expression profiles were obtained based on plasma cell samples from patients of multiple myeloma and healthy controls from the GSE6477 and GSE16558 datasets. We applied ‘limma’ R package to identify DEGs associated with MM and set p < .05 and [logFC] ≥ 1 as the cut-off value ((A)). The top 50 genes with the most significant variabilities for each dataset between MM patients and healthy controls were clustered in the heatmap separately ((B)). The following analysis on GSE6477 identified 979 DEGs in MM patients compared with the healthy donors, including 609 upregulated ones and 370 downregulated ones. Moreover, 903 DEGs were identified including 730 upregulated and 173 downregulated genes in GSE16558 datasets. Finally, we obtained 118 common DEGs from two datasets including 92 upregulated and 26 downregulated genes ((C)).
Figure 1. Identification of DEGs in GSE6477 and GSE16558. (A) Volcano plots of the distribution of DEGs in two datasets. (B) Heatmap of the top 50 DEGs in two datasets. (C) Commonly upregulated or downregulated DEGs in two datasets.
3.2. GO and KEGG enrichment analysis
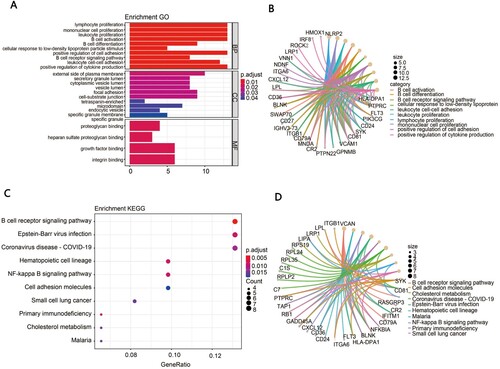
To further explore the potential biological function of the 118 DEGs summarized above, we performed GO analysis and KEGG pathway enrichment analysis. The GO terms for DEGs are shown in (A,B). DEGs in biological process (BP) were significantly associated with lymphocyte proliferation, mononuclear proliferation, leukocyte proliferation, B cell activation and B cell differentiation. For molecular function (MF) GO items, DEGs were mostly observed in the proteoglycan binding, heparan sulfate proteoglycan binding, growth factor binding and integrin binding. The cellular components (CC) analysis showed that DEGs were mainly enriched in the external side of the plasma membrane, secretory granule lumen, cytoplasmic vesicle lumen, vesicle lumen and focal adhesion. The top KEGG pathway showed that the related DEGs were significantly enriched in the B cell receptor signaling pathway, Epstein–Barr virus infection and coronavirus disease pathway ((C,D)).
Figure 2. Functional enrichment analysis. (A) The GO analysis of DEGs, including biological process (BP), molecular function (MF) and cellular component (CC). (B) The chord diagram of enriched GO terms. (C) The bubble map of the KEGG enrichment analysis of DEGs. (D) The chord diagram of enriched KEGG terms.
3.3. GSEA analysis
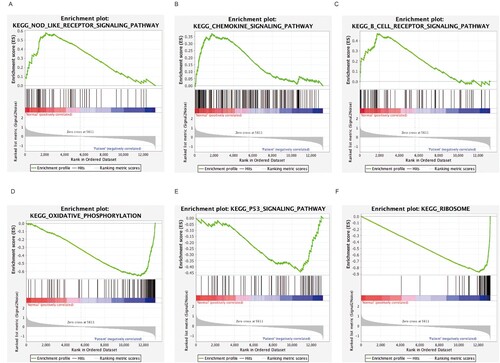
In order to identify the possible mechanism in MM, GSEA was carried out to screen out significant differential biological events between MM and control cases. The analysis indicated that the most significant-enriched gene sets included the NOD-like receptor signaling pathway, the chemokine signaling pathway, the B cell receptor signaling pathway, the oxidative phosphorylation, and the Ribosome and P53 signaling pathway ((A–F)).
Figure 3. GSEA showing the most enriched gene sets: (A) NOD-like receptor signaling pathway. (B) Chemokine signaling pathway. (C) B cell receptor signaling pathway. (D) oxidative phosphorylation. (E) Ribosome (F) P53 signaling pathway.
3.4. PPI network analysis and hub gene selection
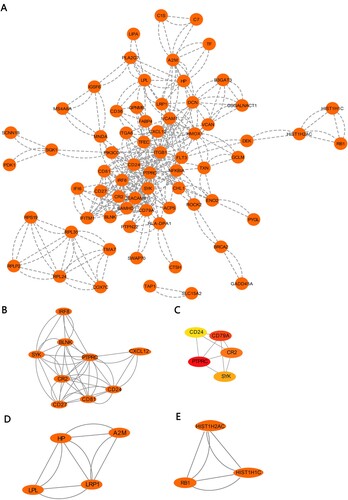
To predict the functional connections and interactions of proteins encoded by DEGs in MM, we constructed the protein–protein interaction (PPI) network of DEGs based on the STRING database and Cytoscape software. After removing the separated nodes, we described a complex PPI network of DEGs shown in (A). Subsequently, we identified three significant modules by utilizing cluster analysis of the PPI network in Cytotype MCODE ((B–D)). Additionally, key genes of the PPI network were screened by using the cytoHubba. Hub genes selected contained PTPRC, CD79A, CD24, CR2 and SYK, and their interactive network is shown in (E).
Figure 4. PPI network and modular analysis: (A) PPI network of DEGs. (B–D) Three modules generated from PPI by the MCODE. (E) Top five hub genes from the PPI network.
3.5. Logistic regression model for prediction of MM
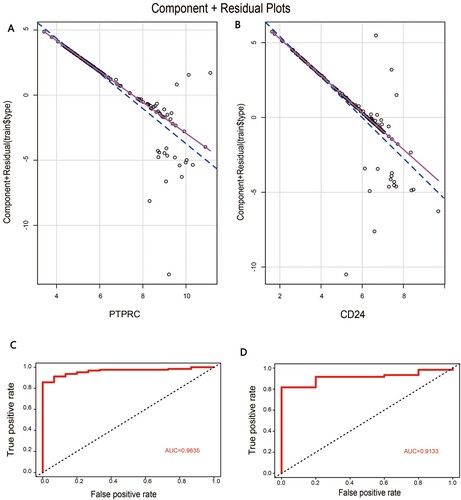
In order to confirm the diagnostic role of the above key genes in MM, logistic regression models were constructed in GSE6477 datasets based on these five mRNAs separately. In the model, mRNAs were employed as the independent variables and the model followed the normal distribution. Meanwhile, the variables including mRNA of PTPRC and CD24 in the model had a significant linear relationship with the response variables, indicating that these two independent variables were fit for use in the model ((A,B)). Furthermore, the reliability and validity of this model were evaluated by ROC analysis. The AUC value of the model in the GSE6477 dataset was 0.9635, showing the good explanatory power of the model ((C)). Similarly, the AUC value of the GSE16558 dataset was 0.9133 ((D)). Overall, the logistic regression model involving the two mRNAs provided the possibility of differentiating MM sample type from healthy controls, and PTPRC and CD24 were potential targets for further research on MM.
Figure 5. The construction of logistic regression model: (A) Component plus residual plot of PTPRC in the model. (B) Component plus residual plot of CD24 in the model. (C) The ROC curve of predicted outcomes of GSE6477 by logistic regression model. (D) The ROC curve of predicted outcomes of GSE16558 by logistic regression model.
3.6. Survival analysis
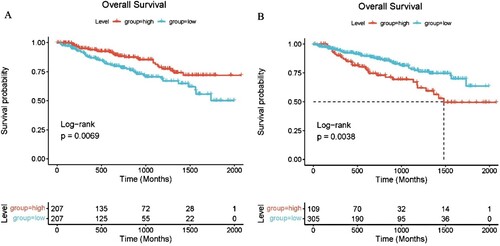
We explored the potential prognostic value of CD24 and PTPRC for patients with MM. Based on the GSE4581 data set (n = 414), the correlation between gene expression of CD24 and PTPRC and survival time was analyzed by survival and survminer package. The survival analysis showed that there was a significant correlation between the expression of CD24 (p < .01) and PTPRC (p < .01) and survival time in MM patients ((A,B)).
Figure 6. Correlation between the expression of CD24 and PTPRC and MM survival. (A) Overall survival analysis of CD24 for MM patients. (B) Overall survival analysis of PTPRC for MM patients.
3.7. Immune cell infiltration results
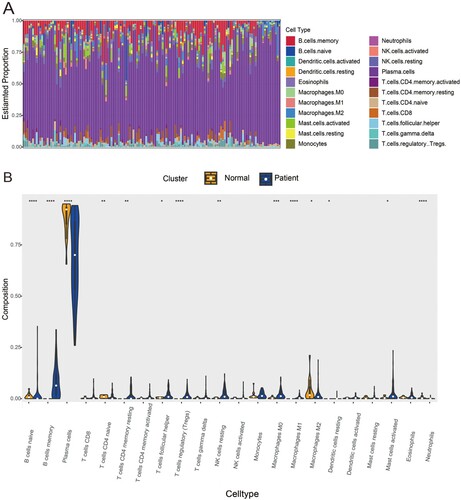
To investigate the discrepancy in immune infiltration between 22 immune cell subsets in the MM vs. NC group, the CIBERSORT algorithm was employed to analyze the ratios of the infiltrating immune cells in GSE6477 datasets. Then, Immune filtration analysis revealed that MM samples had increased infiltration of B cells memory (p < .0001), Plasma cells (p < .0001), T cells CD4 memory resting (p < .01), T cells follicular helper (p < .1), T cells regulatory (Tregs) (p < .0001), NK cells resting (p < .01), Macrophages M0 (p < .001), Macrophages M1 (p < .0001), Dendritic cells resting (p < .1) and Mast cells activated (p < .1), and lower proportions of B cells naïve (p < .0001), T cells CD4 naïve (p < .01), Macrophages M2 (p < .1) and Neutrophils (p < .0001), which exhibited different infiltrating immune cell composition and may be related to the occurrence of MM ((A,B)). As a consequence, it was suggested that the change in the distributing ratios of immune cells was associated with the occurrence and development of MM, which will provide new insights into the immunopathology of MM.
Figure 7. Immune cells filtration in MM samples and heathy controls: (A) The fractions of twenty-two immune cell types in MM samples and healthy controls. (B) Violin diagram of comparisons between 22 types of immune cells in MM samples and healthy controls. The threshold for p-value is .05 for significance. *: p < .05, **: p < .01, ***: p < .001, ****: p < .0001.
4. Discussion
MM is a common hematological malignancy owing to complex outcomes of the tumor development and progression affected by genetic factors [Citation9]. In spite of the progress achieved in the knowledge and new treatments of MM [Citation10,Citation11], the pathogenesis of MM remains unrevealed and this disease is still incurable for most patients. Thus, it is urgent and indispensable to investigate the potential mechanisms of MM at the molecule level. Recently, the rapid development of microarray technology has been extensively adopted to examine the general genetic alterations of MM and identify the possible MM disease predictors [Citation12].
In the present research, the expression of genes in purified plasma cells of MM patients and donors from two microarrays based on GSE6477 and GSE16558 datasets were analyzed. In total, 118 common DEGs were identified between patients and healthy control groups, consisting of 92 upregulated genes and 26 downregulated genes with p < .05 and [logFC] ≥ 1. Thereafter, bioinformatic analysis was used to further annotate the DEGs identified, including GO terms enrichment, KEGG signaling pathway enrichment and PPI network.
GO enrichment analysis in BPs indicated that the functional enrichment of DEGs is mainly involved in lymphocyte proliferation, mononuclear cell proliferation, leukocyte proliferation, B cell activation and differentiation. This finding validated that immune cell dysfunction played a crucial part in the pathogenesis of MM. KEGG analysis showed enrichment of B cell receptor signaling pathway, Epstein–Barr virus infection, Coronavirus disease - COVID-19, Hematopoietic cell lineage and NF-kappa B signaling pathway. Consistent with our results, B cell receptor signaling pathway such as B-cell maturation antigen (BCMA) signaling has been identified to be the most significant pathway in other studies of MM [Citation13]. In addition, the Epstein–Barr virus infection has been reported to be strongly associated with the clinical characteristics and prognosis of MM patients, and MM cells infected by Epstein–Barr virus have been found to produce drug resistance-related proteins [Citation14,Citation15]. Furthermore, we built a PPI network of DEGs and identified 5 candidate hub genes, PTPRC, CD79A, CD24, CR2 and SYK. Subsequently, the logistic regression models based on these hub genes suggested that CD24 and PTPRC had an outstanding performance in the diagnosis of MM among the five hub genes. These results implied the important roles of CD24 and PTPRC in the MM progression.
CD24 is a heavily glycosylated protein localized in membrane lipid raft domains [Citation16], which is mainly expressed by immune cells and often overexpressed in several types of tumors and appears oncogenic [Citation17–19]. In cancer, CD24 plays an important role in regulating the cell proliferation, clonal and migration [Citation20]. Recently, CD24 was identified as a signal of antiphagocytisis which enables the prevention of cancer cells being attacked by binding to Siglec-10-expressing on macrophages [Citation21,Citation22]. It was reported that blocking of CD24–Siglec-10 signaling by monoclonal antibodies strongly intensified the elimination of CD24-positive tumor cells [Citation21], suggesting that CD24 is a promising target for cancer immunotherapy. What’s more, Mensah and colleagues have investigated the connection between the expression of CD24 and the differentiation of B cells, the results have shown that CD24 expression in B cells might be associated with the energy metabolism during all stages of differentiation by the metabolic pathway involving phosphorylation of AMPK [Citation23]. In our study, CD24 expression was significantly increased in MM patients compared with healthy controls from two microarray datasets. In consistent with our results, the findings of Alaterre and colleagues have shown that CD24 was significantly overexpressed in malignant plasma [Citation24]. Combined with the previous studies, CD24 might be a valuable therapeutic target in patients with MM.
Protein tyrosine phosphatase receptor type C (PTPRC), also known as CD45, is a leucocyte common antigen and is expressed in almost all hematopoietic cells excluding mature erythrocytes [Citation25]. The deficiency or abnormal expression of PTPRC is related to various diseases including hematologic tumor [Citation26–28]. For example, Keeney et al found that adult Acute lymphoblastic leukemia (ALL) patients with elevated PTPRC had a reduced rate of survival [Citation29]. A previous study by Saint-Paul has revealed that CD45 is involved in the development of acute myeloid leukemia (AML) and targeting of CD45 positioning among lipid rafts provides a novel strategy in the treatment of AML [Citation30]. Our study results also showed that PTPRC expression was upregulated in MM patients compared with healthy donors from two microarray datasets. The survival analysis showed that high expression of PTPRC was related to worse overall survival in MM patients. Additionally, the research of Kumar et al has demonstrated that the expression levels of PTPRC on the myeloma cells have important clinical and biological effects [Citation31,Citation32]. Another study showing the RNA seq data on purified MM cells from 767 diagnostic patient samples in the online database MM Research Foundation supports that the patients with the reduced PTPRC expression have longer overall and progression-free survival [Citation33].
Taken together, CD24 and PTPRC may participate in the pathogenesis of MM and be considered as possible diagnosis and prognostic markers for MM. Moreover, the study focusing on these two candidate genes might provide a new therapeutic strategy for MM.
Along with in-depth research on MM, the bone marrow microenvironment is believed to play a crucial role in the disease progression, which provides the basis for immunotherapy of MM. Immune cells are important components of this microenvironment by interacting with bone marrow stroma and the myeloma cells. In order to understand the role of immune cell infiltration in MM, CIBERSORT was utilized to conduct an analysis on the MM immune infiltration in statistics. The immune cell composition was significantly different between the samples of MM patients and healthy donors. The overall proportion of NK cell, M0 macrophages and M1 macrophages were strikingly increased in MM patients, compared to that in healthy controls. Alfarra et al have described the key function of enhancing NK cell activity in MM and have anticipated the possibility of blocking NK cell inhibitory receptors as a potential therapeutic strategy for MM treatment [Citation34]. Moreover, it has been found that the higher level of myeloma-associated macrophages correlates with poor prognosis in MM [Citation35]. Interestingly, Zheng et al have indicated that myeloma-associated macrophages prevent myeloma cells from apoptosis [Citation36], which could provide evidence to support our previous prediction that myeloma cells may escape immune surveillance from macrophage through CD24–Siglec-10 signal (‘do not eat me’ signal). Out immune filtration analysis results showed that changes in the proportion of T cells had a critical effect on MM pathology, in which four types of T cells revealed to obviously change in MM patient groups. As reported by the previous study, myeloma cells might express tumor antigens and further initiate the T cell responses. However, T cells promptly collected from patients with MM unsuccessfully recognize autologous tumor cells to secrete IFN-a, indicating the failure of playing the antimyeloma role in vivo [Citation37]. Additionally, a previous study also demonstrated that CD25 + T cells from MM patients were unable to inhibit the proliferation of PBMC under the condition of anti-CD3 stimulation and deduced the dysfunction of MM Tregs [Citation38]. All the study results including the previous literature and analytical data, when taken together, have manifested that immune cell infiltration is of great significance and value in MM and should be focused on in further research in future.
In summary, critical genes for MM were identified and the role of immune cell infiltration in MM was explored in our study. However, there were many limitations in our study: (1) The key genes were predicted by PPI and logistic regression models, lacking experimental validation, and the exact mechanisms of key genes in MM required to be further investigated. (2) The accuracy of CIBERSORT analysis on the basis of insufficient genetic data is probably impacted by the heterotypic interactions of cells, phenotypic plasticity or disease-induced disorders. However, this study provides new insights into the molecular mechanism and immunopathology of MM.
4.1. Conclusions
In this study, based on bioinformatical analyses, we identified key genes and significant pathways from DEGs in MM compared with healthy controls. GO and KEGG enrichment analyses and GSEA were performed to help understand relevant gene functions and mechanisms. CD24 and PTPRC were identified as key genes in MM according to the PPI and logistic regression model. Immune filtration analysis was simultaneously applied utilizing CIBERSORT and differences in immune cell composition were found including B cells, T cells, macrophages, NK cells resting, Dendritic cells resting and Neutrophils. More related studies are awaiting to improve the understanding of their exact roles in MM pathology and to explore new treatment targets.
Acknowledgements
We thank HPS Gene Technology Co., Ltd. for their excellent support in the article. All authors contributed to the study’s conception and design. F.X., L.L. and LM.J. contributed to the data collection, analysis and visualization. F.X. and J.Z. performed the original drafting, writing-reviewing and editing. All authors read and approved the final manuscript.
Disclosure statement
No potential conflict of interest was reported by the author(s).
Additional information
Funding
References
- Rollig C, Knop S, Bornhauser M. Multiple myeloma. Lancet. 2015;385(9983):2197–2208. doi:10.1016/S0140-6736(14)60493-1
- Siegel RL, Miller KD, Jemal A. Cancer statistics, 2018. CA Cancer J Clin. 2018;68(1):7–30. doi:10.3322/caac.21442
- Bianchi G, Munshi NC. Pathogenesis beyond the cancer clone(s) in multiple myeloma. Blood. 2015;125(20):3049–3058. doi:10.1182/blood-2014-11-568881
- Landgren O, Rajkumar SV. New developments in diagnosis, prognosis, and assessment of response in multiple myeloma. Clin Cancer Res. 2016;22(22):5428–5433. doi:10.1158/1078-0432.CCR-16-0866
- Sonneveld P, Avet-Loiseau H, Lonial S, et al. Treatment of multiple myeloma with high-risk cytogenetics: a consensus of the International Myeloma Working Group. Blood. 2016;127(24):2955–2962. doi:10.1182/blood-2016-01-631200
- Yang J, Wang F, Chen B. HLA-DPA1 gene is a potential predictor with prognostic values in multiple myeloma. BMC Cancer. 2020;20(1):915. doi:10.1186/s12885-020-07393-0
- Peng Y, Wu D, Li F, et al. Identification of key biomarkers associated with cell adhesion in multiple myeloma by integrated bioinformatics analysis. Cancer Cell Int. 2020;20:262. doi:10.1186/s12935-020-01355-z
- Chaussabel D, Rinchai D. Using ‘collective omics data’ for biomedical research training. Immunology. 2018;155(1):18–23. doi:10.1111/imm.12944
- Furukawa Y, Kikuchi J. Molecular pathogenesis of multiple myeloma. Int J Clin Oncol. 2015;20(3):413–422. doi:10.1007/s10147-015-0837-0
- Shah UA, Mailankody S. Emerging immunotherapies in multiple myeloma. Br Med J. 2020;370:m3176. doi:10.1136/bmj.m3176
- Mikkilineni L, Kochenderfer JN. CAR T cell therapies for patients with multiple myeloma. Nat Rev Clin Oncol. 2021;18(2):71–84. doi:10.1038/s41571-020-0427-6
- Gao H, Wang H, Yang W. Identification of key genes and construction of microRNA-mRNA regulatory networks in multiple myeloma by integrated multiple GEO datasets using bioinformatics analysis. Int J Hematol. 2017;106(1):99–107. doi:10.1007/s12185-017-2216-2
- Shah N, Chari A, Scott E, et al. B-cell maturation antigen (BCMA) in multiple myeloma: rationale for targeting and current therapeutic approaches. Leukemia. 2020;34(4):985–1005. doi:10.1038/s41375-020-0734-z
- Xia B, Wang X, Yang R, et al. Epstein-Barr virus infection is associated with clinical characteristics and poor prognosis of multiple myeloma. Biosci Rep. 2019;39(10):1–9. doi:10.1042/BSR20190284
- Park GB, Chung YH, Jeong JY, et al. A p110delta-specific inhibitor combined with bortezomib blocks drug resistance properties of EBV-related B cell origin cancer cells via regulation of NF-kappaB. Int J Oncol. 2017;50(5):1711–1720. doi:10.3892/ijo.2017.3923
- Tarhriz V, Bandehpour M, Dastmalchi S, et al. Overview of CD24 as a new molecular marker in ovarian cancer. J Cell Physiol. 2019;234(3):2134–2142. doi:10.1002/jcp.27581
- Altevogt P, Sammar M, Huser L, et al. Novel insights into the function of CD24: a driving force in cancer. Int J Cancer. 2021;148(3):546–559. doi:10.1002/ijc.33249
- Ni YH, Zhao X, Wang W. CD24, a review of its role in tumor diagnosis, progression and therapy. Curr Gene Ther. 2020;20(2):109–126. doi:10.2174/1566523220666200623170738
- Tanaka T, Terai Y, Kogata Y, et al. CD24 expression as a marker for predicting clinical outcome and invasive activity in uterine cervical cancer. Oncol Rep. 2015;34(5):2282–2288. doi:10.3892/or.2015.4257
- Eyvazi S, Kazemi B, Dastmalchi S, et al. Involvement of CD24 in multiple cancer related pathways makes it an interesting new target for cancer therapy. Curr Cancer Drug Targets. 2018;18(4):328–336. doi:10.2174/1570163814666170818125036
- Barkal AA, Brewer RE, Markovic M, et al. CD24 signalling through macrophage Siglec-10 is a target for cancer immunotherapy. Nature. 2019;572(7769):392–396. doi:10.1038/s41586-019-1456-0
- Bradley CA. CD24 – a novel ‘don’t eat me’ signal. Nat Rev Drug Discov. 2019;18(10):747. doi:10.1038/d41573-019-00146-0
- Mensah FFK, Armstrong CW, Reddy V, et al. CD24 expression and B cell maturation shows a novel link with energy metabolism: potential implications for patients with myalgic encephalomyelitis/chronic fatigue syndrome. Front Immunol. 2018;9:2421. doi:10.3389/fimmu.2018.02421
- Gilad N, Zukerman H, Pick M, et al. The role of CD24 in multiple myeloma tumorigenicity and effects of the microenvironment on its expression. Oncotarget. 2019;10(52):5480–5491. doi:10.18632/oncotarget.27190
- Rheinlander A, Schraven B, Bommhardt U. CD45 in human physiology and clinical medicine. Immunol Lett. 2018;196:22–32. doi:10.1016/j.imlet.2018.01.009
- Bottero V, Santiago JA, Potashkin JA. PTPRC expression in blood is downregulated in Parkinson’s and progressive supranuclear palsy disorders. J Parkinsons Dis. 2018;8(4):529–537. doi:10.3233/JPD-181391
- Zhang Y, Wang F, Ning N, et al. Patterns of circulating tumor cells identified by CEP8, CK and CD45 in pancreatic cancer. Int J Cancer. 2015;136(5):1228–1233. doi:10.1002/ijc.29070
- Perron M, Saragovi HU. Inhibition of CD45 phosphatase activity induces cell cycle arrest and apoptosis of CD45(+) lymphoid tumors ex vivo and in vivo. Mol Pharmacol. 2018;93(6):575–580. doi:10.1124/mol.117.110908
- Al Barashdi MA, Ali A, McMullin MF, et al. Protein tyrosine phosphatase receptor type C (PTPRC or CD45). J Clin Pathol. 2021;74(9):548–552. doi:10.1136/jclinpath-2020-206927
- Saint-Paul L, Nguyen CH, Buffiere A, et al. CD45 phosphatase is crucial for human and murine acute myeloid leukemia maintenance through its localization in lipid rafts. Oncotarget. 2016;7(40):64785–64797. doi:10.18632/oncotarget.11622
- Gonsalves WI, Timm MM, Rajkumar SV, et al. The prognostic significance of CD45 expression by clonal bone marrow plasma cells in patients with newly diagnosed multiple myeloma. Leuk Res. 2016;44:32–39. doi:10.1016/j.leukres.2016.03.003
- Kumar S, Rajkumar SV, Kimlinger T, et al. CD45 expression by bone marrow plasma cells in multiple myeloma: clinical and biological correlations. Leukemia. 2005;19(8):1466–1470. doi:10.1038/sj.leu.2403823
- Abdollahi P, Kohn M, Borset M. Protein tyrosine phosphatases in multiple myeloma. Cancer Lett. 2021;501:105–113. doi:10.1016/j.canlet.2020.11.042
- Alfarra H, Weir J, Grieve S, et al. Targeting NK cell inhibitory receptors for precision multiple myeloma immunotherapy. Front Immunol. 2020;11:575609. doi:10.3389/fimmu.2020.575609
- Komohara Y, Jinushi M, Takeya M. Clinical significance of macrophage heterogeneity in human malignant tumors. Cancer Sci. 2014;105(1):1–8. doi:10.1111/cas.12314
- Zheng Y, Cai Z, Wang S, et al. Macrophages are an abundant component of myeloma microenvironment and protect myeloma cells from chemotherapy drug-induced apoptosis. Blood. 2009;114(17):3625–3628. doi:10.1182/blood-2009-05-220285
- Dhodapkar MV, Krasovsky J, Olson K. T cells from the tumor microenvironment of patients with progressive myeloma can generate strong, tumor-specific cytolytic responses to autologous, tumor-loaded dendritic cells. Proc Natl Acad Sci USA. 2002;99(20):13009–13013. doi:10.1073/pnas.202491499
- Guillerey C, Nakamura K, Vuckovic S, et al. Immune responses in multiple myeloma: role of the natural immune surveillance and potential of immunotherapies. Cell Mol Life Sci. 2016;73(8):1569–1589. doi:10.1007/s00018-016-2135-z