
 ?Mathematical formulae have been encoded as MathML and are displayed in this HTML version using MathJax in order to improve their display. Uncheck the box to turn MathJax off. This feature requires Javascript. Click on a formula to zoom.
ABSTRACT
This study delves into the emerging role of ferroptosis in Myelodysplastic Neoplasms (MDS) and aims to identify a prognostic ferroptosis-related gene signature for MDS. Utilizing RNA-seq data and clinical information from the Gene Expression Omnibus database, the researchers extracted ferroptosis-related genes from the FerrDb website and conducted differential expression analysis using the 'limma' package in R. Hub ferroptosis-related genes in MDS were screened using the “RandomForest” and “carat” R packages. Kaplan -Meier and Cox regression analyses were employed to assess the prognostic role of three identified hub genes (BNIP3, MDM2, and RRM2). Receiver operator characteristic curve analysis confirmed the diagnostic efficacy of these genes. The study delved further into immune infiltration correlations, ncRNA-transcription factor coregulatory network analysis, and the identification of potential therapeutic drugs targeting hub ferroptosis-related genes in MDS. The researchers constructed a 3-gene signature-based risk score using datasets GSE58831 and GSE19429, demonstrating high accuracy (AUC > 0.75) in both datasets for survival prediction in MDS. A nomogram analysis reinforced the prognostic value of the risk-scoring model. Immunological analysis revealed an association between the risk score and immune infiltration. Quantitative reverse transcription polymerase chain reaction (qPCR) data indicated significant expression differences in MDM2, RRM2, and BNIP3 between MDS and healthy bone marrow samples. Notably, MDM2 and RRM2 showed decreased expression, while BNIP3 exhibited increased expression in MDS samples. This comprehensive study concludes that BNIP3, MDM2, and RRM2 hold diagnostic and prognostic significance in MDS and provide valuable insights into immune cell landscapes and potential therapeutic avenues for this condition.
Introduction
The myelodysplastic neoplasms (MDS) are a heterogeneous group of disorders originating from hematopoietic stem cells that are characterized by ineffective hematopoiesis, refractory hemocytopenia, cellular immune disorder, and a high propensity for acute myeloid leukemia (AML) [Citation1,Citation2]. In general, MDS affects older adults with a median age of approximately 70, and the incidence may be much higher due to suboptimal case ascertainment and underreporting in cancer registries [Citation3]. A growing number of studies have demonstrated that the heterogeneity, pathophysiological process, and disease progression of MDS are crucially associated with molecular genetic abnormalities that can serve as prognostic biomarkers and an effective therapeutic target [Citation4–6]. Despite relevant progress in demethylation therapy, patients with MDS have a poor overall 5-year survival at approximately 31% without significant temporal improvement [Citation7]. Therefore, novel prognostic biomarkers are urgently needed to enable better diagnosis and treatment, which will eventually improve the outcomes of patients with MDS.
Ferroptosis is a newly identified form of iron-dependent accumulation of lipid hydroperoxides, which leads to programed cell death that is distinct from apoptosis, necrosis, and autophagy [Citation8]. Ferroptosis was originally proposed as a process where excessive lipid peroxidation of cell membrane phospholipids (PLs) and reduction in glutathione peroxidase 4 (GPX4) results in cell damage and even death [Citation9]. Increasingly studies have demonstrated that targeting ferroptosis is a novel, potential strategy for anti-tumor therapy, particularly for therapy-resistant cancer cells [Citation10,Citation11]. Recent studies have revealed that ferroptosis-related genes play a crucial role in hematological malignancies, including AML, lymphoma, and MDS [Citation12–14]. In addition, some studies have suggested that ferroptosis may regulate the immune system, particularly T cell immunity, to prevent tumorigenesis [Citation15,Citation16]. Immune dysfunction in the microenvironment may facilitate MDS progression, specifically for T cells, B cells, and natural killer (NK) cells [Citation17]. For instance, reduced regulatory T cells (Tregs) were found in low-risk MDS [Citation18], whereas CD4+ Treg expansion was found in high-risk MDS [Citation19]. Previous studies have demonstrated that targeting glutathione peroxidase Gpx4 could induce Treg cell ferroptosis to improve cancer treatment [Citation20]. However, the degree to which ferroptosis influences the survival and treatment strategy in MDS remains unknown.
Systemic iron overload as a result of ineffective hematopoiesis and repeated blood transfusion is common in patients with hematologic malignant tumors [Citation21,Citation22], and multiple regulators of iron metabolism are closely related to ferroptosis. Considering the significant value of ferroptosis in MDS, we identified differentially expressed genes (DEGs) that are affected by the ferroptosis status and then constructed a prognostic risk-scoring model and effective nomogram. Furthermore, we explored the relationship between the risk model and immune infiltration and screened for potential drugs that target Murine double minute 2 (MDM2) and ribonucleotide reductase regulatory subunit M2 (RRM2). We also evaluated the expression of ferroptosis-related DEGs in primary MDS samples.
Materials and methods
Data collection
Gene expression profiling data from CD34+ hematopoietic stem and progenitor cells in bone marrow (BM) were from the GSE58831, GSE19429, and GSE114922 datasets, which were obtained from the Gene Expression Omnibus (GEO) database (https://www.ncbi.nlm.nih.gov/geo/). The GSE58831 dataset (as a training set) contained 176 samples from 159 patients with MDS and 17 healthy controls, and the GSE19429 dataset (as another training set) included 183 samples from MDS patients and 17 samples from healthy controls. The GSE114922 dataset was selected as a validation set and contained 82 cases with MDS and 8 healthy controls. The ‘limma’ R package was used to normalize the gene expression profiles.
Differential analysis and functional enrichment analysis of ferroptosis-related genes between MDS patients and healthy controls
Differentially expressed genes (DEGs) between MDS patients and healthy controls were analyzed via the ‘limma’ R package (v3.50.1) with the following cutoff for adjustment: P value < 0.05 and |logFC| > log2(1.5). Collection and collation of ferroptosis-related genes from ferroptosis-associated gene ontology (GO) terms, ferroptosis-associated Kyoto Encyclopedia of Genes and Genomes (KEGG) pathways, and the ‘FerrDb’ database (http://www.zhounan.org/ferrdb/current/) were performed. The intersection of DEGs and ferroptosis-related genes was visualized by Venn plot. The enrichGO and enrichKEGG functions from the R package ClusterProfiler (v4.2.2) were used in the enrichment analysis.
ncRNA-transcription factor coregulatory network analysis of ferroptosis-related genes
miRNA-lncRNA interactions and miRNA-mRNA interactions bind to hub genes that were screened from the Encyclopedia of RNA Interactomes (ENCORI) (https://starbase.cysu.edu.cn/targetSite.php). The interaction of mRNA and lncRNA was analyzed by the RAID database. TF-mRNA regulatory interactions were downloaded from the TRRUST V2 database.
Ferroptosis-related gene screening and diagnostic efficacy test
In the DEG set, the R packages ‘RandomForest’ and ‘carat’ were used to screen the ferroptosis-related genes in MDS. Receiver operator characteristic (ROC) curve analysis was used to evaluate the diagnostic efficacy of selected ferroptosis-related genes.
Construction and validation of a prognostic risk-scoring model based on ferroptosis-related clusters
Related overall survival (OS) time prognostic information was also downloaded from the GEO database where only the GSE58831 dataset provided survival time information. Kaplan–Meier and multivariate Cox regression analysis were used to assess the prognostic role of three hub genes (RRM2, MDM2, and BNIP3) for a specific prognosis type in MDS. The cut-off was chosen by the ‘surv-cutpoint’ function of the ‘survminer’ R package (0.4.9). Finally, the log-rank P-value of the K-M method and hazard ratio (HR) with a 95% confidence interval (95% CI) were computed, and the outcomes were summarized. The risk score, based on the gene expression scores and corresponding regression coefficients, was calculated according to the following formula:
where
represents the normalized expression level of target gene i and Coefi refers to the corresponding regression coefficient.
Immune infiltrate correlation between the low- and high-risk-score subgroup
Immune infiltration analysis by the CIBERSORT algorithm was used to evaluate different types of immune cell expression between high- and low-risk score groups of MDS patients. The correlations map of hub genes and immune cell expression were generated by the ‘corr.test’ function in the R package ‘ggplot2’. The difference in immune cells between the high- and low-risk groups was analyzed by the R packages ‘ggplot2’ and ‘ggpubr’. The linear correlation of risk score and immune cell components (CD4 naïve T cells, B cells, CD4 naïve Tregs, myeloid dendritic cell activated) was analyzed by the ‘ggscatterhist’ function in the R package ‘ggpubr’.
Establishment of a predictive nomogram
A nomogram was constructed to visualize the relationship between variables and the prognostic model by the ‘rms’ R package. One-year, 3-year, and 5-year calibration curves were applied to discriminate and predict the values of the nomogram. To better illustrate the role of our risk score in MDS development, we analyzed the relationship between our risk score and different clinical characteristics.
Screening of potential therapeutic compounds for MDS.
According to Lipinski’s criteria, structural data of the corresponding compounds downloaded from the DrugBank database (https://go.drugbank.com/) were screened. Spatial structure information and the accompanying PDB files (3OLG and 4OGN) of signature genes (BNIP3 and RRM2) of prognostic significance, were obtained from the PDB database (https://www1.rcsb.org/). For docking with small molecules, AutoDock Vina was utilized, and Pymol and Ligplus were employed for interaction analysis.
Details as follows, First, we download the 3D structure information (sdf file) of the corresponding small molecule compounds from the DrugBank database (https://go.drugbank.com/drugs) and filter them according to Lipinski's rule (hydrogen bond acceptors < = 10, hydrogen bond donors < = 5, rotatable bonds < = 10, logP < = 5, molecular weight between 180-480, polar surface area < = 140). Then, we use the openbabel software to convert the sdf structure files into pdb/pdbqt files in batch. Next, we download the relevant structure information of MDM2 and RRM2 from the PDB database (https://www1.rcsb.org/), with PDB files 4OGN and 3OLJ, determine the approximate docking box range, add hydrogen atoms to the protein PDB files using MGLtools software, and then convert them to pdbqt files, and set the other relevant parameters of Autodock-Vina. Ddocking is performed in batch using Autodock-Vina, and PyMOL is used to generate docking conformations and Ligplus for interaction force analysis.
MDS and healthy sample collection and quantitative reverse transcription polymerase chain reaction analysis
BM samples were obtained from patients with MDS and healthy controls in Guangdong Provincial People’s Hospital, and their medical information was collected with informed patient consent under the Declaration of Helsinki. This study was approved by the Ethics Committee of the Guangdong Provincial People’s Hospital. The diagnosis of MDS was established according to the 2016 revision to the World Health Organization classification of myeloid neoplasms and acute leukemia. We isolated total RNA from cells using the E.Z.N.A Total RNA Kit I (Omega, GA, United States). The PrimeScript™ RT–PCR kit (TaKaRa, Otsu, Japan) was used for reverse transcription (RT) to generate cDNA. Quantitative real-time PCR (qRT-PCR) measurements were performed as previously described [Citation23]. The ABL gene served as an internal control, and the sequences of the primers are as follows.: BNIP3 forward (5′- TTCCCCCCAAGGAGTTCCT-3′), reverse (5′-CGCTCGTGTTCCTCATGCT-3′); MDM2 forward (5′-GCTGACTATTG GAAATGCACTTCA -3′), reverse (5′-CGAAGGGCCCAACATCTG -3′); RRM2 forward (5′- TGAGCCGCTGCTGAGAGAA -3′), reverse (5′- CTGCCAGATATCAT GGTACTCGAT -3′).
Statistical analysis
R software (v 4.1.2) was used to analyze all statistics, and a p-value lower than 0.05 was considered statistically significant. The level of ferroptosis-related DEGs was presented as the mean ± SEM. Differences in BNIP3, MDM2, and RRM2 expression between MDS patients and healthy controls were analyzed using Student’s t-test.
Results
Identification of ferroptosis-related DEGs between patients with MDS and healthy controls
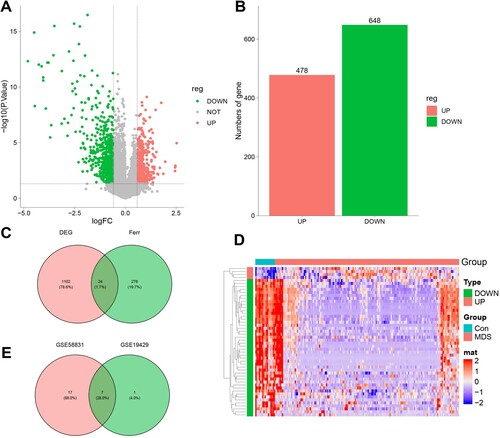
The study flow chart is shown in . DEGs in CD34+ cell samples from MDS patients and healthy controls were analyzed via the ‘limma package’ in R. In the GSE58831 dataset, we identified a total of 1,102 DEGs in MDS patients and healthy controls including 478 up-regulated (green dot, A, B) and 648 down-regulated (red dot, A, B). Among these genes were included 24 genes related to ferroptosis (C). The expression of the top 50 genes is shown in the heatmap in D. In the GSE19429 dataset, 467 DEGs were identified between MDS patients and healthy controls, including 185 up-regulated genes (green dot, Supplementary Figure S1A, B) and 290 down-regulated genes (red dot, Supplementary Figure S1A, B). By analyzing the DEGs for ferroptosis-related genes, we found that there was a total of 8 DEGs related to ferroptosis (Supplementary Figure S1C). The expression of these 50 DEGs is shown in the heatmap in (Supplementary Figure S1D). In a combined analysis, 7 ferroptosis-related DEGs (DDIT4, TNFAIP3, BNIP3, MDM2, RRM2, ACSL1, and ARRDC3) were obtained (E). The detailed information is presented in Supplementary Table S1.
Figure 1. Flow chart of the data collection and analysis.
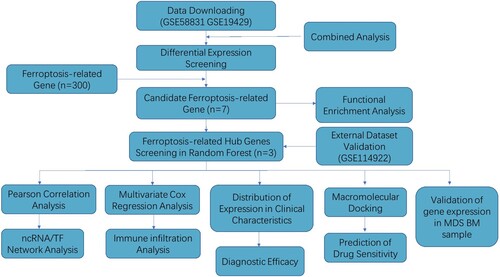
Figure 2. Identification of Ferroptosis-Related DEGs between MDS and healthy control. A. Volcano plot of genes differentially expressed between MDS patients and health in the dataset GSE58831. Green nodes represent down-regulation in MDS; red nodes represent up-regulation; and gray nodes represent no significant difference from healthy. B. Statistics on the results of volcano plots. C. Venn diagram to identify ferroptosis-related DEGs between MDS patients and healthy; D. The expression trend of 50 overlapping genes in MDS patients. E. Venn diagram to identify ferroptosis-related DEGs between the GSE58831 dataset and the GSE19429 dataset.
Enrichment analysis of ferroptosis-related DEGs
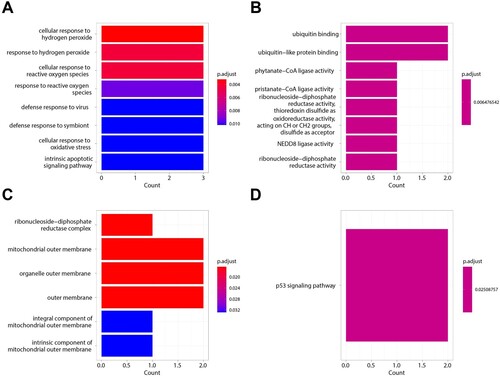
We performed GO enrichment and KEGG pathway analysis for the 7 selected ferroptosis-related DEGs in GO-BP analysis, and the major pathways were cellular response to hydrogen peroxide, reactive oxygen species, and defense response to the virus (A). In GO-MF analysis, the major pathways included ubiquitin binding, ubiquitin-like protein binding, and phytate-CoA ligase activity (B). In GO-CC analysis, the main pathways were ribonucleoside-diphosphate reductase complex, mitochondrial outer membrane, and organelle outer membrane (C). In KEGG pathway analysis, the p53 signaling pathway was enriched (D). These enrichment analysis results revealed that oxidative stress and immunoreaction may play a crucial role in MDS. Detailed information is presented in Supplementary Table S2, and S3.
Figure 3. Enrichment analysis of 7 Ferroptosis-Related DEGs. A. 7 Ferroptosis-Related DEGs GO biological processes pathway. B. Ferroptosis-Related DEGs GO molecular function pathway. C. Ferroptosis-Related DEGs cellular component pathway. D. Ferroptosis-Related DEGs KEGG pathway.
Ferroptosis-related gene screening and diagnostic test efficacy
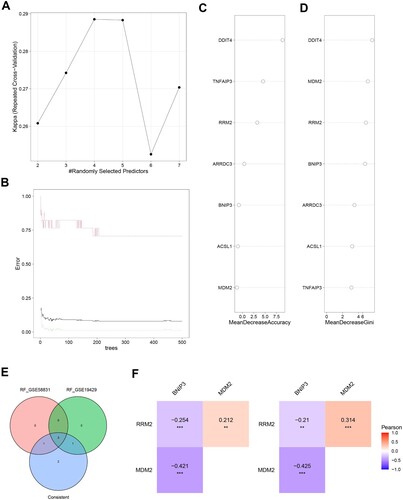
A ‘random forest’ tree was trained to evaluate the important roles of ferroptosis-related genes. In the GSE58831 dataset, we found that the constructed random forest model was best when the parameters ntree = 200 and mtry = 4 (A, B). The top 4 genes, including DDIT4, MDM2, RRM2, and BNIP3, are shown in C, D according to MeanDecreaseAccuracy and MeanDecreaseGini. In the GSE19429 dataset, the RF model constructed with ntree = 150 and mtry = 2 was found to be the best model (Supplementary Figure S2A, B). Supplementary Figure S2C, D shows the top 4 genes including MDM2, BNIP3, RRM2, and ARRDC3 in MeanDecreaseAccuracy and MeanDecreaseGini. Finally, based on the two datasets, we identified MDM2, RRM2, and BNIP3 as characteristic genes (E) and evaluated the correlation between them by Pearson correlation coefficient. F shows that RRM2 is positively correlated with MDM2, while BNIP3 is negatively correlated with MDM2 and RRM2.
Figure 4. Ferroptosis-related Genes screening. A. The relationship between the accuracy of the random forest model and mtry in the GSE58831 dataset. B. The relationship between the error rate of the random forest model and tree in the GSE58831 dataset. C. The MeanDecreaseAccuracy of Ferroptosis-related Genes in the GSE58831 dataset. D. The MeanDecreaseGini of Ferroptosis-related Genes in the GSE58831 dataset. E. Venn diagram to identify ferroptosis-related DEGs between the GSE58831 dataset and the GSE19429 dataset. F. The correlation between MDM2, RRM2, and BNIP3 by Pearson correlation coefficient in the GSE58831 dataset.
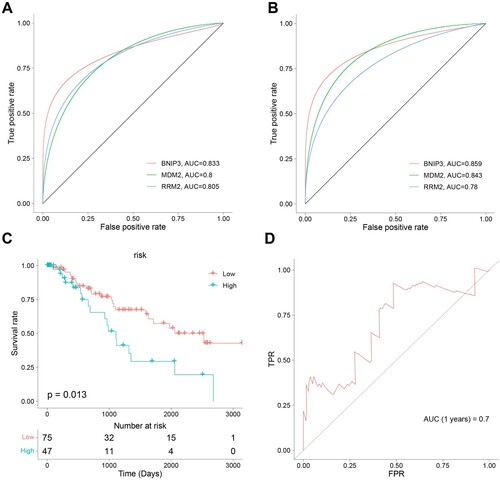
We performed an ROC analysis of the ferroptosis-related hub genes to explore the diagnostic efficacy. The ROC curve demonstrated a favorable accuracy in diagnosis, in which the area under the curves (AUCs) for BNIP3, MDM2, and RRM2 were 0.833,0.8, and 0.805, respectively in the GSE58831 dataset (A), and that in the GSE19429 dataset were 0.859, 0.843, and 0.78, respectively(B).
ncRNA/TF network analysis
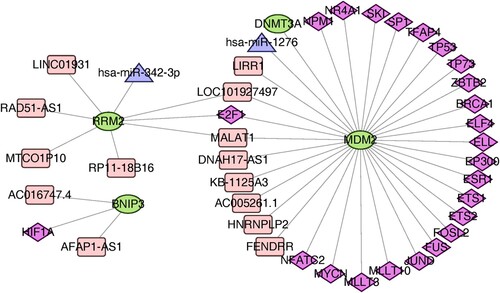
Human ncRNA-TF regulatory relationships were downloaded from the ENCORI website and the TRRUST V2 database to screen for transcription factors interacting with the 3 hub genes, including BNIP3, MDM2, and RRM2 (). A total of 23 TFs, 8 lncRNA, and 1 miRNA regulating MDM2, 4 lncRNA and 1 miRNA regulating RRM2, and 2 lncRNA and 1 TF regulating BNIP3 were predicted based on the ENCORI platform.
Figure 5. Construction of gene-TF- miRNA-lncRNA network of the key genes.
Correlation between the hub genes and clinical characteristics
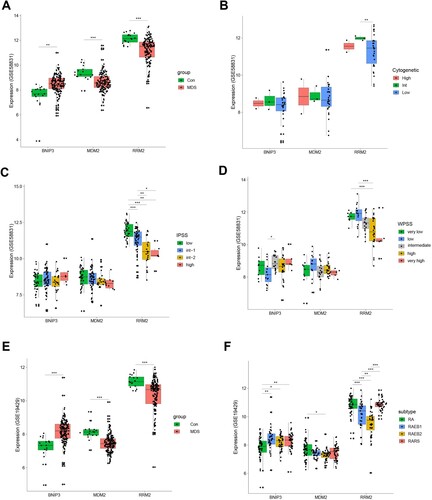
To evaluate the correlation between the hub genes and clinical characteristics, we analyzed expression differences in BNIP3, MDM2, and RRM2 according to clinical characteristics and risk. The expression of BNIP3 in patients with MDS was higher than in the controls, whereas MDM2 and RRM2 were both lower than the healthy controls in the GSE58831 (A) and GSE19429 (E) datasets. Interestingly, the RRM2 and MDM2 expression level was relative to cytogenetics (B, Supplementary Figure S3A) and subtype (F). As the risk score increased, gene expression gradually decreased (C, D). Moreover, the expression of MDM2 and RRM2 was lower than in the controls, whereas the expression of BNIP3 was higher than in the controls in the external dataset (GSE114922) (Supplementary Figure S3B). The clinical information involved in the GSE58831 and GSE14922 datasets is provided in the supplemental material (Table S6-S7). Furthermore, we have explored the relationship between BM blast and the ferroptosis risk model. There is a significant correlation between BM blast and ferroptosis risk (Supplemental Figure S4).
Figure 6. Classification of MDS Based on the Ferroptosis-Related Gene Sets. A. The expression of Ferroptosis-Related Gene in MDS patients and healthy in the GSE58831 dataset. B. The expression of BINP3, MDM2, and RRM2 in MDS patients with different cytogenetics in the GSE58831 dataset. C. The expression of three hub genes in MDS patients with different IPSS risk scores in the GSE58831 dataset. D. The expression of hub genes in MDS patients with different WPSS risk scores in the GSE58831 dataset. E. The expression of Ferroptosis-Related Gene in MDS patients and healthy in the GSE19429 dataset. F. The expression of hub genes in MDS patients with different WHO subtypes in the GSE19429 dataset.
Classification of MDS based on the ferroptosis-related gene sets
Three hub genes were used to establish a multi-factor Cox risk prognosis model, and then the Cox coefficient of each gene was multiplied by the gene expression value and summed up as a risk score. The survcutpoint function was used to automatically group high and low-risk, and the difference between the high and low-risk groups was significant. According to the expression levels and regression coefficients, we calculated a risk score as follows:risk score = expr(MDM2) ×(−0.1803133)+ expr(RRM2) ×(−0.3242572)+ expr(BNIP3) ×(−0.1265845).
Based on the risk score, MDS patients in the TCGA cohort can be grouped equally into low- and high-risk groups (C). Patients in the low-risk group had less cell death and a greater survival time compared with those in the high-risk group (C, D).
Figure 7. Ferroptosis-related Genes screening and diagnostic efficacy test and Evaluation of predictive efficacy of prognostic models. A. ROC curve showing the diagnostic efficacy of BNIP3, MDM2, and RRM2 in the GSE58831 dataset. B. ROC curve showing the diagnostic efficacy of BNIP3, MDM2, and RRM2 in the GSE19429 dataset. The horizontal axis represented the specificity of the false positive rate, and the vertical axis represented the sensitivity of the true positive rate. C. KM survival curves of two risk score groups in the GSE58831 dataset. D. ROC curves in the GSE58831 dataset and the 1-year overall survival rates were 0.7.
Correlation between the hub gene signature of BNIP3, MDM2, and RRM2 and the immune microenvironment
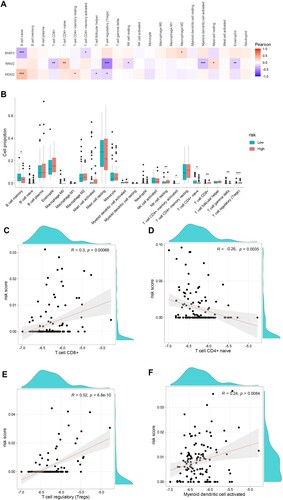
Immune microenvironment disorder participates in the pathogenesis of MDS. To further explore interactions between the hub gene signature of BNIP3, MDM2, and RRM2 and the immune microenvironment, we used the CIBERSORT algorithm to evaluate the relationship between the immune infiltrating subsets and the prognostic risk-scoring model in MDS patients. A shows a heat map of the interaction among the 22 tumor-infiltrating immune subsets and 3 hub genes. BNIP3 is negatively correlated with naïve B cells, while MDM2 is positively correlated with naïve B cells. As expected, RRM2 is negatively correlated with Tregs. The proportion of memory B cells and naïve T cells was decreased in the high-risk group compared with the low-risk group, whereas the proportion of resting NK cells, CD8+ T cells, and Tregs was increased (B). Furthermore, we found a positive correlation between risk score and CD8+ T cells, Tregs, and activated myeloid dendritic cells (R = 0.3, p = 0.00068; R = 0.52, p = 6.8 × 10⁻⁶; R = 0.24, p = 00084, respectively), and a negative correlation with naïve CD4+ T cells (R = −0.26, p = 0.0035, Figure C-F).
Figure 8. Correlation between the hub genes signature of BNIP3, MDM2, RRM2, and immune microenvironment. A. Correlation between risk genes and different immune infiltration cell types. B. The correlation of risk genes BNIP3, MDM2, and RRM2 expression with immune infiltration cell types in the high- and low-risk groups. C-F. The correlation of risk score with CD8+ T cells, naïve T cells CD4, regulatory T cells (Tregs), and activated myeloid dendritic cells.
Establishment of a predictive nomogram for MDS patients
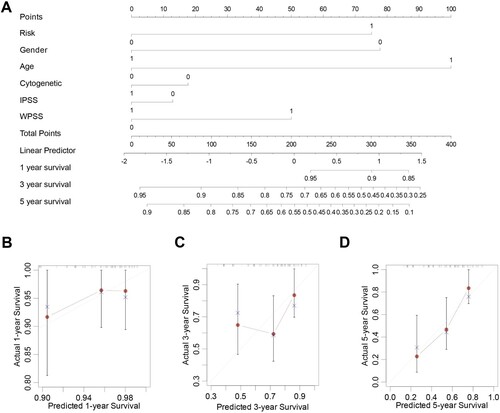
Based on the results of the multivariate logistic regression analyses, we developed a nomogram containing our prognostic risk-scoring model and multiple clinical factors. MDS risk category, gender, age(>60), cytogenetics, and risk subtypes were eventually selected to establish an accurate predictive nomogram (A). Calibration plots for 1-, 3-, and 5-year OS demonstrated no deviations from the Platt calibration curves, indicating a high predictive accuracy for the nomogram (B-D). Thus, the 1-, 2-, and 3-year OS survival rates establish a therapeutically useful, steady, and reliable prediction model for patients with MDS.
Figure 9. Nomogram construction. A. Nomogram predicting 1-, 3-, and 5-year OS for the MDS patients. (B-D). Calibration curve for the nomogram.
Validation of risk genes
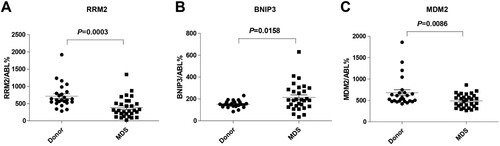
The expression levels of BNIP3, MDM2, and RRM2 were measured by qPCR of bone marrow specimens from MDS patients and compared with those from healthy controls. Our PCR results demonstrated that the expression of MDM2 (C) and RRM2 (A) in patients with MDS, particularly high-risk patients, was lower than in the controls, whereas the expression of BNIP3 (B) was higher than in the controls (all p < 0.05). The clinical characteristics and risk genes expression of these patients were presented in Supplementary Table S4.
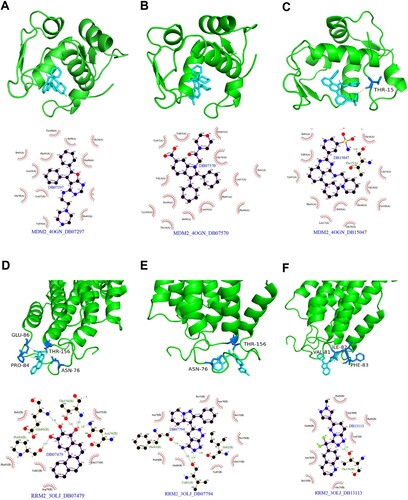
Figure 10. Protein molecular docking and interaction analysis. Top 3 interaction conformation and interaction of MDM2 (A-C) and RRM2 (D-F).
Candidate drug prediction
Molecular-targeted therapy is one of the most effective cancer treatments. Therefore, to further explore potential therapeutic drugs for MDS treatment, we employed molecular docking using ferroptosis-related DEGs. A total of 5,464 small molecules interacting with signature proteins were found in the DrugBank database according to Lipinski rules. As potential therapeutic targets, MDM2 and RRM2, whose 3D structures were obtained from the PDB database, were selected. MDM2 and RRM2 were docked with small compounds using AutoDock Vina, and the interaction forces were examined by Ligplus (Supplementary Tables S5). The top three small compounds with the highest interaction force scores for MDM2 (including DB15047, DB07570, and DB07297, A-C) and RRM2 (including DB13113, DB07479, and DB07794, D-F) were obtained for display.
Figure 11. In vitro validation of three risk genes. (A) RRM2, (B) BNIP3, (C) MDM2 mRNA expression level in the healthy controls and MDS samples.
Discussion
MDS is a heterogeneous group of disorders originating from hematopoietic stem cells and is characterized by ineffective hematopoiesis, refractory hemocytopenia, cellular immune disorders, and a high propensity for AML [Citation24]. Although demethylation therapy can improve survival, treatment of patients with high-risk MDS remains challenging, and long-term efficacy is poor [Citation25]. It has been shown that ferroptosis can induce the death of MDS cells [Citation14], and it is expected to be a novel treatment target for MDS patients. Nevertheless, further investigation is needed to explore the influences of ferroptosis in the diagnosis and prognosis of MDS. In our study, we identified three ferroptosis-related DEGs in healthy controls and patients with MDS as key genes and constructed a diagnostic and prognostic risk-scoring model to predict the survival of patients with MDS.
There is currently little known about ferroptosis in MDS, and some studies have identified DEGs that predict the prognosis of patients with MDS [Citation26]. However, MDS is characterized by iron overload and iron metabolism disorder [Citation14,Citation27]. Thus, it is essential to explore the exact role of ferroptosis-associated genes in MDS patient diagnosis and prognosis. Our study grouped MDS patients into two clusters based on ferroptosis-related genes, and candidate genes were screened between the two clusters. These genes were not only associated with ferroptosis but also demonstrated a comprehensive representation of the whole gene population of MDS patients. In addition, previous studies did not construct prognostic nomograms and lacked further investigation of risk signatures [Citation26,Citation28]. Our study not only developed an effective nomogram incorporating both a prognostic signature and clinical characteristics but also analyzed correlations between immune activity and a risk signature. Moreover, we screened for potential drugs, which may provide a basis for future targeting of MDM2 and RRM2 in MDS.
We identified three ferroptosis-related genes including BNIP3, MDM2, and RRM2 as key genes, and as expected, these genes performed well in the diagnosis of MDS. In ROC analysis, the AUC values for BNIP3, MDM2, and RRM2 were greater than 0.8 when analyzing data from the GSE58831 and GSE19429 datasets, indicating that these genes could be potential diagnostic biomarkers for MDS. Additionally, MDS patients could be divided into high- and low-risk groups according to the risk score. The area under the curve values for 1, 3, and 5 years were 0.81, 0.827, and 0.786 in the training set, respectively, indicating good predictive efficacy. Furthermore, Our PCR results demonstrate that the expression of MDM2 and RRM2 in patients with MDS, particularly high-risk patients, was lower than that of normal controls in our study. Interestingly, studies have also shown that MDM2, a key negative regulator of TP53, is amplified in MDS patients [Citation29]. Additionally, another study demonstrated that severe disease in MDS patients is associated with reduced MDM2 expression [Citation30]. The expression of BNIP3 in patients with MDS was higher than that in normal controls, which is consistent with the results of the aforementioned analysis. However, research has demonstrated that SKM-1, an MDS cell line, when treated with 4-Amino-2-trifluoromethyl-phenyl retinate (ATPR) has elevated BNIP3 mRNA and protein levels, and this is different from a previous study [Citation31]. This difference may be due to the different specimen sources. It is important to note that tumor cell lines may not be accurate representations of primary human samples, and there is a need for more research on this topic. Moreover, it may be best to combine RNA sequencing of sorted cancer cells with clinical characteristics to verify the model.
At present, an abnormal immune microenvironment specifically including T cells, B cells, and NK cells has been recognized as an important trigger for the progression or relapse of MDS [Citation32,Citation33]. For instance, regulatory T cells were decreased in the early stage of MDS or in low-risk patients, and it increased in later stages [Citation34]. A recent study has indicated that many genes related to phenotype in macrophages exhibit diverse responses to iron overload or deferoxamine treatment in MDS [Citation35]. In our study, we found that three ferroptosis-related genes, BNIP3, MDM2, and RRM2, were related to infiltrating immune cells. Naïve B cells are negatively correlated with BNIP3, whereas they are positively correlated with MDM2. In addition, RRM2 is negatively correlated with Treg cells, which is consistent with the gene expression. Nevertheless, our study demonstrates that there is a certain correlation between risk score and immune cell infiltration. Risk groups were categorized as low risk and high risk, and the proportion of memory B cells and CD4+ T cells was downregulated in the high-risk group, whereas the populations of resting NK cells, CD8+ T cells, and Treg cells were upregulated compared with the low-risk group. In addition, there is a positive correlation between risk score and CD8+ T cells, myeloid dendritic activated cells, and Treg cells, and the negative correlation between naive CD4+ T cells and risk score indicates that BNIP3, MDM2, and RRM2 are closely related to the immune microenvironment. However, research combining a greater amount of clinical laboratory information and clinical samples is needed to further elucidate the relationship between risk score and the immune microenvironment of MDS.
Currently, effective molecular-targeted therapy is one of the common ways to treat tumors. According to Lipinski rules, 5,464 small molecules that interact with the signature proteins were found in the DrugBank database (https://go.drugbank.com/). We selected the top 10 small compounds that can simultaneously and closely bind to MDM2 (including DB15047, DB07570, and DB07297) and RRM2 (including DB13113, DB07479, and DB07794) from the PDB database. DB15047 is under investigation for the treatment of paroxysmal atrial fibrillation in the clinical trial NCT02156076, while DB13113 is being studied in patients with advanced or refractory solid tumors (clinical trial: NCT00651365). These molecules may be used as potential therapeutic drugs, providing ideas and resources for future research of targeted drugs for MDS. Although more experimental evidence is required for these medicinal molecules, this study can increase the probability that drugs will be developed successfully.
Our study also has some limitations. First, although we provide a nomogram for predicting survival in MDS, more prospective studies are needed to confirm the reliability of this nomogram. Second, the relationship between immune cells and risk score was extrapolated using CIBERSORT rather than true detection of the proportions of MDS patients. Third, the conversion of MDS to leukemia and the mutation distribution of the prognostic model was not further investigated in our study due to the lack of relevant clinical data. Fourth, the small sample size we obtained also contributed to this study’s limitations. Finally, we still need more experimental evidence to verify our conclusions and explore the exact mechanism of these three ferroptosis-related genes in MDS progression and therapy.
Conclusion
This study demonstrated that the ferroptosis-related genes BNIP3, MDM2, and RRM2 were of prominent value in the diagnosis and prognosis of MDS. We also provided insight into the landscape of immune cells and potential therapeutics. drugs in MDS.
Ethics statement
The study involving human participants was reviewed and approved by the Ethics Committee of the Guangdong Provincial People’s Hospital. Written informed consent to participate in this study was provided by the participant’s legal guardian or next of kin.
Author contributions
XMC, PLL, XD, and CL conceived and designed the experiments. XMC, CL, YLW, PLL, SXG, MZX, CXD, MML, and XH performed the experiments and analyzed the data. XMC, PLL, CL, XD, and JYW wrote the paper. All authors read and approved the final manuscript.
Declarations
Ethics approval and consent to participate
All animal protocols were approved by the Ethics Committee of Guangdong Provincial People’s Hospital. Animal research was performed in accordance with the guidelines provided by the Institutional Animal Care and Use Committee.
supple_Fig1.jpg
Download JPEG Image (363.3 KB)
supple_Fig4.jpg
Download JPEG Image (201.1 KB)
supple_Fig3.jpg
Download JPEG Image (209 KB)
Disclosure statement
No potential conflict of interest was reported by the author(s).
Data availability statement
Publicly available datasets were analyzed in this study and can be obtained from GEO (https://www.ncbi.nlm.nih.gov/gds/).
Additional information
Funding
References
- Cazzola M. Myelodysplastic syndromes. N Engl J Med. 2020;383(14):1358–1374.
- [Fenaux] Haase P, Santini D, Sanz V, et al. Myelodysplastic syndromes: ESMO clinical practice guidelines for diagnosis, treatment and follow-up(dagger). Ann Oncol: Official J Eur Soc Med Oncol. 2021;32(2):142–156. doi:10.1016/j.annonc.2020.11.002
- Garcia-Manero G, Chien KS, Montalban-Bravo G. Myelodysplastic syndromes: 2021 update on diagnosis, risk stratification and management. Am J Hematol. 2020;95(11):1399–1420.
- Kennedy AL, Shimamura A. Genetic predisposition to MDS: clinical features and clonal evolution. Blood. 2019;133(10):1071–1085. doi:10.1182/blood-2018-10-844662
- Huber S, Haferlach T, Meggendorfer M, et al. SF3B1 mutated MDS: blast count, genetic co-abnormalities and their impact on classification and prognosis. Leukemia. 2022;36(12):2894–2902.
- Duncavage EJ, Bagg A, Hasserjian RP, et al. Genomic profiling for clinical decision making in myeloid neoplasms and acute leukemia. Blood. 2022;140(21):2228–2247. doi:10.1182/blood.2022015853
- Zeidan AM, Shallis RM, Wang R, et al. Epidemiology of myelodysplastic syndromes: why characterizing the beast is a prerequisite to taming it. Blood Rev. 2019;34:1–15. doi:10.1016/j.blre.2018.09.001
- Dixon SJ, Lemberg KM, Lamprecht MR, et al. Ferroptosis: an iron-dependent form of nonapoptotic cell death. Cell. 2012;149(5):1060–1072. doi:10.1016/j.cell.2012.03.042
- Jiang X, Stockwell BR, Conrad M. Ferroptosis: mechanisms, biology and role in disease. Nat Rev Mol Cell Biol. 2021;22(4):266–282. doi:10.1038/s41580-020-00324-8
- Lee H, Zandkarimi F, Zhang Y, et al. Energy-stress-mediated AMPK activation inhibits ferroptosis. Nat Cell Biol. 2020;22(2):225–234. doi:10.1038/s41556-020-0461-8
- Lei G, Zhuang L, Gan B. Targeting ferroptosis as a vulnerability in cancer. Nat Rev Cancer. 2022;22(7):381–396. doi:10.1038/s41568-022-00459-0
- Yusuf RZ, Saez B, Sharda A, et al. Aldehyde dehydrogenase 3a2 protects AML cells from oxidative death and the synthetic lethality of ferroptosis inducers. Blood. 2020;136(11):1303–1316. doi:10.1182/blood.2019001808
- [Chu] B, Kon N, Chen D, et al. ALOX12 is required for p53-mediated tumour suppression through a distinct ferroptosis pathway. Nat Cell Biol. 2019;21(5):579–591. doi:10.1038/s41556-019-0305-6
- Lv Q, Niu H;, Yue L, et al. Abnormal ferroptosis in myelodysplastic syndrome. Front Oncol. 2020;10:1656.
- Stockwell BR, Jiang X. A Physiological function for ferroptosis in tumor suppression by the immune system. Cell Metab. 2019;30(1):14–15. doi:10.1016/j.cmet.2019.06.012
- Liao P, Wang W, Wang W, et al. CD8(+) T cells and fatty acids orchestrate tumor ferroptosis and immunity via ACSL4. Cancer Cell. 2022;40(4):365–378 e6. doi:10.1016/j.ccell.2022.02.003
- Winter S, Shoaie S, Kordasti S, et al. Integrating the “immunome” in the stratification of myelodysplastic syndromes and future clinical trial design. J Clin Oncol. 2020;38(15):1723–1735.
- Giovazzino A, Leone S, Rubino V, et al. Reduced regulatory T cells (Treg) in bone marrow preferentially associate with the expansion of cytotoxic T lymphocytes in low risk MDS patients. Br J Haematol. 2018;185(2):357–360.
- Kordasti SY, Ingram W, Hayden J, et al. CD4+CD25high Foxp3 + regulatory T cells in myelodysplastic syndrome (MDS). Blood. 2007;110(3):847–850.
- Xu C, Sun S, Johnson T, et al. The glutathione peroxidase Gpx4 prevents lipid peroxidation and ferroptosis to sustain Treg cell activation and suppression of antitumor immunity. Cell Rep. 2021;35(11):109235. doi:10.1016/j.celrep.2021.109235
- [Weber] S, Parmon A, Kurrle N, et al. The clinical significance of Iron overload and iron metabolism in myelodysplastic syndrome and acute myeloid leukemia. Front Immunol. 2020;11:627662.
- Franke GN, Kubasch AS, Cross M, et al. Iron overload and its impact on outcome of patients with hematological diseases. Mol Aspects Med. 2020;75:100868. doi:10.1016/j.mam.2020.100868
- Geng S, Xu R, Huang X, et al. Dynamics of PD-1 expression are associated with treatment efficacy and prognosis in patients with intermediate/high-risk myelodysplastic syndromes under hypomethylating treatment. Front Immunol. 2022;13:950134. doi:10.3389/fimmu.2022.950134
- Saygin C, Carraway HE. Current and emerging strategies for management of myelodysplastic syndromes. Blood Rev. 2021;48:100791. doi:10.1016/j.blre.2020.100791
- Scalzulli E, Pepe S, Colafigli G, et al. Therapeutic strategies in low and high-risk MDS: what does the future have to offer? Blood Rev. 2021;45:100689. doi:10.1016/j.blre.2020.100689
- Huang X, Liang X, Zhu S, et al. Expression and clinical significance of RAG1 in myelodysplastic syndromes. Hematology. 2022;27(1):1122–1129. doi:10.1080/16078454.2022.2127462
- Shenoy N, Vallumsetla N, Rachmilewitz E, et al. Impact of iron overload and potential benefit from iron chelation in low-risk myelodysplastic syndrome. Blood. 2014;124(6):873–881. doi:10.1182/blood-2014-03-563221
- Siamoglou S, Boers R, Koromina M, et al. Genome-wide analysis toward the epigenetic aetiology of myelodysplastic syndrome disease progression and pharmacoepigenomic basis of hypomethylating agents drug treatment response. Hum Genomics. 2023;17(1):37. doi:10.1186/s40246-023-00483-7
- Preudhomme C, Quesnel B, Vachee A, et al. Absence of amplification of MDM2 gene, a regulator of p53 function, in myelodysplastic syndromes. Leukemia. 1993;7(8):1291–1293.
- Salomao N, Maslah N, Giulianelli A, et al. Reduced murine double minute 2 and 4 protein, but not messenger RNA, expression is associated with more severe disease in myelodysplastic syndromes and acute myeloblastic leukaemia. Br J Haematol. 2023;201(2):234–248. doi:10.1111/bjh.18608
- Du Y, Li LL, Chen H, et al. A novel all-trans retinoic acid derivative inhibits proliferation and induces apoptosis of myelodysplastic syndromes cell line SKM-1 cells via up-regulating p53. Int Immunopharmacol. 2018;65:561–570. doi:10.1016/j.intimp.2018.10.041
- Trowbridge JJ, Starczynowski DT. Innate immune pathways and inflammation in hematopoietic aging, clonal hematopoiesis, and MDS. J Exp Med. 2021;218(7):e20201544. doi:10.1084/jem.20201544
- Sallman DA, List A. The central role of inflammatory signaling in the pathogenesis of myelodysplastic syndromes. Blood. 2019;133(10):1039–1048. doi:10.1182/blood-2018-10-844654
- Giovazzino A, Leone S, Rubino V, et al. Reduced regulatory T cells (Treg) in bone marrow preferentially associate with the expansion of cytotoxic T lymphocytes in low risk MDS patients. Br J Haematol. 2019;185(2):357–360. doi:10.1111/bjh.15496
- Yang F, Wu Z, Yang D, et al. Characteristics of macrophages from myelodysplastic syndrome microenvironment. Exp Cell Res. 2021;408(1):112837. doi:10.1016/j.yexcr.2021.112837