
 ?Mathematical formulae have been encoded as MathML and are displayed in this HTML version using MathJax in order to improve their display. Uncheck the box to turn MathJax off. This feature requires Javascript. Click on a formula to zoom.
ABSTRACT
Objectives
Acute myeloid leukemia (AML) is one of the common hematological diseases with low survival rates. Studies have highlighted the dysregulated expression of immune-related and exosome-related genes (ERGs) in cancers. Nevertheless, it remains to be determined whether combining these genes have a prognostic significance in AML.
Methods
Immune-ERG profiles for 151 AML patients from TCGA were analyzed. A risk model was constructed and optimized through the combination of univariate Cox regression and LASSO regression analysis. GEO datasets were utilized as the external validation for the robustness of the risk model. In addition, we performed KEGG and GO enrichment analyses to investigate the role played by these genes in AML. The variations in immune cell infiltrations among risk groups were assessed through four algorithms. Expression of hub gene in specific cell was analyzed by single-cell RNA seq.
Results
A total of 85 immune-ERGs associated with prognosis were identified, enabling the construction of a risk model for AML. The risk model based on five immune-ERGs (CD37, NUCB2, LSP1, MGST1, and PLXNB1) demonstrated a correlation with the clinical outcomes. Additionally, age, FAB classification, cytogenetics risk, and risk score were identified as independent prognostic factors. The five immune-ERGs exhibited correlations with cytokine-cytokine receptor interaction, and antigen processing and presentation. Notably, the risk model demonstrated significant associations with immune responses and the expression of immune checkpoints.
Conclusions
An immune-ERG-based risk model was developed to effectively predict prognostic outcomes for AML patients. There is potential for immune therapy in AML targeting the five hub genes.
Introduction
Acute myeloid leukemia (AML) is the predominant form of acute leukemia in adults, characterized by clonal proliferation, and abnormal differentiation of hematopoietic stem and progenitor cells derived from the bone marrow (BM) [Citation1]. Despite the approval of various targeted therapies, such as BCL2 inhibitors [Citation2], the survival rates of AML patients remain unsatisfactory. Disease progression is accompanied by alterations in the bone marrow mesenchymal niche [Citation3]. Several studies have suggested that the BM microenvironment (BMM) plays a crucial role in the pathogenesis of AML and development of resistance to chemotherapy.
Exosomes, ranging from 30 to 150 nm in diameter, are lipid-bilayer encapsulated particles formed through the budding of the endosomal membrane [Citation4,Citation5]. The particles contain nucleic acids, including messenger RNAs (mRNAs), miRNAs, as well as specific proteins and lipids [Citation6]. They play a crucial role in regulating cell–to–cell communication and are involved in various physiological and pathological processes [Citation7,Citation8]. Notably, exosomes derived from both bone marrow mesenchymal stem cells (BMSCs) and AML cells are the primary contributors to AML pathogenesis [Citation9]. Among the anti-apoptotic proteins carried by AML exosomes are BCL-2 and MCL-1, which stimulate the anti-apoptotic function of myeloid cells in their immature state [Citation10]. The composition of exosomes reflects the characteristics of BMSCs and AML cells, suggesting their potential value in diagnosis and prognosis.
Exosomes exert a dual influence on cancer cells by modulating gene expression and regulating immune cells within the tumor microenvironment (TME) [Citation11]. Leukemia exosomes containing MICA/B and ULBP1/2 inhibit NK cell activation by interfering with NKG2D, expressed by NK cells [Citation12]. Inhibiting the proliferation of CD4+ and CD8+ T lymphocytes, or promoting the differentiation of regulatory T lymphocytes or myeloid cells, are some of the effects of tumor-secreted exosomes cotaining various immunosuppressive molecules [Citation13–16]. Myeloid derived suppressor cells (MDSCs) have enhanced suppressive activity against T cells in multiple myeloma when exosomes derived from BMSCs by activating the STAT3/STAT1 signaling pathways [Citation17]. Specifically, the interaction between programmed death ligand (PD-L1) carried by exosomes and T cells expressing PD-1 leads to reduced sensitivity to immune checkpoint (ICP) inhibitors [Citation18]. Therefore, exosomes may play a crucial role in immunotherapeutic interventions. Consequently, it is imperative to elucidate the significance of exosome-related genes (ERGs) associated with the immune microenvironment in predicting the prognosis of patients with AML.
Our study explores the relationship between immune and exosome-related genes and the prognosis in AML patients. An immune and exosome-related genes (immune-ERGs) signature is constructed for prognostication of AML patients. There are five hub genes (CD37, NUCB2, LSP1, MGST1, PLXNB1) that have been identified as potential prognostic markers for AML patients and potentially as therapeutic targets.
Materials and methods
Preprocessing of data and study population
The Cancer Genome Atlas (TCGA) database (https://portal.gdc.cancer.gov/) was consulted for the mRNA sequencing and clinical data of 151 AML samples [Citation19]. Clinical data and full expression profiles (GSE71014, GSE106291) were downloaded from the GEO database (https://www. ncbi.nlm.nih.gov/gds). Totals of 5211 ERGs from bone marrow cells, bone marrow mesenchymal stem cells, bone marrow mesenchymal stromal cells, myeloid leukemia cells and leukemia cells in Vesiclepedia v4.1 database (http://microvesicles.org/download) were utilized in this study [Citation20,Citation21]. The single-cell RNA-seq (scRNA-seq) data of 16 AML patients were downloaded from the GSE116256 dataset, GEO database [Citation22]. As all the data utilized in this study were obtained from publicly available databases, ethical approval was not required.
The construction of a prognostic signature based on immune-ERGs for AML
The TCGA database was utilized to identify 85 prognostic candidate immune-ERGs using least absolute shrinkage and selection operator (LASSO) Cox regression analyses in order to prevent overfitting and minimize redundancy [Citation23]. The value of λ was determined by 10-fold cross validation, selecting the λ (value = 0.189734) that resulted in the smallest mean squared error. There were five genes ultimately selected to develop a prognostic risk score model for AML patients. The formula is as follows:
Based on the median risk score for the AML cohort sample, the TCGA dataset categorizes patients with AML into high- and low-risk groups. To determine the difference in survival outcomes between groups at high- and low-risk, Kaplan-Meier (K-M) was applied. To ascertain whether immune-ERGs-based signatures are autonomous prognostic factors, univariate and multivariate Cox regression analyses were conducted, taking risk scores as well as other clinical data, such as age, FAB classification, and cytogenetic information into account.
Developing and evaluating AML nomograms
Multivariate analysis was conducted using the R package ‘rms’ to analyze the nomogram incorporating factors significantly associated with OS in TCGA-AML patients. The calibration plot was used to assess discrepancies between actual and nomogram-predicted OS probabilities.
Analyses of immune
Calculations based on the ESTIMATE algorithm ‘estimate’ in R were performed for tumor purity fraction, estimates score, immune score, and stroma score. A correlation between risk scores and immune cell infiltration levels was estimated in TIMER2.0 using algorithms EPIC, MCPCOUNTER, QUANTISEQ, and XCELL (https://cistrome.shinyapps.io/timer/).
Single-cell RNA seq of cell composition
The scRNA-seq datasets of 16 AML patients were acquired from GEO dataset (GSE116256). The datasets were integrated using merge function of Seurat R package and clustered using UMAP plots. Violin plots were used to map gene expression in specific cells. The cell type was annotated using metadata from the dataset.
Analyses of functional enrichment
The ‘DESeq2’ package was used to analyze differences in gene expression between high-risk and low-risk groups. In order to enrich differentially expressed genes using Gene Ontology (GO) and Kyoto Encyclopedia of Genes and Genomes (KEGG), the ‘ClusterProfiler’ package in R was used.
Statistical analysis
R Studio (version 4.0.5) was used to run all R packages. Correlations were determined using Pearson correlation analyses. Kaplan-Meier survival curves were compared using log-rank tests. Significant values were determined at ****p < 0.0001, ***p < 0.001, **p < 0.01, p < 0.05, and ns, p ≥ 0.05.
Results
The immune-ERGs-based prognostic model for AML
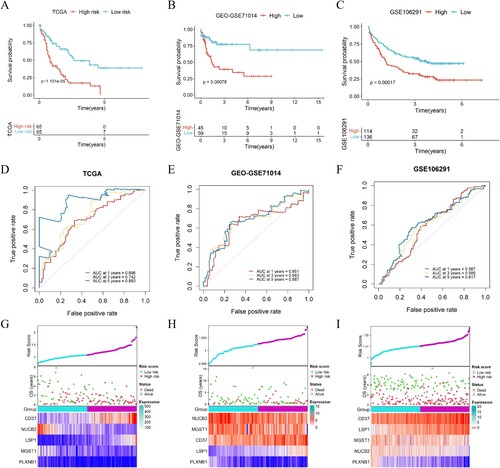
Based on univariate Cox regression analysis of 5,211 ERGs, 968 potential prognosis-related genes were identified. And 85 genes were associated with immune score (). An immune-ERG-based signature was established using LASSO cox regression to identify the most optimal candidate genes. As a result, five non-zero coefficient genes were selected as the optimal prognostic model ((A,B)), and we did not find a high degree of collinearity in these variables (Fig. S2). The relationship between expression of these five genes and prognosis in AML were shown in (C). AML patients were divided into high-risk (risk score range 1.082 to 2.190) and low-risk (risk score range 0.729 to 1.081) categories based on the median risk score (cutoff = 1.082). Based on Kaplan-Meier survival analysis in the TCGA set, the high-risk group showed inferior prognostic outcomes ((A)). Data from GEO datasets GSE71014 and GSE106291, which were associated with poor outcomes, were used to verify the risk model ((B,C)). The ROC curves were utilized to evaluate the predictive accuracy of the prognostic model. The AUC valued for the TCGA cohort at 1-, 3-, and 5-years were determined to be 0.696, 0.742, and 0.893, respectively ((D)). Accordingly, the AUC for the GSE71014 cohorts at 1-, 3-, and 5-years were 0.651, 0.683, and 0.687, respectively ((E)). And for GSE106291 cohorts at 1-, 3-, and 5-years were 0.587, 0.595, and 0.617, respectively ((F)). Additionally, the distributions of expression patterns for five immune-ERGs, risk scores, survival time, and survival status in the TCGA and GEO cohorts were determined ((G–I)). Our findings demonstrated the significant prognostic value of AML-ERG signature.
Figure 1. Flow chart. From 5211 ERGs, 85 candidate immune-related genes associated with the prognosis of patients with AML were identified from the TCGA dataset. LASSO analysis was used to construct a 5 immune-ERG-based signature. Survival and ROC curves were calculated to determine the prognostic value of the signature. A final risk model was constructed by combining genetic characteristics and clinical information.
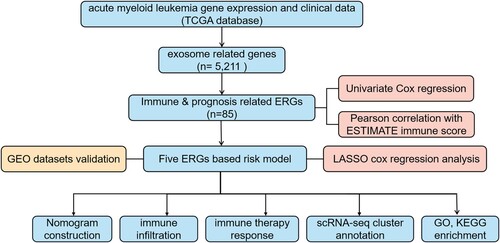
Figure 2. Construction of prognostic model for immune-exosome-related genes. (A) The LASSO coefficient spectrum was analyzed for 85 genes associated with exosome and immune. Each curve in the spectrum represents a specific gene. (B) A proportional hazards model was selected using cross-validation. (C) The overall survival (OS) of the TCGA-AML dataset was examined in relation to a prognostic model constructed using CD37, NUCB2, LSP1, MGST1, PLXNB1.
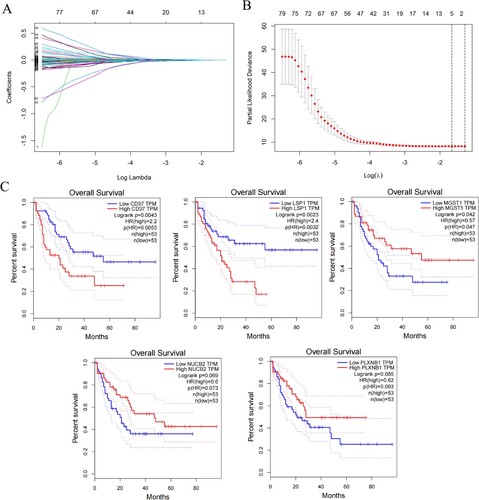
Figure 3. Development and validation of the immune-exosome-related genes prognostic model and predicting the outlook of AML patients. (A–C) Survival analysis was conducted for high- and low-risk groups in the TCGA dataset and GEO datasets GSE71014, and GSE106291. (D–F) The TCGA and GEO datasets were used to perform ROC curve analysis, which assessed the model’s predictive of performance over time. (G–I) In the distribution of expression profiles for 5 hub genes, the risk score, and survival status were assessed in the TCGA dataset (G) and GEO datasets (H, I), respectively.
Analysis of the signature of immune-ERG, nomogram construction and evaluation
There are several genes that are frequently mutated in AML. Based on the mutational status of AML immune-ERG subgroup samples, RUNX1 mutations appeared to be more prevalent in high-risk score subgroups. While mutations in NRAS, FLT3, TP53, CEBPA, IDH1 were not significant in two groups ((A)).
Figure 4. Analysis of the signature of immune-ERG, nomogram construction and evaluation. (A) Distribution of the percentage of different mutations between high- and low-risk groups. (B, C) Univariate (B) and multivariate (C) Cox regression analyses were conducted to investigate the connections between overall survival and different clinical factors, encompassing risk scores within the TCGA dataset. (D) Nomogram survival prediction models were developed to forecast the OS of patients with AML at 1-, 3-, and 5-years. (E) Calibration plots were generated to assess the accuracy of the nomogram in predicting survival at different time points.
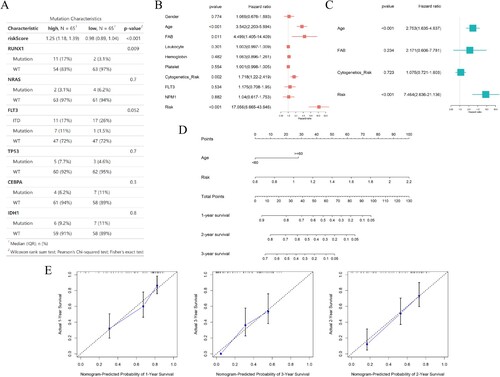
In order to evaluate the independent nature of the five-gene signature with other clinical characteristics in AML patients, both univariate and multivariate Cox regression analysis were performed. The analysis of TCGA data using univariate Cox regression demonstrated that age (HR = 3.542, p < 0.001), FAB classification (HR = 4.499, p = 0.011), cytogenetic risk (HR = 1.718, p = 0.002), and immune-ERG risk score (HR = 17.056, p < 0.001) were identified as independent prognostic variables for AML patients ((B)). AML patients in M3 subtypes were associated with low-risk scores, comparing with other FAB subtypes (Fig. S1A). What’s more, high cytogenetics risk was positively correlated with risk scores (Fig. S1B). In addition, multivariate cox regression analysis for the TCGA dataset revealed an independent association between age and immune-ERG risk score (HR = 2.753, p < 0.001 and HR = 7.464, p < 0.001) ((C)). To further evaluate the predictive ability of the factors for individual overall survival, a nomogram was constructed, incorporating ERGs and other clinical factors, such as age, FAB classification, and cytogenetics risk. The nomogram was then utilized to calculate the predictive effects for 1-, 2-, and 3-year overall survival outcomes in AML patients ((D)). The calibration chart demonstrated the accuracy of the nomogram’s effectiveness ((E)). Our study revealed that immune and exosome-related genes may be useful as prognostic indicators.
The immune microenvironment
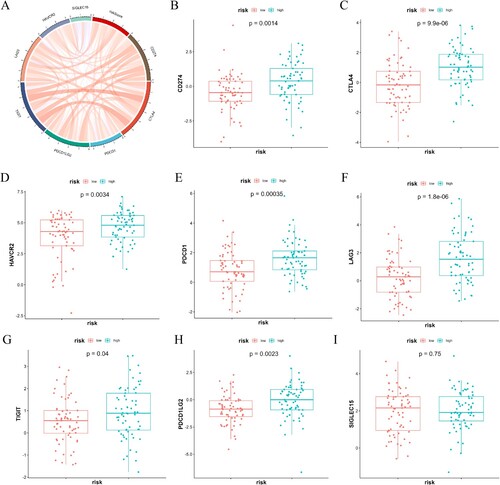
We conducted an investigation into the correlation between the risk score and the immune microenvironment. Compared to the high-risk groups, the low-risk group displayed a higher tumor purity fraction ((A)). However, the high-risk group exhibited significantly higher immune ((B)), estimate ((C)), and stroma ((D)) scores. The immune functional analysis revealed a higher level of activity in monocytes with the high-risk group compared to the low-risk group. Conversely, mast cell in a resting state, activated dendritic cells, and follicular helper T cells exhibited increased activity in the low-risk group ((F)). To further investigate the relationship between the immune microenvironment and risk scores, various immune cell profiles were constructed in AML samples using four different algorithms (CIBERSORT, EPIC, MCPCOUNTER, and QUANTISEQ ((E))). The patients in high-risk group displayed more substantial infiltration of CD8+ T cells and B cells. The results indicated the risk score was positively correlated with immune checkpoint expressions ((A)), particularly CD274 and CTLA4 expressions ((B, C)).
Figure 5. The correlation between the gene signature related to immune-exosomes and microenvironment in the TCGA dataset. (A–D) Notable variations were noted in the tumor purity (A), immune (B), estimate (C), and stroma scores (D) among the two risk categories. (E) Immune cell infiltration levels differed significantly between the high-risk and low-risk groups. (F) The variations in cellular composition between high- and low-risk groups. *p < 0.05, **p < 0.01, ***p < 0.001, ****p < 0.0001.
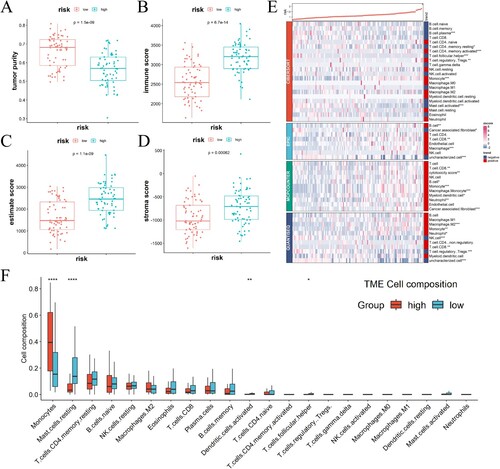
Figure 6. The relationship between scores indicating risk and the expression of immune checkpoint molecules. (A) In TCGA-AML, the expression of immune checkpoint molecules showed a positive correlation with the risk score. (B–I) A comparison was made between the two groups regarding the levels of immune checkpoint molecules in mRNA.
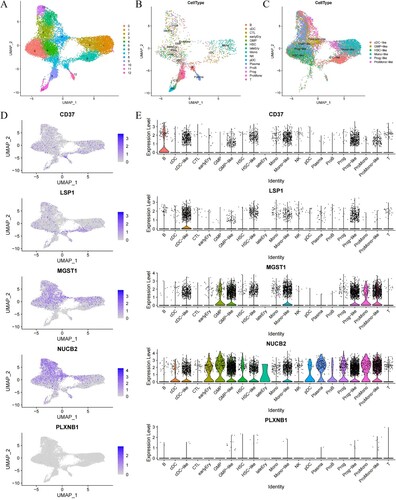
To analyze the expression specificity of model genes at the single-cell level, we utilized UMAP to cluster and annotate cell types. We annotated cells using metadata provided by the dataset, where ‘*-like’ represented maligant cells. UMAP plots mapping expression levels of marker genes identified aberrant expression of some characteristic genes in the maligant subset ((A–C)). In addition, the violin plots also revealed the expression levels of characteristic genes (CD37, LSP1, MGST1, NUCB2, PLXNB1) in different types of immune cells. As reported by others, a significant proportion of B cells express CD37. LSP1 appeared to be highly expressed in cDC-like cells. It was found that MGST1 and NUCB2 were widely expressed in various cells, including GMP, GMP-like, mono-like, and ProMono cells, ProMono-like cells. While the expression of PLXNB1 was low in all types of cells ((D, E)). In conclusion, the quantification of immune and exosome-related risk score holds significant importance for patients with AML, as it has the potential to serve as a novel biomarker for clinical treatment.
Figure 7. Tumor microenvironment analysis of clustering analysis by UMAP. (A–C) The UMAP plots of normal and maligant subsets. The UMAP plots of all subsets (A), normal subsets (B), and maligant subsets (C) show the expression levels of the specified signature genes. (D) The UMAP plots of AML samples show the expression levels of the specified signature genes. (E) Volin plots comparing the expression levels of five signature genes (CD37, LSP1, MGST1, NUCB2, PLXNB1) in the different types of cells.
Analyses of functional enrichment
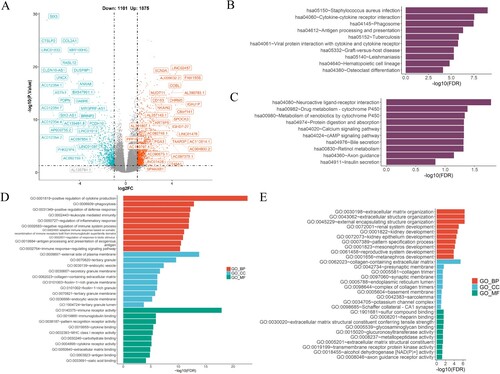
A screening for differentially expressed genes (DEGs) among high- and low-risk groups was conducted to evaluate the molecular characteristics of these two risk groups. The utilization of volcano map facilitated the visualization of these DEGs ((A)). The KEGG analysis revealed a significant enrichment in genes that associated with ‘Staphylococcus aureus infection’, ‘cytokine receptor interaction’, ‘phagosome’, and ‘hematopoietic cell lineage’ ((B)). The DEGs in the low-risk group, however, were enriched in ‘neuroactive ligand receptor interaction’, ‘drug metabolism-cytochrome P450’, and ‘metabolism of xenobiotics by cytochrome P450’ ((C)). As a result of the GO functional analysis, DEGs in the high-risk group exhibited positive correlations with ‘cytokine production’, ‘phagocytosis’, and ‘leukocyte mediated immunity’ ((D)), while DEGs in the low-risk group were associated with ‘extracellular matrix organization’, ‘extracellular structure organization’ ((E)). It is clear that immune-ERGs play a significant role in AML, as well as potential molecular mechanisms in its development.
Figure 8. The enriched biological processes in risk model. (A) The volcano map depicted the differential expression of immune and exosome-related genes in the TCGA-AML cohort. (B, C) Enrichment pathways in the high-(B) and low-(C) risk groups were identified through KEGG analysis. (D, E) The GO enrichment analysis was performed to assess the enrichment of certain biological processes in the two groups. BP, biological processes; CC, cellular components; MF, molecular functions.
Discussion
The utilization of high-throughput sequencing technologies has significantly enhanced the detection of genes and therapeutic targets associated with prognosis [Citation24,Citation25]. Nevertheless, the absence of dependable prognostic biomarkers for AML remains a challenge. Exosomes, which transport RNAs and proteins between cells, have emerged as a value resource for cancer treatment, including AML [Citation26]. Numerous ERGs have been implicated in the advancement of diverse cancers. In this study, we constructed a risk model based on immune-ERGs utilizing publicly available databases. Through univariate and multivariate Cox analysis, we determined that both stage and risk scores independently serve as prognostic indicators for AML patients. Univariate Cox analyses revealed that five survival-related genes, namely CD37, NUCB2, LSP1, MGST1, and PLXNB1 were identified. These genes were utilized to establish a prognostic signature consisting of five genes for patients with AML.
A variety of biological processes are mediated by tetraspanins, including cell survival, intercellular communication via exosomes and immune responses [Citation27,Citation28]. CD37, a member of the transmembrane 4 superfamily (TM4SF), has been reported to exhibit abnormal expression in various malignancies. The CD37 antigen demonstrated strong expression on B lymphocytes with positive surface immunoglobulin, while displaying weak expression on a subset of monocytes, granulocytes, and T cells. Conversely, neither platelets nor red blood cells exhibited CD37 expression [Citation29,Citation30]. The CD37 protein is essential for the interaction between T cells and B cells and for the production of IgG ana IgA [Citation30–33]. CD37 has been observed to exhibit high expression on malignant B cells in chronic lymphocytic leukemia (CLL) and non-Hodgkin lymphoma (NHL) [Citation29,Citation34]. The antibody-drug conjugate IMGN529, which specially targets CD37, has demonstrated remarkable efficacy against CLL [Citation35]. Qi Zhang et al. have presented evidence that AML also exhibited overexpression of CD37, and this heightened expression is correlated with a negative prognosis [Citation36]. CD37 plays a role in both pro-survival and proapoptotic signaling by facilitating AKT phosphorylation [Citation37]. Additionally, CD37 is abundantly present in exosomes released from CLL cells. Exosomes derived from B cell lymphoma, which contain CD19, have been observed to shield lymphoma cells from rituximab-induced complement-dependent cytotoxicity [Citation38]. As a hub gene, CD37 was screened out in our risk model, and its high expression was correlated with poor outcome in patients with AML suggesting that CD37 may be a promising target for AML.
Nucleobindin-2 (NUCB2), a DNA/Ca2+ binding protein, has been implicated in the regulation of the immune and endocrine systems [Citation39,Citation40]. NUCB2 has been identified as a secretory component in various body fluids, including serum [Citation39,Citation40]. Several studies have demonstrated that NUCB2 acts as an oncogene in certain solid tumors. In breast cancer cells, the NUCB2/Nesfatin-1 complex promoted the cholesterol synthesis through mTORC1 pathway, thereby facilitating cell metastasis [Citation41]. Additionally, NUCB2/Nesfatin-1 enhances the growth, migration and invasion of gastric cancer cells [Citation42]. However, our study revealed that high expression of NUCB2 was correlated with a favorable prognosis in AML, which diverged from the findings observed in other types of cancer.
Leukocyte-specific protein-1 (LSP1), an F-actin binding protein, has been implicated in the progression of various solid tumors progression, including breast cancer, hepatocellular carcinoma [Citation43,Citation44]. In hepatocellular carcinoma, LSP1 has been found to inhibit cell proliferation [Citation44]. Conversely, a meta-analysis demonstrated a significant association between LSP1 rs3817198 (T > C) polymorphism and the development of breast malignancy [Citation43]. Additionally, Riri Kwon et al. demonstrated in a mouse model that LSP1 in T cells regulates the growth of B16 melanoma by modulating T cell infiltration. LSP1 shows potential as a viable target for T cell-based immunotherapy [Citation45].
Microsomal glutathione S-transferase 1 (MGST1) is a transferase enzyme that is bound to the endoplasmic reticulum plasma membrane, mitochondria, and peroxisome [Citation46,Citation47]. Recent studies have demonstrated the involvement of MGST1 in cell death process, particularly in ferroptosis [Citation48,Citation49]. In the context of pancreatic cancer cells, MGST1 was found to be upregulated during ferroptosis and exhibited a negative regulatory effect on this process. Specially, MGST1 prevented ferroptosis by inhibiting the activity of ALOX5 and subsequent lipid peroxidation [Citation49]. Additionally, elevated expression of MGST1 had been linked to decreased survival rates in pancreatic adenocarcinoma (PDAC) patients [Citation49]. Furthermore, increased MGST1 expression had been correlated with unfavorable outcomes in gastric cancer and the inhibition of ferroptosis through the Wnt/ β-Catenin pathway [Citation50]. In contrast to other solid tumors, MGST1 may have a distinct role in AML. Our study revealed that heightened MGST1 expression is associated with prolonged survival in AML patients. However, further investigation is required to elucidate the underlying mechanisms. Plexin-B1, encoded by PLXNB1, is also of interest in this context. It has been shown in some clinical studies that low Plexin-B1 expression had been linked to high histological grade and poor outcome of disease-free survival in estrogen receptor positive breast cancers [Citation51,Citation52]. In renal cell carcinomas, Plexin-B1 expression is down-regulated. PLXNB1WT was found to decrease the invasion of tumor cells into the prostate stroma, whereas its P157L mutation dramatically increased the invasion [Citation53]. In our analysis, Plexin-B1 overexpression predicted favorable outcome, which suggested a tumor-suppressor role of Plexin-B1 in oncogenesis as others reported. A wide range of non-immune cell express plexin B1 as the SEMA4D high affinity receptor in human, which corresponds to the analysis we performed ((E)). Monocytic and B-cell migration is inhibited by SEMA4D via Plexin-B1 [Citation54,Citation55]. It is crucial for the inhibitory effect of Plexin-B1 to occur during the maturation of monocytes into immature dendritic cells. Depending on SEMA4D concentration, cytokine production is modulated toward either an anti-inflammatory or a pro-inflammatory cytokine profile [Citation55,Citation56]. However, the overexpression of Plexin-B1 was found to be predictive of favorable outcomes in our analysis.
Researchers have found that exosomes secreted by BM-derived cells or other tumor cells modulate the microenvironment by secreting cytokines. CML cells release exosomes that stimulate BMSCs to produce interleukin-8 (IL-8) that enhances the maligant properties of the cells [Citation57]. In our study, the KEGG and GO analyses demonstrated the high-risk model signficantly correlated with ‘cytokine-cytokine receptor interaction’ and ‘positive regulation of cytokine production’, respectively ((B,D)), which indicated that the patients with AML may produce more cytokines in high risk model that, in turn, regulated the microenvironment and promoted the AML progression. Xufeng Chen et al. find that some cancers, such as AML, fails to work or develop resistance to immune-checkpoint blockade for abnormal major histocompatibility complex class I (MHC-1) antigen presentation (AP) of evading T cell immunity [Citation58]. Based on KEGG and GO analysis, patients in high-risk group were associated with ‘antigen processing and presentation’ and ‘antigen processing and presentation of exogenous antigen’, ‘MHC class I receptor activity’, respectively ((B,D)), implying immuotherapy may not be beneficial to these patients with AML. Meanwhile, GO analysis showed that patients in high-risk group were enriched in ‘leukocyte mediated immunity’, ‘negative regulation of immune system process’, ‘immune response-regulating signaling pathway’ ((D)), which can be inferred that the five immune-ERGs potentially exert an influence on the transportation of peptides or other related factors through exosomes, thereby promoting the malignant progression of AML.
Furthermore, the high-risk group exhibited elevated immune, estimate, and stroma scores. Additionally, the analysis of immune cell composition revealed a correlation between the high-risk group and monocytes, whereas the low-risk group showed an associated with resting mast cells and activated dendritic cells. Moreover, there was a positive correlation observed between the high-risk group and the infiltration of CD8+ T cells ((E)), as well as the expression of immune checkpoints, particularly CD274 and CTLA4 (). This suggests that patients with high-risk AML may greatly benefit from immunotherapy. In future investigations, it is imperative to explore the impact of these five ERGs on immune cell infiltrations and anti-tumor immunity. We have successfully developed a prognostic prediction model for AML patients based on immune and exosome-related genes, and our findings demonstrate a significant association between the risk score derived from these genes and immune cell infiltrations.
Conclusion
Our study successfully established a prognostic prediction model for AML patients using a signature comprised of immune-exosome-related genes. Furthermore, we demonstrated a significant correlation between the risk score derived from these genes and immune cell infiltrations. Consequently, these five hub genes hold promise as potential targets for personalized therapeutic interventions in AML patients.
3. supplement files, 23.11.19.docx
Download MS Word (14.3 KB)Acknowledgements
We thank the participants who provided data in TCGA databases. In addtion, we thank Dr. Changrui Qian (Wenzhou Medical University, Wenzou, China) for analytical guidance. Study design: All authors; Formal analysis: ZF, JF, XC; Data interpretation: All authors; Manuscript writing and editing: All authors; All authors read and approved the final manuscript.
Disclosure statement
No potential conflict of interest was reported by the author(s).
Data availability statement
Datasets presented in this study are available in online repositories, and the article identifies the repository/repositories and accession number(s).
Additional information
Funding
References
- Jayavelu AK, Wolf S, Buettner F, et al. The proteogenomic subtypes of acute myeloid leukemia. Cancer Cell. 2022;40(3):301–317 e12. doi:10.1016/j.ccell.2022.02.006
- Guieze R, Liu VM, Rosebrock D, et al. Mitochondrial reprogramming underlies resistance to BCL-2 inhibition in lymphoid malignancies. Cancer Cell. 2019;36(4):369–384 e13. doi:10.1016/j.ccell.2019.08.005
- Baryawno N, Przybylski D, Kowalczyk MS, et al. A cellular taxonomy of the bone marrow stroma in homeostasis and leukemia. Cell. 2019;177(7):1915–1932 e16. doi:10.1016/j.cell.2019.04.040
- Han L, Xu J, Xu Q, et al. Extracellular vesicles in the tumor microenvironment: therapeutic resistance, clinical biomarkers, and targeting strategies. Med Res Rev. 2017;37(6):1318–1349. doi:10.1002/med.21453
- Park HS, Cetin E, Siblini H, et al. Therapeutic potential of mesenchymal stem cell-derived extracellular vesicles to treat PCOS. Int J Mol Sci. 2023;24(13):11151. doi:10.3390/ijms241311151
- Malekpour K, Hazrati A, Zahar M, et al. The potential use of mesenchymal stem cells and their derived exosomes for orthopedic diseases treatment. Stem Cell Rev Rep. 2022;18(3):933–951. doi:10.1007/s12015-021-10185-z
- Guo W, Gao Y, Li N, et al. Exosomes: new players in cancer (review). Oncol Rep. 2017;38(2):665–675. doi:10.3892/or.2017.5714
- Kumar B, Garcia M, Murakami JL, et al. Exosome-mediated microenvironment dysregulation in leukemia. Biochim Biophys Acta. 2016;1863(3):464–470. doi:10.1016/j.bbamcr.2015.09.017
- Amin AH, Sharifi LMA, Kakhharov AJ, et al. Role of acute myeloid leukemia (AML)-derived exosomes in tumor progression and survival. Biomed Pharmacother. 2022;150:113009. doi:10.1016/j.biopha.2022.113009
- Wojtuszkiewicz A, Schuurhuis GJ, Kessler FL, et al. Exosomes secreted by apoptosis-resistant acute myeloid leukemia (AML) blasts harbor regulatory network proteins potentially involved in antagonism of apoptosis. Mol Cell Proteomics. 2016;15(4):1281–1298. doi:10.1074/mcp.M115.052944
- Farooqi AA, Desai NN, Qureshi MZ, et al. Exosome biogenesis, bioactivities and functions as new delivery systems of natural compounds. Biotechnol Adv. 2018;36(1):328–334. doi:10.1016/j.biotechadv.2017.12.010
- Chitadze G, Bhat J, Lettau M, et al. Generation of soluble NKG2D ligands: proteolytic cleavage, exosome secretion and functional implications. Scand J Immunol. 2013;78(2):120–129. doi:10.1111/sji.12072
- Bobrie A, Colombo M, Raposo G, et al. Exosome secretion: molecular mechanisms and roles in immune responses. Traffic. 2011;12(12):1659–1668. doi:10.1111/j.1600-0854.2011.01225.x
- Szajnik M, Czystowska M, Szczepanski MJ, et al. Tumor-derived microvesicles induce, expand and up-regulate biological activities of human regulatory T cells (Treg). PLoS One. 2010;5(7):e11469. doi:10.1371/journal.pone.0011469
- Valenti R, Huber V, Filipazzi P, et al. Human tumor-released microvesicles promote the differentiation of myeloid cells with transforming growth factor-beta-mediated suppressive activity on T lymphocytes. Cancer Res. 2006;66(18):9290–9298. doi:10.1158/0008-5472.CAN-06-1819
- Wang J, Sun X, Zhao J, et al. Exosomes: a novel strategy for treatment and prevention of diseases. Front Pharmacol. 2017;8:300. doi:10.3389/fphar.2017.00300
- Wang J, De Veirman K, De Beule N, et al. The bone marrow microenvironment enhances multiple myeloma progression by exosome-mediated activation of myeloid-derived suppressor cells. Oncotarget. 2015;6(41):43992–44004. doi:10.18632/oncotarget.6083
- Lee CH, Bae JH, Choe EJ, et al. Macitentan improves antitumor immune responses by inhibiting the secretion of tumor-derived extracellular vesicle PD-L1. Theranostics. 2022;12(5):1971–1987. doi:10.7150/thno.68864
- Liu J, Lichtenberg T, Hoadley KA, et al. An integrated TCGA pan-cancer clinical data resource to drive high-quality survival outcome analytics. Cell. 2018;173(2):400–416 e11. doi:10.1016/j.cell.2018.02.052
- Pathan M, Fonseka P, Chitti SV, et al. Vesiclepedia 2019: a compendium of RNA, proteins, lipids and metabolites in extracellular vesicles. Nucleic Acids Res. 2019;47(D1):D516–D519. doi:10.1093/nar/gky1029
- Kalra H, Simpson RJ, Ji H, et al. Vesiclepedia: a compendium for extracellular vesicles with continuous community annotation. PLoS Biol. 2012;10(12):e1001450. doi:10.1371/journal.pbio.1001450
- van Galen P, Hovestadt V, Wadsworth Ii MH, et al. Single-cell RNA-seq reveals AML hierarchies relevant to disease progression and immunity. Cell. 2019;176(6):1265–1281 e24. doi:10.1016/j.cell.2019.01.031
- Wang H, Lengerich BJ, Aragam B, et al. Precision LASSO: accounting for correlations and linear dependencies in high-dimensional genomic data. Bioinformatics. 2019;35(7):1181–1187. doi:10.1093/bioinformatics/bty750
- Zou J, Wang E. Cancer biomarker discovery for precision medicine: new progress. Curr Med Chem. 2019;26(42):7655–7671. doi:10.2174/0929867325666180718164712
- Taniguchi N, Kizuka Y. Glycans and cancer: role of N-glycans in cancer biomarker, progression and metastasis, and therapeutics. Adv Cancer Res. 2015;126:11–51. doi:10.1016/bs.acr.2014.11.001
- Zhang J, Li S, Li L, et al. Exosome and exosomal microRNA: trafficking, sorting, and function. Genomics Proteomics Bioinformatics. 2015;13(1):17–24. doi:10.1016/j.gpb.2015.02.001
- Andreu Z, Yanez-Mo M. Tetraspanins in extracellular vesicle formation and function. Front Immunol. 2014;5:442. doi:10.3389/fimmu.2014.00442
- Escola JM, Kleijmeer MJ, Stoorvogel W, et al. Selective enrichment of tetraspan proteins on the internal vesicles of multivesicular endosomes and on exosomes secreted by human B-lymphocytes. J Biol Chem. 1998;273(32):20121–7. doi:10.1074/jbc.273.32.20121
- Schwartz-Albiez R, Dorken B, Hofmann W, et al. The B cell-associated CD37 antigen (gp40-52). Structure and subcellular expression of an extensively glycosylated glycoprotein. J Immunol. 1988;140(3):905–914. doi:10.4049/jimmunol.140.3.905
- van Spriel AB, Puls KL, Sofi M, et al. A regulatory role for CD37 in T cell proliferation. J Immunol. 2004;172(5):2953–2961. doi:10.4049/jimmunol.172.5.2953
- van Spriel AB. Tetraspanins in the humoral immune response. Biochem Soc Trans. 2011;39(2):512–517. doi:10.1042/BST0390512
- Knobeloch KP, Wright MD, Ochsenbein AF, et al. Targeted inactivation of the tetraspanin CD37 impairs T-cell-dependent B-cell response under suboptimal costimulatory conditions. Mol Cell Biol. 2000;20(15):5363–5369. doi:10.1128/MCB.20.15.5363-5369.2000
- van Spriel AB, Sofi M, Gartlan KH, et al. The tetraspanin protein CD37 regulates IgA responses and anti-fungal immunity. PLoS Pathog. 2009;5(3):e1000338. doi:10.1371/journal.ppat.1000338
- Link MP, Bindl J, Meeker TC, et al. A unique antigen on mature B cells defined by a monoclonal antibody. J Immunol. 1986;137(9):3013–3018. doi:10.4049/jimmunol.137.9.3013
- Beckwith KA, Frissora FW, Stefanovski MR, et al. The CD37-targeted antibody-drug conjugate IMGN529 is highly active against human CLL and in a novel CD37 transgenic murine leukemia model. Leukemia. 2014;28(7):1501–1510. doi:10.1038/leu.2014.32
- Zhang Q, Han Q, Zi J, et al. Cd37 high expression as a potential biomarker and association with poor outcome in acute myeloid leukemia. Biosci Rep. 2020;40(5):BSR20200008. doi:10.1042/BSR20200008
- Lapalombella R, Yeh YY, Wang L, et al. Tetraspanin CD37 directly mediates transduction of survival and apoptotic signals. Cancer Cell. 2012;21(5):694–708. doi:10.1016/j.ccr.2012.03.040
- Oksvold MP, Kullmann A, Forfang L, et al. Expression of B-cell surface antigens in subpopulations of exosomes released from B-cell lymphoma cells. Clin Ther. 2014;36(6):847–862 e1. doi:10.1016/j.clinthera.2014.05.010
- Oh IS, Shimizu H, Satoh T, et al. Identification of nesfatin-1 as a satiety molecule in the hypothalamus. Nature. 2006;443(7112):709–712. doi:10.1038/nature05162
- Schalla MA, Unniappan S, Lambrecht NWG, et al. Nucb2/Nesfatin-1 – inhibitory effects on food intake, body weight and metabolism. Peptides. 2020;128:170308. doi:10.1016/j.peptides.2020.170308
- Ning S, Liu C, Wang K, et al. Nucb2/Nesfatin-1 drives breast cancer metastasis through the up-regulation of cholesterol synthesis via the mTORC1 pathway. J Transl Med. 2023;21(1):362. doi:10.1186/s12967-023-04236-x
- Ren L, Bao D, Wang L, et al. Nucleobindin-2/Nesfatin-1 enhances the cell proliferation, migration, invasion and epithelial-mesenchymal transition in gastric carcinoma. J Cell Mol Med. 2022;26(19):4986–4994. doi:10.1111/jcmm.17522
- Chen J, Xiao Q, Li X, et al. The correlation of leukocyte-specific protein 1 (LSP1) rs3817198(T > C) polymorphism with breast cancer: a meta-analysis. Medicine. 2022;101(45):e31548. doi:10.1097/MD.0000000000031548
- Koral K, Bhushan B, Orr A, et al. Lymphocyte-specific protein-1 suppresses xenobiotic-induced constitutive androstane receptor and subsequent yes-associated protein-activated hepatocyte proliferation. Am J Pathol. 2022;192(6):887–903. doi:10.1016/j.ajpath.2022.03.010
- Kwon R, Hong BK, Lee KG, et al. Regulation of tumor growth by leukocyte-specific protein 1 in T cells. J Immunother Cancer. 2020;8(2):e001180. doi:10.1136/jitc-2020-001180
- Kelner MJ, Bagnell RD, Montoya MA, et al. Structural organization of the microsomal glutathione S-transferase gene (MGST1) on chromosome 12p13.1–13.2. Identification of the correct promoter region and demonstration of transcriptional regulation in response to oxidative stress. J Biol Chem. 2000;275(17):13000–13006. doi:10.1074/jbc.275.17.13000
- Morgenstern R, Zhang J, Johansson K. Microsomal glutathione transferase 1: mechanism and functional roles. Drug Metab Rev. 2011;43(2):300–306. doi:10.3109/03602532.2011.558511
- Zeng B, Ge C, Li R, et al. Knockdown of microsomal glutathione S-transferase 1 inhibits lung adenocarcinoma cell proliferation and induces apoptosis. Biomed Pharmacother. 2020;121:109562. doi:10.1016/j.biopha.2019.109562
- Kuang F, Liu J, Xie Y, et al. Mgst1 is a redox-sensitive repressor of ferroptosis in pancreatic cancer cells. Cell Chem Biol. 2021;28(6):765–775 e5. doi:10.1016/j.chembiol.2021.01.006
- Li Y, Xu X, Wang X, et al. Mgst1 expression is associated with poor prognosis, enhancing the Wnt/beta-catenin pathway via regulating AKT and inhibiting ferroptosis in gastric cancer. ACS Omega. 2023;8(26):23683–23694. doi:10.1021/acsomega.3c01782
- Rody A, Karn T, Ruckhaberle E, et al. Loss of plexin B1 is highly prognostic in low proliferating ER positive breast cancers–results of a large scale microarray analysis. Eur J Cancer. 2009;45(3):405–413. doi:10.1016/j.ejca.2008.10.016
- Rody A, Holtrich U, Gaetje R, et al. Poor outcome in estrogen receptor-positive breast cancers predicted by loss of plexin B1. Clin Cancer Res. 2007;13(4):1115–1122. doi:10.1158/1078-0432.CCR-06-2433
- Shorning B, Trent N, Griffiths DF, et al. Plexin-B1 mutation drives metastasis in prostate cancer mouse models. Cancer Res Commun. 2023;3(3):444–458. doi:10.1158/2767-9764.CRC-22-0480
- Delaire S, Billard C, Tordjman R, et al. Biological activity of soluble CD100. II. Soluble CD100, similarly to H-SemaIII, inhibits immune cell migration. J Immunol. 2001;166(7):4348–4354. doi:10.4049/jimmunol.166.7.4348
- Chabbert-de Ponnat I, Marie-Cardine A, Pasterkamp RJ, et al. Soluble CD100 functions on human monocytes and immature dendritic cells require plexin C1 and plexin B1, respectively. Int Immunol. 2005;17(4):439–447. doi:10.1093/intimm/dxh224
- Ishida I, Kumanogoh A, Suzuki K, et al. Involvement of CD100, a lymphocyte semaphorin, in the activation of the human immune system via CD72: implications for the regulation of immune and inflammatory responses. Int Immunol. 2003;15(8):1027–1034. doi:10.1093/intimm/dxg098
- Corrado C, Raimondo S, Saieva L, et al. Exosome-mediated crosstalk between chronic myelogenous leukemia cells and human bone marrow stromal cells triggers an interleukin 8-dependent survival of leukemia cells. Cancer Lett. 2014;348(1–2):71–76. doi:10.1016/j.canlet.2014.03.009
- Chen X, Lu Q, Zhou H, et al. A membrane-associated MHC-I inhibitory axis for cancer immune evasion. Cell. 2023;186(18):3903–3920 e21. doi:10.1016/j.cell.2023.07.016