
ABSTRACT
Objectives
Immune thrombocytopenia (ITP) is an autoimmune bleeding disorder caused by increased platelet destruction and altered production. Despite the well-described pathophysiological background of immune dysregulation, current treatment guidelines consist of monotherapy with different drugs, with no tool to predict which patient is more suitable for each therapeutic modality.
Methods
In our study, we attempted to determine differences in the immune setting, comparing the patients’ responses to administered therapy. During 12-month follow-up, we assessed blood count, antiplatelet autoantibodies, and T lymphocyte subsets in peripheral blood in 35 patients with ITP (newly diagnosed or relapsed disease).
Results
Our data show that the value of antiplatelet autoantibodies, the percentage of cytotoxic T lymphocytes, and the immunoregulatory index (IRI, CD4+ / CD8+ T cell ratio) differ significantly by treatment response. Responders have a higher IRI (median 2.1 vs. 1.5 in non-responders, P = 0.04), higher antiplatelet autoantibodies (median 58 vs. 20% in non-responders, P = 0.01) and lower relative CD8+ T cells count (P = 0.02) before treatment.
Discussion
The results suggest that immunological parameters (antiplatelet autoantibodies, relative CD8+ T cell count and IRI) could be used as prognostic tools for a worse clinical outcome in patients with ITP.
Conclusion
These biomarkers could be utilized for stratification and eventually selection of treatment preferring combination therapy.
Introduction
Immune thrombocytopenia (ITP) is a hematologic autoimmune disease manifested by bleeding with a laboratory finding of a reduced platelet count (PLT) below 100 × 109 /L [Citation1]. ITP usually presents with a skin or mucous bleeding and fatigue; life-threatening bleeding occurs rarely.
The traditional pathophysiological background is a predominantly increased platelet destruction in the reticuloendothelial system after opsonization by autoantibodies against surface glycoproteins and inadequate bone marrow production caused by antibodies against megakaryocytes. In the context of new findings, the mechanism of the disease is much more complex. In addition to humoral immunity, cellular immunity dysregulations are described, specifically increased Th1 activity versus Th2 response, the predominance of Th17 lymphocytes, and the reduction of the number of peripheral regulatory T lymphocytes (Tregs) [Citation2].
Although most patients do not experience severe bleeding episodes, disease activity, particularly fatigue, can significantly worsen their quality of life and cause work disability. Therefore, ITP treatment should not only normalize platelet count but also mitigate constitutional symptoms.
Unfortunately, the therapeutic effect of current first-line treatment (corticosteroids, intravenous immunoglobulins – IVIG) is ineffective in maintaining remission after 1 year in approximately 75% of patients [Citation3]. Subsequent treatment lines consist of monotherapies with agents chosen due to the preference and experience of a particular clinician [Citation1]. With the duration of the disease, the persistent imbalance of the immune mechanism influences the number of autoreactive B cells, the diversity of autoantibody epitopes, its ability to induce phagocytosis, etc. [Citation3]. The description of changes in the setting of chronic immune response elucidates why agents that are usually used for second-line treatment show a higher rate of long-term remission when used in the early stage of the disease [Citation4, Citation5].
Taking into account the involvement of multiple immune mechanisms, the combination of different therapeutic agents increases susceptibility to achieve deep and long-lasting remission with the highest potential in the early stage of ITP [Citation6, Citation7]. On the other hand, combination therapy can potentially lead to increased toxicity [Citation8], so it is necessary to select patients who would benefit from a more aggressive approach.
In medical practice, it is difficult to predict which patient is suitable for which treatment, as there are no clear recommendations or appropriate laboratory diagnostics. In our study, we evaluated laboratory parameters in patients with ITP with the aim of identifying a prognostic marker for a poor response leading to chronicity and/or refractoriness to treatment. These patients could eventually benefit from early combination therapies.
Study design
This is a prospective observational study. Patient data were collected at least four times during follow-up; at the time of enrolment and then after 3, 6 and 12 months. At each time point, we evaluated the complete blood count with differential, immature platelet fraction (IPF), and reticulocytes. The subpopulation of T lymphocytes in peripheral blood and the presence of antiplatelet autoantibodies by flow cytometry was assessed at the time of enrolment.
This study was carried out according to the principles of the Declaration of Helsinki. The approval was granted by the Ethics Committee of the University Hospital in Hradec Králové, (IORG0008813, approval ID 202109-P08). All patients signed their informed consent prior to enrolment.
Patients and methods
Patients
35 adult patients with primary ITP (newly diagnosed or relapsed) who required treatment were included in the database of the 4th Department of Internal Medicine – Hematology of the University Hospital in Hradec Králové between April 2020 and June 2022. Basic descriptive data are included in . At the time of enrolment, 17 patients (49%) presented bleeding symptoms, mostly skin and mucosa, 1 patient complained of gastrointestinal bleeding, and 1 patient developed a subdural haemorrhage. In their personal history, 4 patients (11%) had another autoimmune disorder (Hashimoto’s disease, asthma bronchiale), 26% of the patients had a family history positive for autoimmune disorders (Hashimoto’s disease, asthma bronchiale, coeliac disease). Secondary aetiology of ITP was excluded by thorough clinicians’ examination, differential blood count and basic biochemical serum analysis. Further tests were carried out individually: infection assessment (hepatitis A, B, C, HIV, Helicobacter pylori), rheumatologic autoantibodies screening (antinuclear antibodies, anti-ENA – extractable nuclear antigen antibodies, rheumatoid factor), bone marrow aspiration (in older patients).
Table 1. Patient characteristics.
Each patient underwent at least four outpatient visits with analysis of blood samples at 0, 3, 6 and 12 months during follow-up. Regarding the minority of newly diagnosed patients in our set, a broad spectrum of therapeutic options was then used, most of the patients received a combination of more therapeutic agents due to the former guidelines; specifically, corticosteroids, thrombopoietin receptor agonists (TPO-RA), rituximab, cyclophosphamide, cyclosporin, mycophenolate mofetil, vincristine, or tacrolimus. In relapsed patients, previous treatment lines consisted of corticosteroids, rituximab, and TPO-RA.
Materials and methods
BD Vacutainer® collection tubes (Franklin Lakes, NJ, USA) with sodium heparin (spray coated) were used for blood collection. Fifty µL of anticoagulated blood were added to the DURActive 1 tube (Beckman Coulter, Miami, FL, USA). containing Phorbol 12-myristate 13 acetate (PMA), Streptomyces conglobatus ionomycin calcium salt and Brefeldin A. Cell activation took place for three hours in an incubator at a temperature of 37 ° C and a CO2 level of 5%. After incubation, cells were surface and intracellularly labelled using DURAClone IF T Helper Cell tubes (Beckman Coulter) containing antibodies against IFN-γ conjugated with fluorescein isothiocyanate (FITC), clone: 45.15; IL-4 conjugated with phycoerythrin-cyanin 7 (PC7), clone: MP4-25D2; CD3 conjugated with allophycocyanin-Alexa Fluor 750 (APC-AlexaFluor 750), clone: UCHT1; CD4 conjugated with allophycocyanin (APC), clone 13B8.2; IL-17A conjugated with Pacific blue (PB), clone: BL168; together with CD8 conjugated with phycoerythrin-Texas Red -x (ECD), clone: B9.11 and CD45 conjugated with krome orange (KO), clone: J33. Sample preparation was performed according to the manufacturer's instructions. The flow cytometric evaluation was performed with a Navios 10 flow cytometer (Beckman Coulter). All data were then analyzed using the Kaluza C 1.1 Analysis Software (Beckman Coulter) by an experienced analyst. Data for a minimum of 50,000 events were obtained for each staining and supplied as a list mode.
Analyzed populations and gating strategies
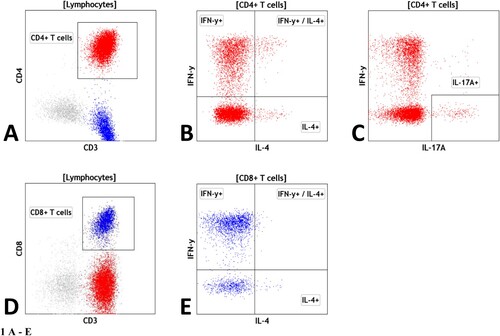
Using multicolour flow cytometry, the authors determined relative and absolute numbers of lymphocytes, T cells, and their subpopulations: CD4 + helper T cells (including IFN-γ+/CD4+ T cells, IL-4+/CD4+ T cells, IFN-γ+/IL-4+/CD4+ T cells and IL-17A+/CD4+ T cells), CD8 + cytotoxic T cells (including IFN-γ+/CD8+ T cells, IL-4+/CD8+ T cells and IFN-γ+/IL-4+/CD8+ T cells) and ratio of CD4 + / CD8+ T cells.
The gating strategies for the different subsets were as follows: Lymphocytes: low SSC/CD45++, T cells were detected as CD45+/CD3 + cells, CD3+/CD4 + are helper T cells, CD3+/CD8 + are cytotoxic T cells. The expression of IFN-γ, IL-4 and IL-17A was further evaluated within CD4 + helper T cells and CD8 + cytotoxic T cells ().
Figure 1. Legend: Gating strategy for T cell analysis: (A) helper CD4+ T cells as CD3+/CD4+ T cells; (B) IFNγ+, IL-4 + and IFNγ+/IL-4+ CD4+ T cells within CD4+ T cells; (C) IL-17a + CD4+ T cells within CD4+ T cells; (D) cytotoxic CD8+ T cells as CD3+/CD8+ T cells; (E) IFNγ+, IL-4 + and IFNγ+/IL-4+ CD8+ T cells within CD8+ T cells
Antiplatelet antibody detection
Antiplatelet antibodies were detected using a ThromboStep diagnostic kit (Immunostep, Salamanca, Spain) designed to quantify platelet associated immunoglobulin using flow cytometry. Sample preparation and measurements were performed according to the manufacturer's instructions. Platelets were detected as CD42a positive elements. All measurements were made on a Navios 10 flow cytometer (Beckman Coulter) with the appropriate settings. The test enables the determination of antibodies in the IgG, IgM, and IgA classes and the total antibody load regardless of the class. The test is not able to distinguish a specific target of the autoantibody. All data were analyzed using Kaluza C 1.1 analysis software (Beckman Coulter) by an experienced analyst. The results are displayed as a percentage of positive platelets from total platelets. The positivity threshold was established at 20%.
Response and follow-up
Based on platelet counts at 6 and 12 months, these patients were divided into the group PLT < 100 × 109 / L group (N = 14) and PLT ≥ 100 x109 / L (N = 21). During follow-up discontinuation of therapy was possible in 12 patients after 6 months (3 patients classified as responders received a combination of immunosuppressants with gradual withdrawal, without TPO receptor agonist therapy), after 12 months 14 responders sustained remission without therapy – more details listed in . After 12 months, 2 patients previously classified as a responder lost their treatment response and on the contrary, 2 patients from nonresponders achieved PLT count above 100 x109 / L.
Table 2. Treatment discontinuation during follow-up: after 6 and 12 months, respectively.
Statistical analysis
Statistical analysis and graphs were performed using statistical software GraphPad Prism 9.4.1, Boston, Massachusetts, US. For the description of the relationship, each value in our data correlation was determined, for comparison of patient subgroups we performed the t-test or the Mann-Whitney test based on the normality of the data. P values <0.05 were considered significant. All P values were two-tailed. The receiver operating characteristic (ROC) curve was used to determine an optimum cut-off point for the immunoregulatory index (IRI) and antiplatelet autoantibodies.
Results
Based on response to therapy according to platelet count at 6 and 12 months, we divided our patients into two groups – nonresponders (NR) with achieved PLT < 100 × 109 /L and responders (R) with PLT ≥ 100 × 109 /L. Then, according to the response at 6 and 12 months, we analyze the following parameters achieved at the time of enrolment. After 6 months of follow-up, there were no statistically significant differences in age, hemoglobin, MCV, thrombocytes, IPF %, white blood cells in total, neutrophils in %, monocytes in % and lymphocytes in % at the time of enrolment between the R (N = 21) and NR group (N = 14).
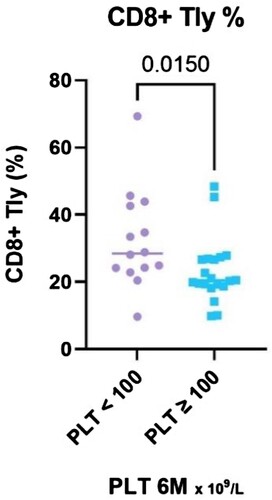
The evaluation of lymphocyte subpopulations showed a difference between NR and R in several parameters. The percentage of CD8+ T cells (calculated as a percentage of lymphocyte count) was significantly higher in non-responders (P = 0.015, median 29% [IQR 23.8–42.9] vs 20% [IQR 18.8–26.8]) (). The same trend was apparent in the absolute CD8+ T cells count, although not statistically significant (P = 0.197) and in IFN-γ+/CD8+ T cells (P = 0.08).
Figure 2. Legend: The results of CD8+ T lymphocytes (%) stratified with respect to platelet count achieved at the 6-month time point, divided into two groups – PLT ≥ 100 and PLT < 100 × 109 /L.
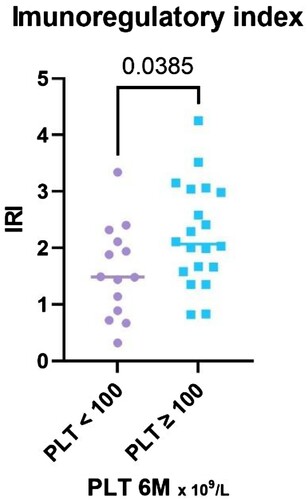
The ratio of CD4 + to CD8+ T cells (IRI) was significantly higher in the response group (P = 0.04), median 2.1, (IQR 1.60–3.03) vs. median 1.5 in nonresponders (IQR 0.85–2.16) ().
Figure 3. Legend: The results of IRI stratified with respect to platelet count achieved at the 6-month time point, divided into two groups – PLT ≥ 100 and PLT < 100 × 109 /L.
There was no significant difference between R and NR in the percentage of IL-4 + producing CD4 + or CD8+ T cells, IFN-γ+/IL-4+/CD4 + or CD8+ T cells, in IL-17A producing CD4+ T cells and IFN-γ producing CD4+ T cells ().
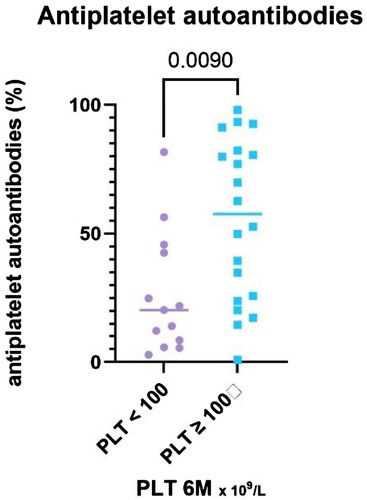
The patients in the responder group had significantly higher total antiplatelet autoantibodies value (P = 0.01, median 58%, IQR 24.3–81.9%) compared to NR (median 20%, IQR 7.2–44.1%) ().
Figure 4. Legend: The results of antiplatelet autoantibodies (%) stratified with respect to platelet count achieved at the 6-month time point, divided into two groups – PLT ≥ 100 and PLT < 100 × 109 /L.
The results 12 months after enrolment in the study showed similar findings.
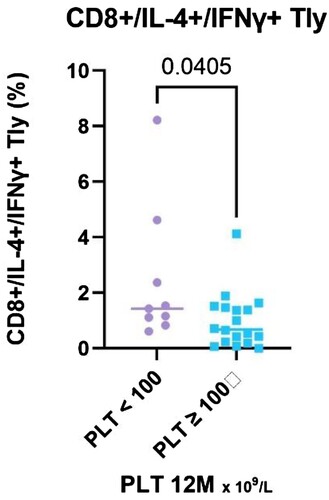
Comparing responders (N = 21) and nonresponders (N = 14), the CD8 + T cells relative count increased significantly (P = 0.019, median 27.99% in NR, IQR 23.9–36.7%,vs 20.4% in R, IQR 18.8–26.6%), both relative and absolute count of CD8+ / IL-4+ / IFN-γ+ T cells was significantly higher in NR (P = 0.04, median 1.43 vs. 0.68% in R, IQR 1.0–3.5% vs. 0.2–1.5%; P = 0.005, median 0.09 vs. 0.03 × 10⁹ /L in R, IQR 0.08–0.42 vs. 0.01–0.07) ( and ).
Figure 5. The results of CD8+ T lymphocytes (%) stratified with respect to platelet count achieved at the 12-month time point, divided into two groups – PLT ≥ 100 and PLT < 100 × 109 /L.
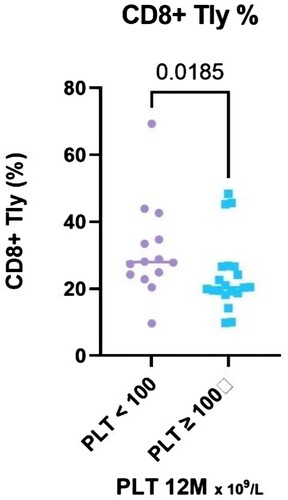
Figure 6. The results of CD8+/IL-4+/IFN-γ+ T lymphocytes (%) stratified with respect to platelet count achieved at the 12-month time point, divided into two groups – PLT ≥ 100 and PLT < 100 × 109 /L.
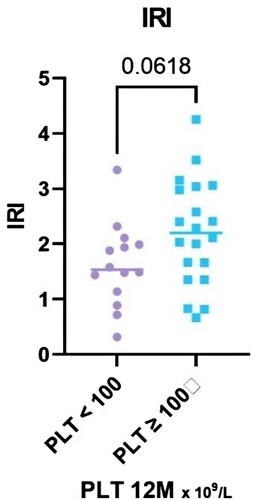
The immunoregulatory index shows a difference between R and NR, although not statistically significant (P = 0.062, median 2.2 in R, IQR 1.4–3.0; vs median 1.55 in NR, IQR 1.1–2.0) (). Absolute CD8+ IFN-γ+ T cells count and absolute CD8+ T cells count in total stand close to the borderline of statistical significance limit (P = 0.06, P = 0.07).
Figure 7. The results of IRI stratified with respect to platelet count achieved at the 12-month time point, divided into two groups – PLT ≥ 100 and PLT < 100 × 109 /L.
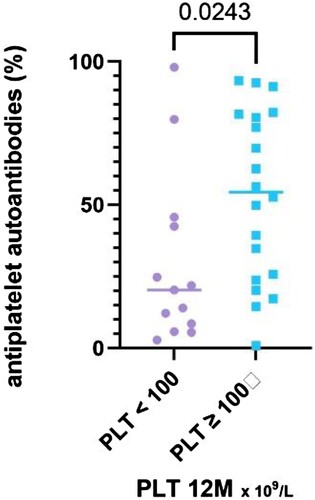
There was a significant difference in the total autoantibody value (P = 0.035, median 54% in the the R, IQR 24.3–81.4%, vs. 20.3% in NR group, IQR 7.2–44.1%) ().
Figure 8. The results of antiplatelet autoantibodies (%) stratified with respect to platelet count achieved at the 12-month time point, divided into two groups – PLT ≥ 100 and PLT < 100 × 109 /L.
No significant difference was found in other subpopulations of T cells (). Based on the duration of the disease, the responders tend to have a shorter disease history, although the difference is not statistically significant (P = 0.144, median 0.4 [IQR 0.2–9.5] vs. 5.5 years [IQR 0.5–9.3]), a similar trend was observed in the number of therapy lines (P = 0.069, median 2.5 in NR vs. 2 in R, IQR 2.0–6.3 vs. 1.5–3.5).
Table 3. Summary of statistical analysis of our data: Comparison with use of the T – test or Mann – Whitney test according to normality of the analyzed data comparing patients divided into two groups, responders (PLT ≥ 100 × 109 /L) and nonresponders (PLT < 100 × 109/L).
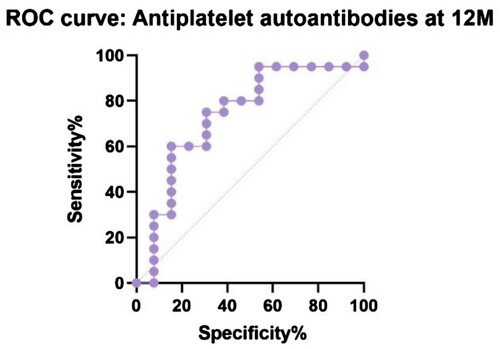
shows the receiver operating characteristic (ROC) curve comparing IRI in R and NR at 12 months (P = 0.06, area under curve – AUC – 0.69, CI 95% 0.51 to 0.83). Our suggested cut-off value could be 2.2 with 50% sensitivity (CI 95% 30–70.1%) and 86% specificity (CI 95% 60.1–97.5%) to distinguish responders, a group of patients for whom an aggressive treatment approach would not be beneficial. The same analysis was performed comparing antiplatelet autoantibodies in R and NR at 12 months (P = 0.02, AUC 0.73, CI 95% 0.55–0.92) with a possible lower threshold at 47.8% with 60% sensitivity (CI 95% 38.7–78.1%) and 85% specificity (CI 95% 57.8–97.3%) ().
Figure 9. Receiver operating characteristic (ROC) curve comparing responders (PLT ≥ 100 × 109/L) and nonresponders (PLT < 100 × 109/L) at 12 months, comparing IRI (P = 0.06).
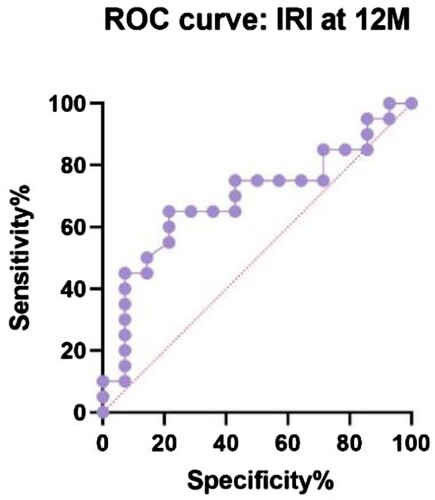
Figure 10. Receiver operating characteristic (ROC) curve comparing responders (PLT ≥ 100 × 109/L) and nonresponders (PLT < 100 × 109/L) at 12 months, comparing antiplatelet autoantibodies (%, P = 0.02).
Discussion
Regardless of the broad spectrum of treatment options, in some ITP patients remains difficult to achieve and maintain remission of the disease. From previously reported data, it is evident that each medication has the highest chance of long-term remission if used in the early course of the disease and in combination with other drugs (s) [Citation3, Citation9]. On the other hand, an aggressive approach could be unnecessary toxic and potentially harmful.
As other authors have suggested, in relapsed or refractory ITP, combination therapy should be considered, especially a combination of drugs targeting multiple immunological mechanisms due to complex immune dysregulation [Citation3, Citation10, Citation11]. When the first-line approach fails, the addition of another treatment modality offers a benefit over discontinuation of the ineffective drug [Citation12]. The use of a combinatory regimen in the first-line treatment line was described with promising results, although we still lack a predictive tool to avoid unnecessary aggressive combinations [Citation13].
When studying the pathogenesis of the disease, a broad spectrum of alterations in the immune response have been observed. In general, most autoimmune diseases are associated with an imbalance of the subsets of Th lymphocytes [Citation14, Citation15]. ITP patients generally have a dominance of the Th1 and Th17 subset over Th2 and Tregs. The Th1 immune response promotes cell-mediated immune mechanisms, by activating macrophages, natural killer (NK) cells, B cells and cytotoxic (CD8+) T cells by secreting specific cytokines (IL-2, IFN-γ, TNFα, etc.). The Th2 subset provides defence against multicellular parasites and plays a role in the development of allergic reactions and atopic diseases. IL-4 secretion leads to activation of B lymphocytes, their maturation into plasma cells, and a predominant production of the IgG1 and IgE antibody classes. IL-4 also suppresses the secretion of IFN-γ, TNF-α, IL-1, and other Th1 cytokines. The Th17 subset has been shown to play a critical role in ITP by stimulating B cell proliferation, maturation, and loss of tolerance with the secretion of autoantibodies. Tregs mediate the maintenance of peripheral tolerance by secreting IL-10 and TGF-β and their role is suppressed in ITP patients. In general, both the dominance and dysfunction of each subset can lead to the onset of autoimmune disease [Citation15]. Due to response to treatment, non-responders tend to have higher CD8+ T cells and lower CD4+ T cells overall, the same trend is described in relapsed patients compared to newly diagnosed patients [Citation16–18]. A significant increase in CD4 + cells has been reported in responders [Citation19]. These two parameters can be combined to form the IRI.
The decrease in IRI was associated with a significantly worse treatment response in the other studies. Patients with a lower IRI were less likely to respond to first-line therapy and showed a higher rate of relapse and a tendency to chronicity [Citation16, Citation17, Citation20]. Oka et al. described the deviation of IRI in patients who responded to first-line corticosteroids and / or IVIG treatment in the range of 0.4–2.3, while the nonresponders and the control group remained within this interval [Citation21].
The role of platelet autoantibodies has already been demonstrated in previous studies, although there is a considerable difference between the targets of autoantibodies. Autoantibodies against the IIb / IIIa glycoprotein complex indicate a better response to IVIG, corticosteroids or rituximab and do not affect the effect of TPO-RA treatment, while autoantibodies against the Ib / IX glycoprotein lead to a worse response to IVIG, TPO-RA, and splenectomy [Citation22–25]. Patients with favourable disease courses in our study had significantly higher levels of antiplatelet autoantibodies in total. This is a logical result, as B-cell depleting agents (rituximab, corticosteroids) are widely available and frequently used as a subsequent line of therapy or in combination in our clinical practice. Furthermore, as a possible further reduction in the toxicity of the treatment, studies describe a response with durable remissions after administration of a low-dose rituximab [Citation26].
In our data set of patients with primary ITP, we discovered three consistent prognostic factors for treatment-response, CD4+/CD8+ T cells ratio (IRI), CD8+ T cells relative count and antiplatelet autoantibody level before current treatment. In our study, nonresponders tend to have a lower IRI than the responders’ group, higher CD8+ T cells and lower antiplatelet autoantibodies. The suggested lower cut-off limit of IRI for predicting a good response is above 2.2 (). As a result of ROC curves (), the possible cut-off limit for antiplatelet autoantibodies could be higher than 47.8% with 60% sensitivity and 85% specificity of the favourable outcome of the treatment.
This study has several limitations. The results can be influenced by the size of the patient sample and the heterogeneity of the chosen therapeutic regimen that leads to variable treatment outcome. Furthermore, our method allowed only the quantification of antiplatelet autoantibodies without the ability to distinguish its specific glycoprotein target. On the contrary, our data provide a precise cytokine analysis using highly specific flow cytometry.
Conclusion
In conclusion, our data suggest the possibility of using immunological parameters as an auxiliary prognostic tool to determine the probability of poor response to standard therapy and the tendency toward chronicity. Using T lymphocyte subsets and autoantibody analysis prior to treatment offers the opportunity to stratify patients who are less likely to respond to treatment and to consider combination therapy in advance. Such an approach can bring cost reduction in two ways: not all patients need to be treated with combinations (responders), and a possibility of earlier treatment with increased intensity to avoid chronicity. Randomized controlled trials with extended follow-up are needed to assess the applicability of these biomarkers and to identify potential cut-off values as predictors to guide therapy, preferring the combination of medications in specific cases.
Authors’ contributions
All authors contributed to the conception and design. Material preparation, data collection, and analysis were performed by OS, KJ, LKK, and MG. The first draught of the manuscript was written by KŽ, OS and MK and all authors commented on previous versions of the manuscript. All authors read and approved the final manuscript.
Conflict of interest
KŽ, OS, KJ, LKK, MG, MAP, JD and DN have no financial and nonfinancial interests to disclose. MK received speaker and consultant honoraria from the pharmaceutical companies Novartis and Amgen.
Informed Consent
Informed consent was obtained from all subjects involved in the study.
Disclosure statement
No potential conflict of interest was reported by the author(s).
Data availability
Data supporting the findings of this study are available from the corresponding author on a reasonable request.
Additional information
Funding
References
- Neunert C, Terrell DR, Arnold DM, et al. American society of hematology 2019 guidelines for immune thrombocytopenia. Blood Advances. 2019;3:3829–3866. doi:10.1182/bloodadvances.2019000966
- Yu L, Zhang C, Zhang L, et al. Biomarkers for immune thrombocytopenia. Biomark Res. 2015;3:19. doi:10.1186/s40364-015-0045-0
- Cuker A, Prak E, Cines D. Can immune thrombocytopenia be cured with medical therapy? Semin Thromb Hemost. 2015;41:395–404. doi:10.1055/s-0034-1544001
- Lozano ML, Mingot-Castellano ME, Perera MM, et al. Deciphering predictive factors for choice of thrombopoietin receptor agonist, treatment free responses, and thrombotic events in immune thrombocytopenia. Sci Rep. 2019;9:16680. doi:10.1038/s41598-019-53209-y
- Kuter DJ, Newland A, Chong BH, et al. Romiplostim in adult patients with newly diagnosed or persistent immune thrombocytopenia (ITP) for up to 1 year and in those with chronic ITP for more than 1 year: a subgroup analysis of integrated data from completed romiplostim studies. Br J Haematol. 2019;185:503–513. doi:10.1111/bjh.15803
- Cuker A, Liebman HA. Corticosteroid overuse in adults with immune thrombocytopenia: cause for concern. Res Pract Thromb Haemost. 2021;5; doi:10.1002/rth2.12592
- Snell Taylor SJ, Nielson CM, Breskin A, et al. Effectiveness and safety of romiplostim among patients with newly diagnosed, persistent and chronic immune thrombocytopenia in European clinical practice. Adv Ther. 2021;38:2673–2688. doi:10.1007/s12325-021-01727-5
- Arnold DM, Nazi I, Santos A, et al. Combination immunosuppressant therapy for patients with chronic refractory immune thrombocytopenic purpura. Blood. 2010;115:29–31. doi:10.1182/blood-2009-06-222448
- Zaja F, Vianelli N, Battista M, et al. Earlier administration of Rituximab allows higher rate of long-lasting response in adult patients with autoimmune thrombocytopenia. Exp Hematol. 2006;34:571–572. doi:10.1016/j.exphem.2006.02.009
- Gudbrandsdottir S, Leven E, Imahiyerobo A, et al. Combination of thrombopoietin receptor agonists, immunosuppressants and intravenous immunoglobulin as treatment of severe refractory immune thrombocytopenia in adults and children. Br J Haematol. 2020;189; doi:10.1111/bjh.16426
- Mahévas M, Gerfaud-Valentin M, Moulis G, et al. Characteristics, outcome, and response to therapy of multirefractory chronic immune thrombocytopenia. Blood. 2016;128:1625–1630. doi:10.1182/blood-2016-03-704734
- Miltiadous O, Hou M, Bussel JB. Identifying and treating refractory ITP: difficulty in diagnosis and role of combination treatment. Blood. 2020;135:472–490. doi:10.1182/blood.2019003599
- Bradbury CA, Pell J, Hill Q, et al. Mycophenolate Mofetil for first-line treatment of immune thrombocytopenia. N Engl J Med. 2021;385:885–895. doi:10.1056/NEJMoa2100596
- Lin X, Xu A, Zhou L, et al. Imbalance of T lymphocyte subsets in adult immune thrombocytopenia. IJGM Volume. 2021;14:937–947. doi:10.2147/IJGM.S298888
- Raphael I, Nalawade S, Eagar TN, et al. T cell subsets and their signature cytokines in autoimmune and inflammatory diseases. Cytokine. 2015;74:5–17. doi:10.1016/j.cyto.2014.09.011
- Zhao Z, Yang L, Yang G, et al. Contributions of T lymphocyte abnormalities to therapeutic outcomes in newly diagnosed patients with immune thrombocytopenia. PLoS One. 2015;10:e0126601. doi:10.1371/journal.pone.0126601
- Zhang J, Zhang Q, Li Y, et al. Immune dysregulation in primary immune thrombocytopenia patients. Hematology. 2018;23:510–516. doi:10.1080/10245332.2018.1435021
- Rocha AMC, Souza C, Rocha GA, et al. The levels of IL-17A and of the cytokines involved in Th17 cell commitment are increased in patients with chronic immune thrombocytopenia. Haematologica. 2011;96:1560–1564. doi:10.3324/haematol.2011.046417
- Rong W, Yan-xiang Z, Shan-shan X, et al. Lymphocyte subsets in primary immune thrombocytopenia. Blood Coagul Fibrinolysis. 2014;25:816–819. doi:10.1097/MBC.0000000000000155
- Goubran H, Hart C, Othman I, et al. Flow cytometry and immune thrombocytopenic purpura. Transfus Apher Sci. 2018;57:800–803. doi:10.1016/j.transci.2018.10.018
- Oka S, Ono K, Nohgawa M. Prediction of response to first-line therapy with ITP by flow cytometric analysis of bone marrow lymphocyte phenotypes. Int J Hematol. 2020;111:771–778. doi:10.1007/s12185-020-02847-4
- Peng J, Ma S-H, Liu J, et al. Association of autoantibody specificity and response to intravenous immunoglobulin G therapy in immune thrombocytopenia: a multicenter cohort study. J Thromb Haemost. 2014;12:497–504. doi:10.1111/jth.12524
- Feng R, Liu X, Zhao Y, et al. GPIIb/IIIa autoantibody predicts better rituximab response in ITP. Br J Haematol. 2018;182:305–307. doi:10.1111/bjh.14782
- Yu Y, Hou Y, Zhao Y, et al. Platelet autoantibody specificity and response to rhTPO treatment in patients with primary immune thrombocytopenia. Br J Haematol. 2021;194:191–194. doi:10.1111/bjh.17510
- Beardsley MD, Ertem MD. Platelet autoantibodies in immune thrombocytopenic purpura. Transfus Sci. 1998;19:237–244. doi:10.1016/S0955-3886(98)00037-X
- Mahévas M, Ebbo M, Audia S, et al. Efficacy and safety of rituximab given at 1,000 mg on days 1 and 15 compared to the standard regimen to treat adult immune thrombocytopenia. Am J Hematol. 2013;88:858–861. doi:10.1002/ajh.23518