
ABSTRACT
Objective
To investigate the influence of the dead space in disposable blood sampling needle on activated partial thromboplastin time (APTT), FVIII level and pharmacokinetic (PK) profiles in children with hemophilia.
Methods
Children (<18 years) with severe hemophilia A were enrolled. After three days’ washout-period, blood samples were collected at pre-dose, 1 h, 3 h, 9 h, 24 h and 48 h post-infusion. At each timepoint, two 2 mL vacuum tubes with 3.2% trisodium citrate were used. The first tube was signed as ‘non-standard’ (NS) and the second tube was signed as ‘standard’ (S). FVIII activities were evaluated by one-stage assay. WAPPS-Hemo was used to generate PK profiles like half-life time (t1/2), clearance (CL), trough level and time to 1, 2 and 5IU/dL after a dose of 50 ± 10IU/dL. The FVIII activities at 9 h and 24 h post-infusion were put into WAPPS and thus brought four combinations by true or biased FVIII level that used.
Result
Compared with standard-collected blood samples, prolonged APTT results (P-values < 0.01) and decreased FVIII activity (P-values < 0.05) were revealed in those non-standard blood samples. The corresponding bias was in positive relation to both APTT-S (r = 0.44, P < 0.0001) and FVIII-S level(r = 0.68, P < 0.001). The FVIII bias percentage got larger as FVIII-S level reduced (r = −0.24, P < 0.01). During the four combinations of FVIII activity at 9 h and 24 h, statistically longer t1/2, lower CL and longer time to 1, 2 or 5IU/dL were observed in 9H-S&24H-S group and 9H-NS&24H-S group.
Conclusion
While using vacuum tubes for clotting indicators and PK profiles, the dead space of blood sampling needle should be eliminated in advance.
Introduction
Hemophilia A is a rare inherited bleeding disease due to the deficiency of coagulation factor VIII (FVIII). Individuals with hemophilia A suffer from spontaneous bleeds and joint disfunction if lack of appropriate therapy, especially for those with severe phenotype (baseline FVIII < 1IU/dL) [Citation1]. Nowadays, the main treatment of hemophilia is giving regular FVIII concentrate infusions to keep individuals’ trough FVIII level steady. However, the metabolism of FVIII varies among different children with hemophilia which could be reflected by great variability of individualized pharmacokinetic (PK) parameters [Citation2]. Thus, individualized prophylaxis with guidance of PK profiles has been recommended by the official organization like World Federation of Hemophilia (WFH) [Citation3]. To conduct PK-guided prophylaxis, precise individualized PK parameters must be obtained first. Classical PK analysis request up to 11 time-point of blood samples which brought obstacles to its wide application [Citation4]. With the combination of Bayes approach and population PK model, some online PK tools like World-Accessible Population Pharmacokinetics (WAPPS)-Hemo only request 2–3 points to estimate individualized PK parameters like half-life time and trough FVIII level [Citation5]. With the decreased blood samples, precise FVIII level of each blood sample is very vital to calculate final PK profiles.
The operation of blood sampling, as the first step of PK test, should be as accurate as possible to minimize the potential error. Since it is difficult to take blood samples from pediatric individuals, remaining needles and disposable intravenous blood sampling needles are usually used during the PK period. The air in dead space of blood sampling needles takes some place of which should be filled with blood sample and dilutes the pressure of the vacuum tube. This will lead to falsely higher proportion of anticoagulant in mixture which was proved to have influence on some indicators of anticoagulant like activated partial thromboplastin time (APTT). Although related guidelines have required that at least 90% of the volume should be fulfilled and a full level of >80% could also be acceptable for pediatric samples in citrate tubes [Citation6]. However, in clinical routine it is hard for laboratory to directly evaluate if the blood volume reaches the minimum standard simply by eyes. Considering the widely used FVIII detective method (one-stage assay), the biased APTT results and FVIII level could also affect PK parameters [Citation7]. Although a few previous studies reported the bias of FVIII level caused by the blood taking needle and vessel, no study investigated about the bias of individualized PK profiles. Thus, this study was conducted to investigate the influence of dead space in blood sampling needles on APTT result, FVIII level and individualized PK profiles of FVIII concentrates.
Materials and methods
The study was approved by the ethics committee and conducted according to the Declaration of Helsinki. Written informed consent was obtained from each enrolled patient and their legally authorized guardian(s).
Individuals
Nineteen pediatric individuals with severe hemophilia A were enrolled. The inclusion criteria were age ≤18 years; severe hemophilia A (FVIII activity <1 IU/dL); use FVIII concentrate for prophylaxis more than 150 exposure days. The exclusion criteria were the presence of a current FVIII inhibitor (anti-FVIII antibody titer >0.6 Bethesda units per ml), active bleeding or a concurrent coagulation disorder.
Blood samples
After a washout period of at least 72 h, each patient received an infusion of standard half-life FVIII by 50 ± 10 IU/kg. Peripheral venous blood samples were drawn using two 2 ml vacutainer tubes with 3.2% trisodium citrate. A previously reported blood sampling strategy was used (pre-dose, 1 h, 3 h, 9 h, 24h and 48 h after concentrate infusion) as described previously [Citation8]. Two tubes of blood sample were collected at each time point using one disposable blood sampling needle (BD, Becton, USA) with specification of 0.6*20mm*178 mm. After successful puncture, the blood sample were collected directly into the first tube. Because the dead space of the disposable blood sampling needle would take some place of which should be filled with blood sample in first tube and the second tube does not have dead space. The first tube was signed as ‘non-standard’ (NS) and the second tube was signed as ‘standard’ (S). After that, all blood samples were immediately centrifuged at 2500 g for 15 min at room temperature (20–25°C) for poor platelet plasma [Citation9]. Plasma was divided into three Eppendorf tubes (600 μl per tube) and stored in a −80°C freezer for further analysis. For each patient, FVIII level, FVIII inhibitor and blood type were determined.
Laboratory assay
The one-stage-based activated partial thromboplastin time assay was used to measure FVIII activity in a multi-dilution mode, with HemosIL® FVIII deficient plasma (Instrumentation Laboratory, Bedford, MA, USA). The APTT reagent was HemosIL® SynthAsil (Instrumentation Laboratory, Bedford, MA, USA). The Nijmegen modification of the Bethesda assay was used for determining the levels of FVIII inhibitors. An ACL TOP-700 analyzer was used to perform all measurements (Instrumentation Laboratory, Bedford, MA, USA).
PK analysis
Pharmacokinetic analysis was performed by WAPPS-Hemo [Citation10]. The following information was put into WAPPS-Hemo (https://www.wapps-hemo.org): patient number, age, height, bodyweight, blood group, baseline FVIII level, FVIII concentrate, dose, precise blood sampling time, corresponding FVIII activity at 9 h and 24 h post-infusion. Due to the influence of dead space in blood sampling needle, each blood sample had two different results of FVIII level which were signed as ‘NS’ and ‘S’ respectively for FVIII level from first blood sampling tube influenced by dead space and second tube without impact of dead space. In the real-world conduction of PK analysis, if the rule of ‘dropping the first tube’ is not strictly complied, there could be some different circumstances. Thus, this leads to four different combinations: 9h-S&24h-S, 9h-NS&24h-NS, 9h-S&24h-NS and 9h-NS&24h-S, which were evaluated individually by WAPPS-Hemo. To make the outcomes more comparable, precise baseline FVIII level at pre-dose was put into WAPPS-Hemo with all groups. Individuals’ individualized PK parameters (t1/2, half-life time; CL, clearance) and time to a fixed FVIII level (1, 2 and 5IU/dL) were determined by WAPPS-Hemo, and each patient's trough FVIII level was calculated according to their routine prophylaxis record (dose and frequency) using the clinical calculator function of WAPPS.
Statistical analysis
The statistical analysis and the figure generation were performed using GraphPad Prism for Mac (Version 9.0.1). Normally distributed data were reported as mean ± standard deviation, while non- normally distributed data were reported as median (upper quartile, lower quartile). Since most of the data was non-normally distributed, Wilcoxon tests were used to evaluate the difference. Spearman correlation coefficient was used to analyze the potential relations.
The bias of FVIII or APTT referred to the absolute value of the difference between the FVIII-S/APTT-S and FVIII/APTT-NS. The bias percentage was obtained by dividing the corresponding bias into the value of APTTS-S/FVIII-S. P-values <0.05 indicated a statistically significant difference.
Results
Individuals’ characteristics
A total of nineteen boys with severe hemophilia A were enrolled in this study. The age of this children with hemophilia was 6.96 ± 2.88 years and six of them were blood type-O. The average weight of them was 28.49 kg. In these pediatric individuals, seven of them used plasma derived FVIII concentrate while other twelve used recombinant FVIII product for prophylaxis. All our participants were confirmed with a severe phenotype by the low baseline FVIII activity (<1IU/dL). The detailed information of each patient was clearly depicted one by one in .
Table 1. Individuals’ baseline characteristics.
APTT and FVIII level of each timepoint in standard and non-standard tubes
APTT results and FVIII activity at each timepoint of two groups were analyzed. Compared with standard group, samples in non-standard group showed significant longer median APTT results at pre-dose (124.3 vs. 108.6s, P < 0.0001), 1 h (40.6 vs. 36.6s, P < 0.001), 3 h (39.0 VS. 35.1, P < 0.001), 9 h (42.5 VS. 41.4, P < 0.01), 24 h (51.9 vs. 48.9, P < 0.01) and 48 h (65.9 vs. 65.8, P < 0.01) post-infusion. Correspondingly, lower median FVIII level were revealed in the non-standard group at pre-dose (0.5 vs. 0.6IU/dL, P < 0.01), 1 h (96.5 vs. 102.4 IU/dL, P < 0.01), 3 h (78.2 vs. 87.2 IU/dL, P < 0.0001), 9 h (49.2 vs. 51.3 IU/dL, P < 0.001), 24 h (14.7 vs. 20.1 IU/dL, P < 0.001) and 48 h (4.2 vs. 4.7 IU/dL, P < 0.05) post-infusion ( and ).
Figure 1. Comparation of standard and non-standard APTT and FVIII level at different timepoint groups. A. The FVIII level at predose, 1 h, 3 h, 9 h, 24 and 48 h in non-standard group and standard group. B. The APTT at predose, 1 h, 3 h, 9 h, 24 and 48 h in non-standard group and standard group. APTT, activated partial thromboplastin time. S, standard; NS, non-standard.
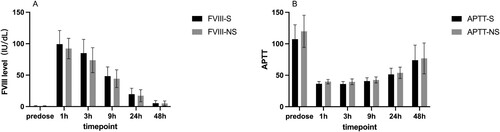
Table 2. APTT results and FVIII activity of standard and non-standard tubes.
Relationship between FVIII/APTT change and APTT/FVIII results in full draw vessels
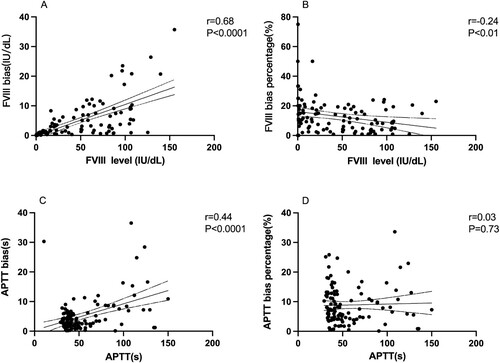
The relationships between the bias or bias percentage and standard results (FVIII-S/APTT-S) were also analyzed. The value of bias has a positive correlation to APTT-S (r = 0.44, P < 0.0001) and FVIII-S level (r = 0.68, P < 0.0001), which was showed in . However, the bias percentage got smaller as the FVIII-S level increased (r = −0.24, P < 0.01). No relationship between APTT bias percentage and APTT-S result was found in our individuals (r = 0.03, P = 0.73).
Figure 2. A. Relationship between FVIII bias and standard FVIII level. B. Relationship between FVIII bias percentage and standard FVIII level. C. Relationship between APTT bias and standard APTT result. D. Relationship between APTT bias percentage and standard APTT result. The value of bias has a positive correlation to APTT-S (r = 0.44, P < 0.0001) and FVIII-S level (r = 0.68, P < 0.0001). The bias percentage got smaller as the FVIII-S level increased (r = −0.24, P < 0.01). No relationship between APTT bias percentage and APTT-S result was found in our patients (r = 0.03, P = 0.73). APTT, activated partial thromboplastin time. Spearman correlation coefficient was used to analyze the potential relations.
PK parameters and trough level calculated by WAPPS-Hemo
Compared with 9h-S&24h-S group, shorter t1/2 was found in 9h-NS&24h-NS group (9.0 vs. 9.75 h, P < 0.001) and 9h-S&24h-NS (8.75 vs. 9.75 h, P < 0.001). Although median t1/2 of 9h-NS&24h-S group were higher than that of standard group, the difference was not statistically significant (9.88 vs. 9.75 h, P = 0.06). The CL of 9h-S&24h-S group was statistically lower than that of 9h-NS&24h-NS group (3.94 vs. 4.28 ml/kg/h, P < 0.05), 9h-S&24h-NS group (3.94 vs. 4.17 ml/kg/h) and 9h-NS&24h-S group (3.94 vs. 4.01 ml/kg/h, P < 0.05).
The shorter t1/2 and higher CL in 9H-NS&24H-NS group and 9H-S&24H-nonS group divided three individuals into trough level below 1IU/dL, who had a higher trough level (>1IU/dL) in the other two groups. The times to 1, 2, and 5 IU/dl were also analyzed. The time to 1, 2 and 5IU/dL was not significant different between 9H-S&24H-S and 9H-NS&24H-S group (P > 0.05). But compared with 9H-NS&24H-NS group and 9h-S&24h-NS group owned statistically shorter time to 1, 2 or 5IU/dL (P < 0.0001) ().
Table 3. Pharmacokinetic profiles estimated by WAPPS-Hemo.
Discussion
In this study, the influence of the dead space in disposable blood sampling needle on APTT results, FVIII activity and PK parameters were investigated. Related bias of about mentioned indicators was revealed during the comparation between standard group and non-standard groups. Although some guidelines recommended an acceptable filling level of 80% for citrated tubes, this study added robust data of the influence of dead space in blooding sampling needles on both FVIII activity and individualized PK parameters.
APTT results and FVIII activity
APTT is a commonly used laboratory indicator for hemorrhagic disease, especially for the screening of hemorrhage etiology and the monitoring of heparin anticoagulant therapy [Citation11]. In addition, since the APTT-based one-stage assay is the most widely used method to determine FVIII level, it would be hard for individuals to get accurate results of FVIII level with biased APTT result [Citation12]. In individuals with hemophilia A who suffer from the deficiency of FVIII, the accurate result of FVIII level is vital for them to get right diagnosis of disease type and receive appropriate treatment with individualized dosing regimen. As previously reported, the APTT tend to be longer (71.2 vs. 62.7s) if blood samples were taken with partial draw tube in individuals treated with heparin [Citation13]. In another study, Jamie et al. conducted similar research and got the same conclusion in two hospitals (64.6 vs. 53.6s; 62.7 vs. 50.1s) [Citation14]. Our results clearly revealed the longer APTT results and lower FVIII level in non-standard group with dead space, which was in accordance with previous studies. The abnormally less blood sample and falsely higher proportion of anticoagulant in final mixture is the reason for the bias.
The bias and bias percentage of APTT and FVIII level were also explored in this study, which was not previously investigated in children with hemophilia. Although the bias was positively correlated with FVIII-S level, the bias percentage got more obvious when the FVIII-S value was smaller. This means larger deviations may occur in samples with lower FVIII concentrations, which is very important as the standard line for diagnosis of hemophilia A was relatively as low as 1 and 5IU/dL. Lack of reject tube could cause considerable bias in those low-FVIII samples, such as those which were collected for diagnosis of severe or moderate hemophilia A. The bias percentage of APTT did not have such a linkage in our study. In ACL TOP 700 machine, the APTT-FVIII curve consists of two curves that are not the same but partially overlapped. APTT changes were more pronounced at lower FVIII intervals compared with higher FVIII range. This complicated and nonlinear relationship between FVIII level and APTT result explained the lack of linear relationship between APTT and its bias percentage [Citation11].
PK profiles of FVIII concentrates in pediatric individuals with severe hemophilia A
In the newest guideline of hemophilia, prophylaxis is still the standard treatment nowadays [Citation3]. Due to the great variability of individualized PK profiles and bleeding phenotype, there is no ‘one-size fits all’ dosing regimen. As recommended by official body like International Society of Thrombosis and Hemostasis (ISTH), online PK tools like WAPPS-Hemo and MyPKFit could be utilized to optimize the prophylaxis for individuals with hemophilia A [Citation4]. According to their manual and some previous studies, blood samples at two specific timepoint after dosing would be enough to estimate PK parameters and generate dosing regimens [Citation9]. Due to the limited available FVIII products in MyPKFit, the WAPPS-Hemo was selected in our research. In the real-world conduction of PK analysis, the blood sample of PK test could be ‘non-standard’ if taken as the first tube, but also could be ‘standard’ if it was taken after other blood samples (because the dead space would be fulfilled before taking the sample for PK). Thus, different scenarios could occur. Our study showed that the inaccurate FVIII level caused by ignorance of the dead space in disposable blood sampling needles will lead to statistically different PK parameters, like shorter t1/2 and faster CL. Since the FVIII level in non-standard group was lower than that in standard group, the ‘9h-NS&24h-S’ group had the longest average t1/2 determined by the falsely reduced slope. Correspondingly, the shortest t1/2 appeared in ‘9h-S&24h-NS’ group which attributed to the lower FVIII level at 24 h post-infusion. The CL was statistically different between any two groups of them, which partly attributed to the different steady state volume of distribution among our individuals.
We also analyzed their trough level according to their routine dosing regimen. These inaccurate parameters caused by variable FVIII level in PK assessment brought our three individuals into different trough level groups (>1 or <1IU/dL), which would lead to potential bias in determining dosing regimens. In the four PK groups of our study, the longest median bias of time to 1IU/dL have reached 8.5 h. According to Collins et al., the bleeding rates were correlated with the average time with low FVIII level, which indicates the inaccurate result might cause accidental bleeds due to the possible over-estimated trough FVIII level in routine prophylaxis [Citation2]. On the other hand, the under-estimated PK profiles could lead to unnecessary waste of FVIII concentrate when aimed for the same target trough level. With the development of online PK tools like WAPPS-Hemo which based on Bayes method, reduced blood sampling approach provide children with hemophilia with fast and convenient population PK assay to evaluate individualized PK profiles [Citation15]. Thus, accurate blood collection time and precise FVIII level are vital and necessary to produce exact PK profiles and evaluate the FVIII level in routine prophylaxis.
In conclusion, our study confirmed the prolonged APTT results and decreased FVIII activity in the partial-draw vacuum tube which were caused by the dead space in disposable blood sampling needle. In addition, PK parameters (t1/2 and CL) calculated by WAPPS-Hemo would also be influenced due to the inaccurate FVIII level. While taking blood sample with disposable blood sampling needles for FVIII level and individualized profiles, the dead space should be filled with blood before sample collection to avoid partial-draw tubes.
Ethics statements
The studies involving human participants were reviewed and approved by the Ethics Committee of Beijing Children’s Hospital, Capital Medical University, National Children’s Medical Center. Written informed consent to participate in this study was provided by the participants’ legal guardian/next of kin.
Authorship
Ai Di and Kun Huang performed the PK tests, analyzed the data, and wrote the manuscript. Yingzi Zhen and Gang Li helped with collection of blood samples, did the laboratory tests and wrote part of the manuscript. Zhenping Chen reviewed and modified the manuscript. Runhui Wu designed the study and reviewed the manuscript.
Acknowledgements
We thank Dr. Alfonso Iorio and his team for their generous help of WAPPS-Hemo.
Disclosure statement
No potential conflict of interest was reported by the author(s).
Data availability statement
The data that support the findings of this study are available from the corresponding author upon reasonable request.
Additional information
Funding
References
- Collins PW, Blanchette VS, Fischer K, et al. Break-through bleeding in relation to predicted factor VIII levels in patients receiving prophylactic treatment for severe hemophilia A. J Thromb Haemost. 2009;7(3):413–420. doi: 10.1111/j.1538-7836.2008.03270.x
- Collins PW, Fischer K, Morfini M, et al. Implications of coagulation factor VIII and IX pharmacokinetics in the prophylactic treatment of haemophilia. Haemophilia. 2011;17(1):2–10. doi: 10.1111/j.1365-2516.2010.02370.x
- Srivastava A, Santagostino E, Dougall A, et al. WFH guidelines for the management of hemophilia, 3rd edition. Haemophilia. 2020;26(S6):1–158. doi: 10.1111/hae.14046
- Ragni MV, Croteau SE, Morfini M, et al. Pharmacokinetics and the transition to extended half-life factor concentrates: communication from the SSC of the ISTH. J Thromb Haemost. 2018;16(7):1437–1441. doi: 10.1111/jth.14153
- McEneny-King A, Chelle P, Foster G, et al. Development and evaluation of a generic population pharmacokinetic model for standard half-life factor VIII for use in dose individualization. J Pharmacokinet Pharmacodyn. 2019;46(1):411–426. doi: 10.1007/s10928-019-09634-7
- Lippi G, Salvagno G, Montagnana M, et al. Quality standards for sample collection in coagulation testing. Semin Thromb Hemost. 2012;38(6):565–575. doi: 10.1055/s-0032-1315961
- Aarsand AK, Kristoffersen AH, Sandberg S, et al. The European biological variation study (EuBIVAS): biological variation data for coagulation markers estimated by a Bayesian model. Clin Chem. 2021;12:1–12.
- Huang K, Zhen Y, Li G, et al. Pharmacokinetic-guided prophylaxis improved clinical outcomes in paediatric patients with severe haemophilia A. Haemophilia. 2021;27(4):e450–e457.
- Blanchette VS, Zunino L, Grassmann V, et al. A practical, one-clinic visit protocol for pharmacokinetic profile generation with the ADVATE myPKFiT dosing tool in severe hemophilia A subjects. Thromb Haemost. 2021;121(10):1326–1336. doi: 10.1055/a-1376-0970
- McEneny-King A, Yeung CHT, Edginton AN, et al. Clinical application of web accessible population pharmacokinetic service—hemophilia (WAPPS-Hemo): patterns of blood sampling and patient characteristics among clinician users. Haemophilia. 2020;26(1):56–63. doi: 10.1111/hae.13882
- Milos M, Coen Herak D, Mahmoud Hourani Soutari N, et al. Overall hemostasis potential and aPTT-clot waveform analysis as powerful laboratory diagnostic tools for identification of hemophilia A patients with unexpected bleeding phenotype. Int J Lab Hematol. 2021;43(2):273–280. doi: 10.1111/ijlh.13347
- Salvagno GL, Demonte D, Poli G, et al. Impact of low volume citrate tubes on results of first-line hemostasis testing. Int J Lab Hematol. 2019;41(4):472–477. doi: 10.1111/ijlh.13028
- Keating GM. BAY 81-8973 (Octocog Alfa; Kovaltry®): a review in haemophilia A. BioDrugs. 2016;30(5):453–459. doi: 10.1007/s40259-016-0191-4
- Siegel JE, Bernard DW, Swami VK, et al. Monitoring heparin therapy: APTT results from partial- vs full-draw tubes. Am J Clin Pathol. 1998;110(2):184–187. doi: 10.1093/ajcp/110.2.184
- McEneny-King A, Foster G, Iorio A, et al. Data analysis protocol for the development and evaluation of population pharmacokinetic models for incorporation into the web-accessible population pharmacokinetic service – hemophilia (WAPPS-Hemo). JMIR Res Protoc. 2016;5(4):e232. doi: 10.2196/resprot.6559