
ABSTRACT
Objective
Plant homeodomain finger protein 19 (PHF19) regulates hematopoietic stem cell differentiation and promotes multiple myeloma (MM) progression. This study intended to explore the potency of PHF19 at baseline and post induction treatment in estimating treatment response to protease inhibitors and survival in MM patients.
Methods
This retrospective study screened 69 MM patients who received protease inhibitors with bone marrow (BM) samples available at both baseline and post induction treatment. Twenty healthy BM donors were included as healthy controls (HCs). PHF19 in plasma cells from BM was quantified by reverse transcription-quantitative polymerase chain reaction.
Results
PHF19 at baseline and post induction treatment in MM patients were increased than in HCs. In MM patients, PHF19 was declined post induction treatment. Elevated PHF19 at baseline and post induction treatment were correlated with renal impairment, beta-2-microglobulin ≥5.5 mg/L, t (4; 14), higher international staging system (ISS) stage, and higher revised ISS (R-ISS) stage. Concerning treatment response, PHF19 at baseline and post induction treatment were negatively associated with complete response and overall response rate. Notably, abnormal PHF19 (above 95% quantile value of PHF19 in HCs) at baseline and post induction treatment were linked with shortened event-free survival (EFS) and overall survival (OS). After adjustment, abnormal PHF19 post induction treatment was independently related to shortened EFS (hazard ratio = 2.474) and OS (hazard ratio = 3.124).
Conclusion
PHF19 is aberrantly high and declines post induction therapy, which simultaneously reflects unfavorable treatment response to protease inhibitors as well as shorter EFS and OS in MM patients.
Introduction
Multiple myeloma (MM), manifested by excessive plasma cell accumulation in bone marrow (BM), is the second most common hematological malignancy following non-Hodgkin lymphoma [Citation1]. It is estimated that the global incidence of MM was 1.78 per 100,000 people in 2020; meanwhile, in China, the MM incidence increased by 0.73% each year from 2001 to 2019 [Citation2]. Substantial improvement in clinical outcomes of MM patients has been seen since the emergence of proteasome inhibitors, which changed the paradigm of front-line induction therapy recommended for MM [Citation3,Citation4]. Unfortunately, many MM patients experience drug resistance or disease recurrence and the age-standardized mortality rate of MM in China has increased from 2004 to 2017, which represents an ever-growing disease burden [Citation5–7]. Consequently, exploring biomarkers to estimate the treatment response to protease inhibitors and survival of MM patients and further assist therapeutic decision-making is needed [Citation8].
Plant homeodomain finger protein 19 (PHF19, also named as polycomb-like 3), preferentially expressed in mouse hematopoietic precursors, is an epigenetic regulator that activates the polycomb repressive complex 2 (PRC2) [Citation9,Citation10]. Concerning the engagement of PHF19 in MM progression, one in vitro study discloses that PHF19 knockdown retards MM cell proliferation [Citation11]. Another study elucidates that PHF19 enhances MM tumorigenicity and aggressiveness by regulating tri-methylation at lysine 27 of histone H3 (H3K27me3) accumulation [Citation12]. Clinically, one previous study shows that elevated PHF19 expression is linked with higher international staging system (ISS) stage and elevated beta-2-microglobulin (β2-MG) in MM patients, but it does not exhibit the linkage of PHF19 with treatment response to protease inhibitors [Citation13]. Only one recent study identifies that PHF19 is related to less occurrence of complete response (CR) and unfavorable progression-free survival and overall survival (OS) in MM patients treated with combination induction treatment of proteasome inhibitors, immunomodulators, and dexamethasone [Citation14]. However, this aforementioned study only determines PHF19 for one time at enrollment and the mean age of enrolled patients is 53.8 ± 8.7, which is below the median onset age of MM (ranges between 63 and 70 years) [Citation14,Citation15]. Therefore, the change of PHF19 expression after induction treatment as well as its value for estimating treatment response to protease inhibitors and survival in MM patients warrant more investigation.
Hence, the current study quantified PHF19 expression both at baseline and post induction treatment, aiming to explore the potency of PHF19 expression as a biomarker to estimate treatment response to protease inhibitors and survival in MM patients.
Methods
Study population
A total of 69 MM patients who were treated with protease inhibitors between February 2020 and June 2023 were screened in this study. The inclusion criteria were: (i) newly diagnosed with MM via International Myeloma Working Group (IMWG2014) recommendation [Citation16]; (ii) aged ≥18 years old; (iii) had no relevant treatment histories about MM; (iv) received protease inhibitors treatment; (v) had available BM samples collected at diagnosis (baseline) and post induction treatment that could be used; (vi) had complete data of clinical characteristics and at least one available follow-up data. Patients who were diagnosed as secondary MM or relapsed MM, or accompanied by other malignancies were excluded. Besides, twenty healthy BM donors were included as healthy controls (HCs). This study obtained approval from the Ethics Committee. All subjects or their families provided informed consent.
Data collection
Clinical characteristics including demographics and disease-related features were collected. The data about prognostic stratification were also screened, such as the ISS stage and revised international staging system (R-ISS) stage [Citation17,Citation18]. Additionally, regimens of induction treatment used in this study were retrieved, which contained (i) bortezomib + lenalidomide + dexamethasone, (ii) bortezomib + cyclophosphamide + dexamethasone, and (iii) bortezomib + dexamethasone. Regimen (i) was the conventional standard treatment, regimen (ii) was used among patients with renal impairment, and regimen (iii) was applied for those advanced age and/or infirmity patients who were unable to tolerate a triple-drug combination treatment.
PHF19 expression
Available BM samples from MM patients and HCs were acquired. Then, plasma cells were obtained from BM samples for PHF19 expression detection. The PHF19 expression in the plasma cells was determined via reverse transcription-quantitative polymerase chain reaction (RT-qPCR) assay. The RNeasy Protect Mini Kit (Qiagen, Germany), iScript™ cDNA Synthesis Kit (with random primer) (Bio-Rad, USA), and KOD SYBR® qPCR Mix (TOYOBO, Japan) were used for total RNA extraction, cDNA synthesis, and qPCR, respectively, according to the product manual. The glyceraldehyde-3-phosphate dehydrogenase (GAPDH) was considered as an internal reference, and the final results were calculated using the 2−ΔΔCt method. The primer of PHF19 was forward 5′-ACTCGGGACTCCTATGGTGC-3′, and reverse 5′-CCTCCGTCAGTTTGGACATCA-3′. The primer of GAPDH was forward 5′-GGAGCGAGATCCCTCCAAAAT-3′, and reverse 5′-GGCTGTTGTCATACTTCTCATGG-3′.
Follow-up
The routine follow-up protocol was retrieved, which was conducted every 3 months for the first year and every 6 months thereafter, with immediate follow-up for any special cases. The median follow-up time was 17.8 months with a follow-up range of 2.9–37.1 months. Besides, disease response and follow-up data were collected. The accumulating event-free survival (EFS) and accumulating OS rates were calculated. EFS was defined as the duration from diagnosis to relapse, disease progression, or death; OS was defined as the time from diagnosis to death for any reason.
Statistical analyses
SPSS v.26.0 (IBM, USA) was utilized for data analysis. Normal distribution test was conducted via Kolmogorov–Smirnov test. Comparison analysis was determined via the Wilcoxon signed rank test, Wilcoxon rank sum test, or Kruskal-Willis H rank sum test. Specifically, Wilcoxon signed rank test was used to compare PHF19 expression at baseline and post induction treatment; Wilcoxon rank sum test was used to compare PHF19 expression between two groups; and Kruskal-Willis H rank sum test was used to compare PHF19 expression among three groups. Correlations analyses between variates were determined by Spearman's test. PHF19 expression of MM patients was stratified into normal and abnormal expressions cut by 3.05, which was the 95% quantile value of HCs. PHF19 expression change of MM patient was also evaluated, which defined as the PHF19 expression post induction treatment minus expression at baseline. PHF19 expression change was further divided into high and low levels via its median value (−0.84). Accumulating EFS/OS were displayed via Kaplan-Meier curves, and comparisons of accumulating EFS/OS between MM patients with normal and abnormal PHF19 expressions were conducted using the Log-rank test. The comparisons of accumulating EFS/OS between high and low levels of PHF19 change were also conducted using the Log-rank test. The factors associated with EFS/OS were found through univariate and forward-multivariate Cox regression models. P < 0.05 indicated statistical significance.
Results
MM patients’ clinical features
The 69 MM patients, consisting of 42 (60.9%) males and 27 (39.1%) females, had a mean age of 65.8 ± 9.0 years, and there were 38 (55.1%) patients aged ≥65 years. Thirty-three (47.8%), 17 (24.6%), and 19 (27.5%) patients were recognized as immunoglobulin G (IgG), immunoglobulin A (IgA), and other immunoglobulin subtypes, respectively. A total of 50 (72.5%) patients had bone lesion. Moreover, the median (interquartile range (IQR)) albumin (ALB) and β2-MG were 32.0 (26.6∼38.0) g/L and 4.9 (3.3∼9.1) mg/L. There were 11 (15.9%), 4 (5.8%), and 6 (8.7%) patients with the presence of t (4; 14), t (14; 16), and del (17p), accordingly. Besides, 11 (15.9%), 27 (39.1%), and 31 (44.9%) patients were assessed as ISS stage I, II, and III, respectively; 9 (13.0%), 37 (53.6%), and 23 (33.3%) patients were evaluated as R-ISS stage I, II, and III, correspondingly. Concerning the treatment regimens, 37 (53.6%) patients received bortezomib + lenalidomide + dexamethasone; 20 (29.0%) patients were treated with bortezomib + cyclophosphamide + dexamethasone; 12 (17.4%) patients received bortezomib + dexamethasone. Baseline characteristics were presented in .
Table 1. Clinical characteristics of MM patients.
PHF19 expression in MM patients and HCs
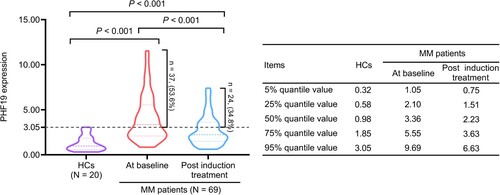
PHF19 expression at baseline in MM patients was increased compared with HCs (P < 0.001). After induction treatment, PHF19 expression was declined in MM patients (P < 0.001). While PHF19 expression post induction treatment in MM patients was elevated than in HCs (P < 0.001). The median (IQR) PHF19 expression was 0.98 (0.58∼1.85) in HCs. While the median (IQR) PHF19 expression was 3.36 (2.10∼5.55) at baseline and 2.23 (1.51∼3.63) post induction treatment in MM patients. Furthermore, the PHF19 expression in MM patients was stratified into normal and abnormal cut by the 95% quantile value of PHF19 expression in HCs (3.05). As a result, 37 (53.6%) patients had abnormal PHF19 expression at baseline and 24 (34.8%) patients had abnormal PHF19 expression post induction treatment ().
Figure 1. PHF19 expression was aberrantly high and declined post induction treatment in MM patients.
Linkage of PHF19 expression at baseline and post induction treatment with clinical features in MM patients
Elevated PHF19 expression at baseline was related to the presence of renal impairment (P = 0.012), β2-MG ≥5.5 mg/L (P = 0.008), presence of t (4; 14) (P = 0.028), higher ISS stage (P = 0.003), and higher R-ISS stage (P = 0.002). Similarly, increased PHF19 expression post induction treatment was associated with the presence of renal impairment (P = 0.020), β2-MG ≥5.5 mg/L (P = 0.029), presence of t (4; 14) (P = 0.019), higher ISS stage (P = 0.004), and higher R-ISS stage (P = 0.001) in MM patients. The findings indicated that PHF19 owned the potency to reflect renal insufficiency, myeloma cell activity, cytogenetic alterations, and prognostic stratification in MM patients ().
Table 2. Correlation of PHF19 expression with clinical characteristics of MM patients.
Linkage of PHF19 expression with treatment response to protease inhibitors in MM patients
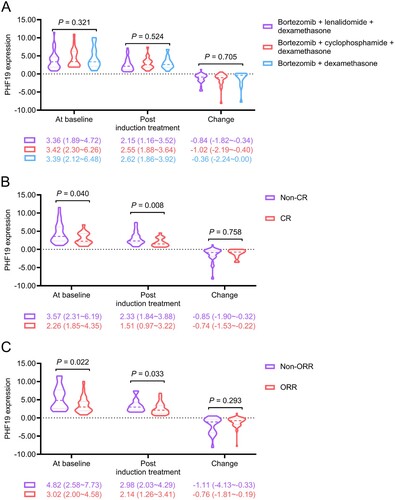
PHF19 expression at baseline (P = 0.321) and post induction treatment (P = 0.524), as well as its change (P = 0.705) were not linked with the treatment regimen ((A)). After treatment, 18 (26.1%) patients achieved CR and 52 (75.4%) patients had overall response rate (ORR). PHF19 expression at baseline (P = 0.040) and post induction treatment (P = 0.008) were both negatively related to CR, while PHF19 expression change was not associated with CR (P = 0.758) ((B)). In addition, PHF19 expression at baseline (P = 0.022) and post induction treatment (P = 0.033) were negatively correlated with ORR; whereas PHF19 expression change was not related to ORR (P = 0.293) in MM patients ((C)).
Figure 2. PHF19 expression at baseline and post induction treatment were negatively linked with CR and ORR in MM patients. Correlation of PHF19 expression at baseline, post induction treatment, and its change with treatment regimens (A), CR (B), and ORR (C). PHF19 expression change equaled to PHF19 expression post induction treatment minus its expression at baseline.
Linkage of PHF19 expression with EFS and OS in MM patients
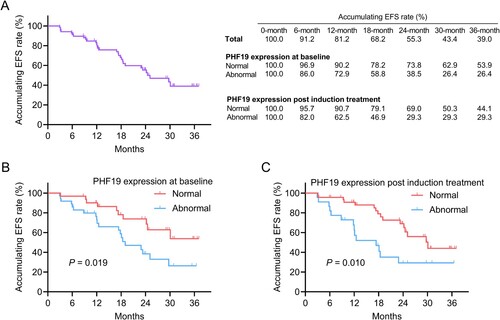
Until the final follow up, 30 (43.5%) events occurred. The 6-, 12-, 18-, 24-, 30-, and 36-month accumulating EFS rates were 91.2%, 81.2%, 68.2%, 55.3%, 43.4%, and 39.0%, respectively. Meanwhile, the accumulating EFS rates at these timepoints in patients with normal and abnormal PHF19 expression at baseline as well as post induction treatment were shown in (A). Abnormal PHF19 expression at baseline (P = 0.019) ((B)) and post induction treatment (P = 0.010) ((C)) were linked with shortened EFS in MM patients. Moreover, PHF19 expression change was not linked with EFS (P = 0.445) (Supplementary Figure 1A) or OS (P = 0.259) (Supplementary Figure 1B) in MM patients.
Figure 3. Abnormal PHF19 expression at baseline and post induction treatment were associated with shorter EFS in MM patients. The accumulating EFS rates (A). Linkage of abnormal PHF19 expression at baseline (B) and post induction treatment (C) with EFS.
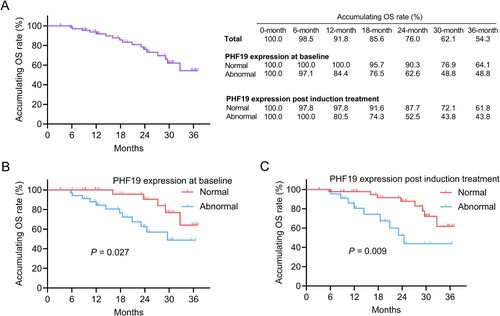
In total, 17 (24.6%) death cases were documented until the last follow up. The 6-, 12-, 18-, 24-, 30-, and 36-month accumulating OS rates were 98.5%, 91.8%, 85.6%, 76.0%, 62.1%, and 54.3%, correspondingly. Also, the accumulating OS rates at these timepoints in patients with normal and abnormal PHF19 expression at baseline and post induction treatment were presented in (A). Abnormal PHF19 expression at baseline (P = 0.027) ((B)) and post induction treatment (P = 0.009) ((C)) were correlated with shorter OS in MM patients.
Figure 4. Abnormal PHF19 expression at baseline and post induction treatment were associated with shorter OS in MM patients. The accumulating OS rates (A). Linkage of abnormal PHF19 expression at baseline (B) and post induction treatment (C) with OS.
Influencing factors for EFS and OS in MM patients
The univariable Cox regression model exhibited that abnormal PHF19 expression at baseline (P = 0.023), abnormal PHF19 expression post induction treatment (P = 0.012), renal impairment (P = 0.031), hemoglobin (Hb) < 100 g/L (P = 0.041), β2-MG ≥5.5 mg/L (P = 0.006), lactate dehydrogenase (LDH) ≥ 220 U/L (P = 0.014), t (4; 14) (P = 0.027), t (14; 16) (P = 0.040), ISS stage (per stage) (P = 0.004), and R-ISS stage (per stage) (P < 0.001) were linked with shorter EFS in MM patients. After further adjustment, abnormal PHF19 expression post induction treatment (hazard ratio (HR) = 2.474, P = 0.015), age ≥65 years (HR = 2.601, P = 0.016), and β2-MG ≥5.5 mg/L (HR = 3.125, P = 0.004) were independent factors for shortened EFS in MM patients ().
Table 3. Cox regression model of EFS.
Additionally, abnormal PHF19 expression at baseline (P = 0.035), abnormal PHF19 expression post induction treatment (P = 0.013), renal impairment (P = 0.018), β2-MG ≥5.5 mg/L (P = 0.003), t (4; 14) (P = 0.003), ISS stage (per stage) (P = 0.006), and R-ISS stage (per stage) (P = 0.002) were influencing factors for shorter OS in MM patients. After adjustment by the multivariable Cox regression model, abnormal PHF19 expression post induction treatment (HR = 3.124, P = 0.040), age ≥65 years (HR = 4.394, P = 0.011), β2-MG ≥5.5 mg/L (HR = 6.157, P = 0.003), and t (4; 14) (HR = 3.910, P = 0.031) were independently associated with shortened OS in MM patients ().
Table 4. Cox regression model of OS.
Discussion
Diverse biological transitions in the proliferation of embryonic and hematopoietic stem cells and tumor growth are controlled by H3K27me3 (a histone signature), meanwhile, PHF19 is a core regulator of H3K27me3 catalysis [Citation9,Citation19–21]. Subsequently, PHF19 plays an influential role in the genetic stability and pathological process of solid cancers and hematopoietic malignancies [Citation10]. Also, several clinical studies observed the aberrant expression of PHF19 in patients with hematological malignancy (particularly in MM patients) [Citation12,Citation13,Citation22]. For instance, one study based on the Cancer Cell Line Encyclopedia transcriptome dataset shows increased PHF19 expression in B-cell-derived malignancies [Citation12]. Another study presents that PHF19 expression is increased in symptomatic MM patients and primary plasma cell leukemia patients compared with healthy subjects [Citation13].
The present study determined PHF19 expression at baseline and post induction treatment in MM patients, which were both higher than in HCs. The probable reason was as follows: PHF19 exacerbated aggressive MM malignant behaviors (such as cell proliferation and cell growth) via modulating B-cell lymphoma-extra-large (Bcl-xL) and inducing enhancer of zeste homolog 2 (EZH2) phosphorylation-related inactivation [Citation23,Citation24]. Consequently, PHF19 expression at baseline and post induction treatment in MM patients were both elevated compared to HCs. Intriguingly, it was also observed that PHF19 expression declined after induction treatment. A possible explanation was that: Akt, a central node in MM, is the upstream regulator of PHF19 expression, which elevates the expression of PHF19 in tumor [Citation25,Citation26]. While Akt expression in MM is reduced after protease inhibitor treatment [Citation27]. Consequently, PHF19 expression was reduced after induction treatment in MM patients.
In addition, this study showed that elevated PHF19 expression at baseline and post induction treatment were related to β2-MG ≥5.5 mg/L in MM patients. The likely explanation was as follows: Elevated PHF19 triggered the production of platelets and lymphocytes, and the latter (platelets and lymphocytes) generated β2-MG [Citation9,Citation28,Citation29]. Therefore, elevated PHF19 expression at baseline and post induction treatment were related to β2-MG ≥5.5 mg/L in MM patients. Besides, it was also noticed that increased PHF19 expression at baseline and post induction treatment were associated with the presence of renal impairment in MM patients, which might be explained by that: PHF19 was positively linked with β2-MG, and the accumulation of β2-MG exacerbated injury of renal tubules [Citation30]. Thus, increased PHF19 expression at baseline and post induction treatment were linked with renal impairment in MM patients.
t (4; 14), t (14; 16), and del (17p) are typical cytogenetic alterations in MM; meanwhile, PHF19 is currently identified as an important driver of myeloma, which is supposed to be positively linked with these cytogenetic alterations [Citation11]. However, in the current study, elevated PHF19 expression at baseline and post induction treatment were only related to the presence of t (4; 14) in MM patients, but it was not correlated with t (14; 16) or del (17p). A probable reason was that: According to the previous studies, t (4; 14) was the most common cytogenetic abnormality of MM patients [Citation11,Citation31]. Consistently, 11 (15.9%) MM patients in this study presented t (4; 14); while only a respect of 4 (5.8%) and 6 (8.7%) patients had the presence of t (14; 16) and del (17p). Then, the statistical power of the correlation analyses was weakened. Consequently, the correlation of PHF19 with the cytogenetic characteristics of MM patients required further investigation.
ISS system, based on β2-MG and ALB, is first introduced in 2005 to reflect tumor burden and host status [Citation17]; thereafter, with the development of molecular technique, R-ISS has been adopted since 2015, which adds cytogenetic abnormalities (including t(4;14), t(14;16), and del(17p) and LDH [Citation18]. Interestingly, the present study disclosed that PHF19 expression at baseline and post induction treatment were related to higher ISS and R-ISS stage in MM patients, which might be explained by that: PHF19 at baseline and post induction treatment were correlated with β2-MG ≥ 5.5 mg/L and t (4; 14), and the latter two factors contributed to higher ISS and R-ISS stage [Citation17,Citation18]. Furthermore, the positive association of PHF19 with ISS and R-ISS stage reflected the potency of PHF19 in estimating clinical outcomes of MM patients.
Currently, only one study reports the negative association of PHF19 with treatment response in MM patients who receive induction treatment [Citation14]. Inspiringly, this study clued that PHF19 expression at baseline and post induction treatment were both negatively related to CR and ORR in MM patients, which can be explained by that: PHF19 induced the resistance of MM cells to anti-MM treatments, including bortezomib [Citation23]. In detail, bortezomib restrained the anti-apoptotic protein Bcl-xL to induce myeloma cell apoptosis [Citation32,Citation33]; while PHF19 increased Bcl-xL and further influenced the treatment efficacy [Citation23,Citation34]. Besides, it was noticed that PHF19 expression at baseline, PHF19 expression post induction treatment, and PHF19 expression change were not varied in MM patients with different treatment regimens, indicating that PHF19 was not influenced by the detailed treatment type in MM patients. Another interesting phenomenon was that the change of PHF19 after induction treatment was not differed between CR and Non-CR, between ORR and Non-ORR patients, while its value at baseline or post induction treatment was related to the realization of CR/ORR.
Concerning survival profile, abnormal PHF19 expression at baseline and post induction treatment were linked with shortened EFS and OS in MM patients. Furthermore, PHF19 expression post induction treatment (abnormal vs. normal) was an independent factor for shortened EFS and OS in MM patients. The possible reason was that: PHF19 facilitated MM progression and promoted drug resistance of MM cells, which ultimately shortened EFS and OS in MM patients [Citation10]. Notably, according to the NCCN guideline and ESMO guidelines, daratumumab is contained in the first-line therapy for MM regardless of transplant eligibility [Citation5,Citation35]. However, according to the Chinese guideline, proteasome inhibitors (bortezomib)-based regimen remains the first choice for newly diagnosed MM patients in China, and daratumumab, as an IgGκ monoclonal antibody targeting CD38, is frequently utilized in relapsed/refractory or transplant-ineligible MM patients [Citation36]. Consequently, this study mainly explored the potency of PHF19 to estimate treatment response to protease inhibitor-based regimen and survival in newly diagnosed MM patients. Nevertheless, daratumumab has also been supported by several trials as efficient in newly diagnosed MM patients [Citation37–39], and therefore, the prognostic value of PHF19 in MM patients who receive daratumumab needs further validation.
Some limitations should be mentioned here. First, this was a single-center study, which might affect the universalization of the findings. Second, the sample size was relatively small, thus the findings of the current study required more validation through studies with a larger sample size. Meanwhile, the number of patients with each treatment regimen was small, which weakened the statistical significance of the association between PHF19 expression and treatment regimens in MM patients. Third, though this study analyzed the variation of PHF19 expression after induction treatment, its longitudinal change in MM patients was unclear. Third, the findings of this study might be limited by the demographics of patients, which required more validations in the future. Finally, this study lacked functional investigation in vitro and in vivo to further explore the potency of PHF19 as a therapeutic target for MM patients.
Collectively, PHF19 expression is aberrantly high in MM patients and declines post induction therapy, which simultaneously reflects unfavorable treatment response to protease inhibitors as well as shorter EFS and OS in MM patients. These findings imply the assistance of PHF19 in promoting rational therapies for individual subtypes of MM patients.
Authors’ contributions
Hongyu An: Conceptualization, Data curation, Formal Analysis, Project administration, Writing – original draft, Writing – review & editing. Shiming Chen: Data curation, Investigation, Resources, Writing – original draft, Writing – review & editing. Xin Zhang: Data curation, Formal Analysis, Resources, Writing – original draft, Writing – review & editing. Shandong Ke: Data curation, Investigation, Resources, Writing – original draft, Writing – review & editing. Jinyong Ke: Data curation, Investigation, Resources, Writing – original draft, Writing – review & editing. Yalan Lu: Conceptualization, Formal Analysis, Methodology, Supervision, Writing – original draft, Writing – review & editing.
Ethical approval
This study obtained approval from the Ethics Committee.
Informed consent statement
All subjects or their families provided informed consent.
Supplementary Figure 1 new.tif
Download TIFF Image (403.9 KB)Disclosure statement
No potential conflict of interest was reported by the author(s).
References
- Cowan AJ, Green DJ, Kwok M, et al. Diagnosis and management of multiple myeloma. JAMA. 2022;327(5):464–477. doi:10.1001/jama.2022.0003
- Huang J, Chan SC, Lok V, et al. The epidemiological landscape of multiple myeloma: a global cancer registry estimate of disease burden, risk factors, and temporal trends. Lancet Haematol. 2022;9(9):e670–e677. doi:10.1016/S2352-3026(22)00165-X
- Rajkumar SV. Multiple myeloma: 2022 update on diagnosis, risk stratification, and management. Am J Hematol. 2022;97(8):1086–1107. doi:10.1002/ajh.26590
- Goel U, Usmani S, Kumar S. Current approaches to management of newly diagnosed multiple myeloma. Am J Hematol. 2022;97(Suppl 1):S3–S25. doi:10.1002/ajh.26512
- Dimopoulos MA, Moreau P, Terpos E, et al. Multiple myeloma: EHA-ESMO Clinical Practice Guidelines for diagnosis, treatment and follow-up(dagger). Ann Oncol. 2021;32(3):309–322. doi:10.1016/j.annonc.2020.11.014
- Das S, Juliana N, Yazit NAA, et al. Multiple myeloma: challenges encountered and future options for better treatment. Int J Mol Sci. 2022;23(3):1649. doi:10.3390/ijms23031649
- Liu W, Liu J, Song Y, et al. Mortality of lymphoma and myeloma in China, 2004-2017: an observational study. J Hematol Oncol. 2019;12(1):22. doi:10.1186/s13045-019-0706-9
- Gupta N, Sharma A, Sharma A. Emerging biomarkers in multiple myeloma: a review. Clin Chim Acta. 2020;503:45–53. doi:10.1016/j.cca.2019.12.026
- Vizan P, Gutierrez A, Espejo I, et al. The polycomb-associated factor PHF19 controls hematopoietic stem cell state and differentiation. Sci Adv. 2020;6(32):eabb2745. doi:10.1126/sciadv.abb2745
- Ghamlouch H, Boyle EM, Blaney P, et al. Insights into high-risk multiple myeloma from an analysis of the role of PHF19 in cancer. J Exp Clin Cancer Res. 2021;40(1):380. doi:10.1186/s13046-021-02185-1
- Mason MJ, Schinke C, Eng CLP, et al. Multiple myeloma DREAM challenge reveals epigenetic regulator PHF19 as marker of aggressive disease. Leukemia. 2020;34(7):1866–1874. doi:10.1038/s41375-020-0742-z
- Ren Z, Ahn JH, Liu H, et al. PHF19 promotes multiple myeloma tumorigenicity through PRC2 activation and broad H3K27me3 domain formation. Blood. 2019;134(14):1176–1189. doi:10.1182/blood.2019000578
- Schinke CD, Bird JT, Qu P, et al. PHF19 inhibition as a therapeutic target in multiple myeloma. Curr Res Transl Med. 2021;69(3):103290. doi:10.1016/j.retram.2021.103290
- Li Y, Gong J, Zhang L. PHD finger protein 19 expression in multiple myeloma: association with clinical features, induction therapy outcome, disease progression, and survival. J Clin Lab Anal. 2021;35(9):e23910. doi:10.1002/jcla.23910
- Dimopoulos MA, Terpos E. Multiple myeloma. Ann Oncol. 2010;21( Suppl 7):vii143–vii150. doi:10.1093/annonc/mdq370
- Ludwig H, Miguel JS, Dimopoulos MA, et al. International Myeloma Working Group recommendations for global myeloma care. Leukemia. 2014;28(5):981–992. doi:10.1038/leu.2013.293
- Greipp PR, Miguel S, Durie J, et al. International staging system for multiple myeloma. J Clin Oncol. 2005;23(15):3412–3420. doi:10.1200/JCO.2005.04.242
- Palumbo A, Avet-Loiseau H, Oliva S, et al. Revised international staging system for multiple myeloma: a report from international myeloma working group. J Clin Oncol. 2015;33(26):2863–2869. doi:10.1200/JCO.2015.61.2267
- Maeda M, Takeshima H, Iida N, et al. Cancer cell niche factors secreted from cancer-associated fibroblast by loss of H3K27me3. Gut. 2020;69(2):243–251. doi:10.1136/gutjnl-2018-317645
- Choudhury SR, Ashby C, Tytarenko R, et al. The functional epigenetic landscape of aberrant gene expression in molecular subgroups of newly diagnosed multiple myeloma. J Hematol Oncol. 2020;13(1):108. doi:10.1186/s13045-020-00933-y
- Petruk S, Cai J, Sussman R, et al. Delayed accumulation of H3K27me3 on nascent DNA Is essential for recruitment of transcription factors at early stages of stem cell differentiation. Mol Cell. 2017;66(2):247–257 e245. doi:10.1016/j.molcel.2017.03.006
- Boyle EM, Rosenthal A, Ghamlouch H, et al. Plasma cells expression from smouldering myeloma to myeloma reveals the importance of the PRC2 complex, cell cycle progression, and the divergent evolutionary pathways within the different molecular subgroups. Leukemia. 2022;36(2):591–595. doi:10.1038/s41375-021-01379-y
- Yu T, Du C, Ma X, et al. Polycomb-like protein 3 induces proliferation and drug resistance in multiple myeloma and is regulated by miRNA-15a. Mol Cancer Res. 2020;18(7):1063–1073. doi:10.1158/1541-7786.MCR-19-0852
- Garcia-Montolio M, Ballare C, Blanco E, et al. Polycomb factor PHF19 controls cell growth and differentiation toward erythroid pathway in chronic myeloid leukemia cells. Front Cell Dev Biol. 2021;9:655201. doi:10.3389/fcell.2021.655201
- Keane NA, Glavey SV, Krawczyk J, et al. AKT as a therapeutic target in multiple myeloma. Expert Opin Ther Targets. 2014;18(8):897–915. doi:10.1517/14728222.2014.924507
- Ghislin S, Deshayes F, Middendorp S, et al. PHF19 and Akt control the switch between proliferative and invasive states in melanoma. Cell Cycle. 2012;11(8):1634–1645. doi:10.4161/cc.20095
- Xu B, Li J, Xu D, et al. PLK4 inhibitor plus bortezomib exhibits a synergistic effect on treating multiple myeloma via inactivating PI3K/AKT signaling. Ir J Med Sci. 2023;192(2):561–567. doi:10.1007/s11845-022-03007-9
- Yang J, Qian J, Wezeman M, et al. Targeting β2-microglobulin for induction of tumor apoptosis in human hematological malignancies. Cancer Cell. 2006;10(4):295–307. doi:10.1016/j.ccr.2006.08.025
- Kin K, Kasahara T, Itoh Y, et al. beta2-Microglobulin production by highly purified human T and B lymphocytes in cell culture stimulated with various mitogens. Immunology. 1979;36(1):47–54.
- Schardijn GH, van Eps S, W L. β2-microglobulin: its significance in the evaluation of renal function. Kidney Int. 1987;32(5):635–641. doi:10.1038/ki.1987.255
- Schmidt-Hieber M, Gutierrez ML, Perez-Andres M, et al. Cytogenetic profiles in multiple myeloma and monoclonal gammopathy of undetermined significance: a study in highly purified aberrant plasma cells. Haematologica. 2013;98(2):279–287. doi:10.3324/haematol.2011.060632
- Lee EF, Harris TJ, Tran S, et al. BCL-XL and MCL-1 are the key BCL-2 family proteins in melanoma cell survival. Cell Death Dis. 2019;10(5):342. doi:10.1038/s41419-019-1568-3
- Luanpitpong S, Janan M, Yosudjai J, et al. Bcl-2 family members Bcl-xL and Bax cooperatively contribute to bortezomib resistance in mantle cell lymphoma. Int J Mol Sci. 2022;23(22):14474. doi:10.3390/ijms232214474
- Pinto V, Bergantim R, Caires HR, et al. Multiple myeloma: available therapies and causes of drug resistance. Cancers (Basel). 2020;12(2):407. doi:10.3390/cancers12020407
- Callander NS, Baljevic M, Adekola K, et al. Nccn guidelines(R) insights: multiple myeloma, version 3.2022. J Natl Compr Canc Netw. 2022;20(1):8–19. doi:10.6004/jnccn.2022.0002
- Zhang T, Wang S, Lin T, et al. Systematic review and meta-analysis of the efficacy and safety of novel monoclonal antibodies for treatment of relapsed/refractory multiple myeloma. Oncotarget. 2017;8(20):34001–34017. doi:10.18632/oncotarget.16987
- Mateos MV, Dimopoulos MA, Cavo M, et al. Daratumumab plus bortezomib, melphalan, and prednisone for untreated myeloma. N Engl J Med. 2018;378(6):518–528. doi:10.1056/NEJMoa1714678
- Facon T, Cook G, Usmani SZ, et al. Daratumumab plus lenalidomide and dexamethasone in transplant-ineligible newly diagnosed multiple myeloma: frailty subgroup analysis of MAIA. Leukemia. 2022;36(4):1066–1077. doi:10.1038/s41375-021-01488-8
- Facon T, Kumar SK, Plesner T, et al. Daratumumab, lenalidomide, and dexamethasone versus lenalidomide and dexamethasone alone in newly diagnosed multiple myeloma (MAIA): overall survival results from a randomised, open-label, phase 3 trial. Lancet Oncol. 2021;22(11):1582–1596. doi:10.1016/S1470-2045(21)00466-6